Segmentation Quick Reference
| Dimension | Sub-Segments | Dominant Segment | Fastest Growing Segment |
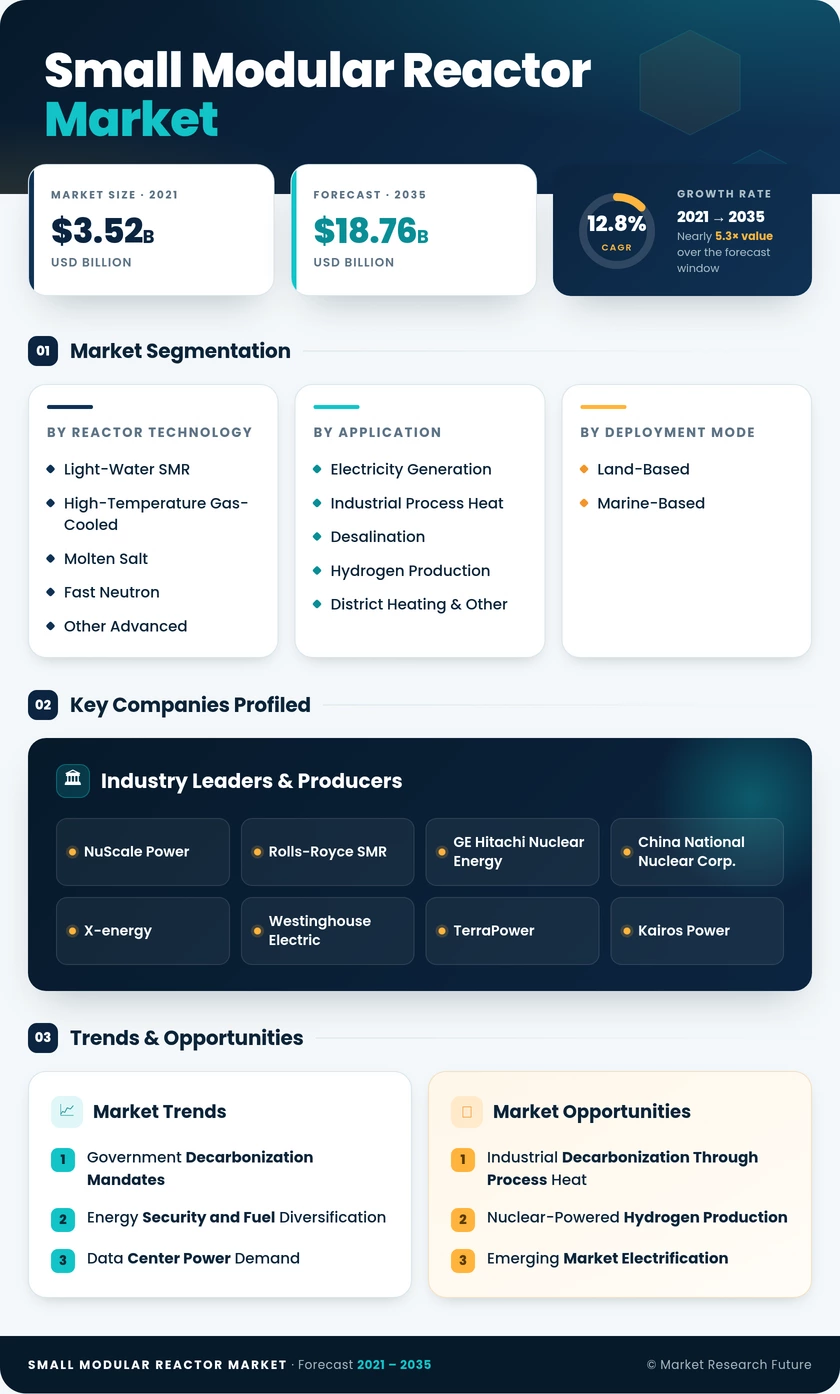
| By Reactor Small Modular Reactor Market | Light-Water SMR, High-Temperature Gas-Cooled, Molten Salt, Fast Neutron, Other Advanced | Light-Water SMR (52%) | High-Temperature Gas-Cooled (CAGR 16.4%) |
| By Application | Electricity Generation, Industrial Process Heat, Desalination, Hydrogen Production, District Heating & Other | Electricity Generation (58%) | Hydrogen Production (CAGR 17.2%) |
| By Deployment Mode | Land-Based, Marine-Based | Land-Based (78%) | Marine-Based (CAGR 15.8%) |
Market Segmentation Overview
By Reactor Small Modular Reactor Market
| Sub-Segment | Key Trend |
| Light-Water SMR | Dominates with proven PWR/BWR lineage; NuScale and GE Hitachi lead commercial licensing |
| High-Temperature Gas-Cooled | Fastest growth driven by industrial heat above 700°C and hydrogen coupling |
| Molten Salt Reactor | Gaining traction for inherent passive safety and ability to consume spent nuclear fuel |
| Fast Neutron Reactor | Focused on waste reduction and closed fuel cycle applications |
| Other Advanced Designs | Includes micro-reactors for defense, remote, and off-grid applications |
Light-water designs benefit from the most mature regulatory and supply chain infrastructure globally. Advanced high-temperature and molten salt concepts are attracting outsized venture and government investment as industrial decarbonization demand intensifies.
By Application
| Sub-Segment | Key Trend |
| Electricity Generation | Core market — utility baseload and data center power purchase agreements |
| Industrial Process Heat | Steel, cement, and petrochemical sectors seeking high-temperature nuclear heat |
| Desalination | Middle East and North Africa driving coupled power-desalination SMR deployments |
| Hydrogen Production | High-temperature electrolysis coupling emerging as highest-growth use case |
| District Heating & Other | Nordic and Eastern European municipalities evaluating nuclear district heating |
Electricity generation provides the revenue foundation, while hydrogen production and industrial heat represent the highest marginal growth opportunities over the forecast period.
By Deployment Mode
| Sub-Segment | Key Trend |
| Land-Based | Standard grid-connected deployment for utility, industrial, and data center sites |
| Marine-Based | Floating nuclear power plants for remote coastal, island, and Arctic operations |
Land-based deployment will remain dominant through 2035, but marine-based platforms are gaining strategic importance for resource extraction sites and island nations lacking grid infrastructure.