SEGMENTATION QUICK REFERENCE
| Dimension | Sub-Segments | Dominant Segment | Fastest Growing Segment |
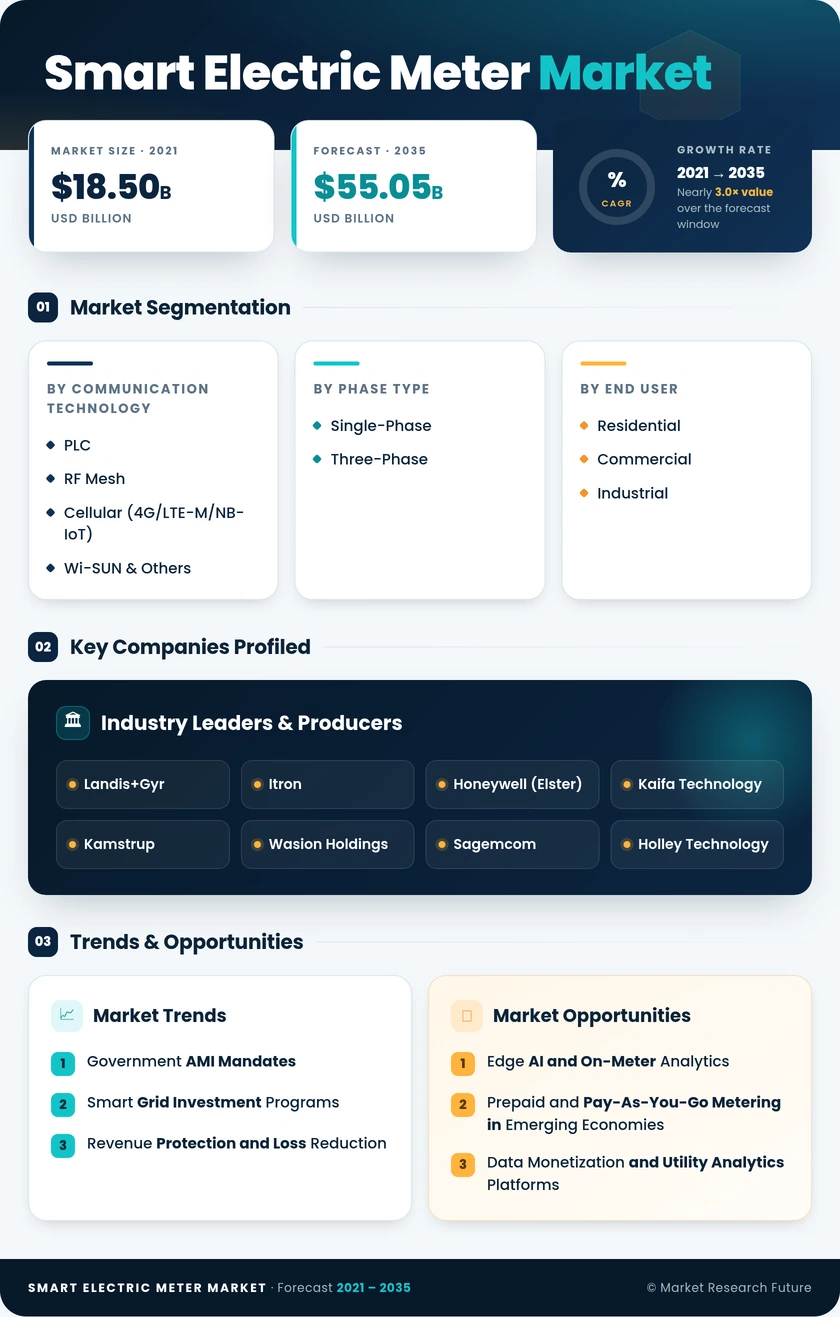
| Communication Smart Electric Meter Market | PLC, RF Mesh, Cellular (4G/LTE-M/NB-IoT), Wi-SUN & Others | PLC (~35% share) | RF Mesh (~9.6% CAGR) |
| Phase Type | Single-Phase, Three-Phase | Single-Phase (~62% share) | Three-Phase (~9.1% CAGR) |
| End User | Residential, Commercial, Industrial | Residential (~55% share) | Industrial (~9.4% CAGR) |
MARKET SEGMENTATION OVERVIEW
By Communication Smart Electric Meter Market
| Sub-Segment | Key Trend |
| PLC (Powerline Communication) | Dominant in Europe and China; zero incremental backhaul cost; suited for dense urban grids |
| RF Mesh | Self-healing mesh topology preferred across North American utilities; expanding into semi-rural territories |
| Cellular (4G / LTE-M / NB-IoT) | Fastest dollar growth; NB-IoT adoption surging in India and Australia; operator IoT tariffs declining |
| Wi-SUN & Others | Emerging standard for multi-utility smart-city interoperability; Japan and South Korea lead early adoption |
PLC and RF mesh together account for over 60% of the Smart Electric Meter Market communication layer, yet cellular-connected meters are closing the gap rapidly as mobile operators offer dedicated low-power wide-area network plans. PLC RF mesh smart meter communication deployments are increasingly converging in hybrid architectures that combine wired and wireless backhaul for urban–rural continuity.
By Phase Type
| Sub-Segment | Key Trend |
| Single-Phase | Volume leader driven by residential mass-market mandates; standard in household AMI programs globally |
| Three-Phase | Growing faster due to commercial and industrial demand visibility needs, essential for EV depot and DER monitoring |
Single-phase meters dominate global shipments, but the three-phase smart meter industrial segment commands higher average selling prices, supporting outsized revenue growth relative to unit share.
By End User
| Sub-Segment | Key Trend |
| Residential | Government mandate-driven; prepaid functionality expanding in emerging economies; the largest unit-volume segment |
| Commercial | ESG compliance and energy-cost optimization are accelerating adoption; ASHRAE benchmarking requirements are growing |
| Industrial | Highest per-unit value; power-quality and demand-response capabilities critical; CT-rated high-current meters |
Residential rollouts set the pace for AMI smart electricity meter rollout volumes, while commercial and industrial users generate higher per-connection revenue and increasingly require smart meter demand response integration for peak management and carbon accounting.