Smart Irrigation Market (2026 - 2035)

Smart Irrigation Market Size, Share and Research Report By Component (Controllers, Sensors, Water Flow Meters, Others), By System Type (Weather Based Controller Systems and Sensor Based Controller Systems), By Application (Agricultural {Green house, Open Field}, Non-Agricultural {Residential, Turf and Landscape, Golf Courses, Others}), By Region (North America, Asia Pacific, Europe, Rest of the World)) โ€“ Industry Forecast Till 2035
ID: MRFR/SEM/1889-CR
174 Pages
Ankit Gupta
Last Updated: July 22, 2026
Smart Irrigation Market
Market Size
Forecast Period2026-2035
CAGR (2026-2035)12.5%
2025 Market SizeUSD 1.78 Billion
2035 Market SizeUSD 5.78 Billion
Key Players
Rain Bird Corporation
Hunter Industries
Netafim
Lindsay Corporation
Galcon
Rachio
Opportunities
  • Emerging-Market Leapfrog via Mobile-First Platforms
  • Data Monetization and Irrigation-as-a-Service
  • Smart City Green Infrastructure Mandates

Smart Irrigation Market Summary

The Smart Irrigation Market was valued at USD 1.78 billion in 2025 and is projected to grow from USD 2.00 billion in 2026 to USD 5.78 billion by 2035, registering a CAGR of 12.5% during the forecast period (2026โ€“2035). Two catalysts are accelerating this trajectory: the U.S. EPA's expanded WaterSense program, which now covers commercial irrigation controllers, and the European Commission's revised Water Framework Directive requiring member states to cut agricultural water consumption by 15% before 2030 [1][2]. These policy mandates are converting what was once a voluntary efficiency upgrade into a compliance-driven investment cycle.

A technological shift is well underway across the Smart Irrigation Market. Legacy timer-based controllers โ€” still running on roughly 60% of irrigated commercial landscapes in North America โ€” are being replaced by sensor-driven, cloud-connected platforms that adjust watering schedules in real time based on soil conditions, evapotranspiration rates, and hyper-local weather feeds [3]. California's Department of Water Resources allocated USD 180 million in 2024 alone for agricultural water-efficiency retrofits, a figure that signals the scale of public capital flowing into this transition [4].

North America commands the largest share of the Smart Irrigation Market at approximately 35% of global revenue, driven by drought-prone western U.S. states and mature distribution channels. Asia-Pacific is the fastest-growing region with an estimated CAGR of 14.8%, propelled by India's Pradhan Mantri Krishi Sinchayee Yojana (PMKSY) micro-irrigation subsidies and China's digital agriculture push [5][6]. Europe holds the second-largest share at 27%, anchored by Mediterranean water-scarcity mandates. The decade ahead will reshape how water is managed across every irrigated surface on the planet.

ย 

Key Report Takeaways

โ€ข By System Type

  • Sensor-based irrigation systems held the dominant share of the Smart Irrigation Market in 2025, capturing approximately 48% of total revenue.
  • Weather-based controller systems are forecast to register a CAGR of 13.1% through 2035, driven by declining satellite data subscription costs.
  • Hybrid systems combining sensor and weather inputs accounted for an estimated USD 320 million in 2025.

โ€ข By Application

  • Agricultural applications represent the largest revenue pool in the Smart Irrigation Market, with roughly a 58% share.
  • Non-agricultural applications โ€” including commercial landscaping, golf courses, and municipal parks โ€” are growing at a CAGR of 13.4%.

โ€ข By Region

  • North America leads the Smart Irrigation Market with a 35% revenue share, underpinned by regulatory mandates in California, Arizona, and Colorado.
  • Asia-Pacific is projected to reach USD 1.62 billion by 2035.
  • The Middle East & Africa segment posts the second-highest regional CAGR at 13.9% due to acute freshwater scarcity.

ย 

Smart Irrigation Market Size and Forecast (2021โ€“2035)

Market sizing draws on a triangulated approach combining bottom-up revenue estimates from controller and sensor shipment data, top-down validation against regional water-infrastructure investment flows, and cross-referencing with publicly reported financials of leading vendors. Historical figures (2021โ€“2024) reflect actual market performance; 2025 is the estimated base year; and 2026โ€“2035 values are forecast projections assuming stable macroeconomic conditions and continued policy support.
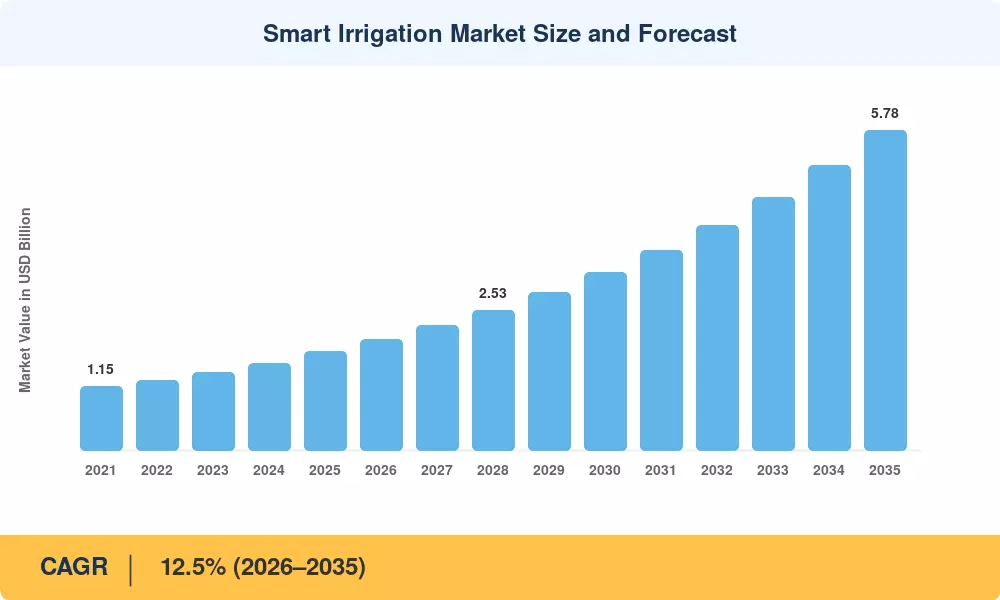
Smart Irrigation Market Size and Forecast
Our Impact
Enabled $4.3B Revenue Impact for Fortune 500 and Leading Multinationals
Partnering with 2000+ Global Organizations Each Year
30K+ Citations by Top-Tier Firms in the Industry

Driver Impact Analysis

Driver ~% Impact on CAGR Geographic Relevance Impact Timeline
Freshwater scarcity and drought regulation +2.8% Global Long-term (โ‰ฅ4 yr)
Government subsidy programs for micro-irrigation +2.2% Asia-Pacific, North America Medium-term (2โ€“4 yr)
IoT and cloud platform cost reduction +2.0% Global Short-term (โ‰ค2 yr)
Precision agriculture expansion +1.8% North America, Europe Medium-term (2โ€“4 yr)
Municipal water-pricing reform (tiered tariffs) +1.5% Middle East & Africa, Europe Long-term (โ‰ฅ4 yr)
Smart city and green building mandates +1.2% North America, Europe Medium-term (2โ€“4 yr)
AI-driven predictive analytics adoption +1.0% North America, Asia-Pacific Long-term (โ‰ฅ4 yr)

ย 

Freshwater Scarcity and Drought Regulation

According to the UN World Water Development Report 2024, over 2.3 billion people worldwide suffer from water stress, and almost 70% of freshwater withdrawals are used for agricultural irrigation [1]. Regulations are becoming more stringent: Arizona's Groundwater Management Act amendments and California's Senate Bill 1383 set metered allocation restrictions on commercial irrigators, creating a compliance floor that essentially requires controller upgrades. Legacy timer-based installations are essentially shut out of the reclaimed-water supply chain by the European Commission's 2024 Water Reuse Regulation, which only permits treated wastewater in agriculture when combined with authorized sensor-monitored distribution systems [2].

ย 

Government Subsidy Programs

Since 2015, India's PMKSY program has disbursed more than USD 3.5 billion for micro-irrigation infrastructure, with Phase III (2024โ€“2029) designating funds exclusively for 10 million hectares of IoT-enabled drip and sprinkler systems [5]. Over USD 420 million in irrigation-related claims were received in fiscal year 2024 under USDA's Environmental Quality Incentives Program (EQIP), which reimburses qualifying farms up to 75% of the cost of smart irrigation controllers [14]. The adoption hurdle is destroyed by these subsidized pipelines, which cut payback timeframes for many producers from five years to less than two years.

ย 

IoT and Cloud Platform Cost Reduction

The average cost of a commercial-grade soil moisture sensor dropped from USD 185 in 2019 to approximately USD 68 in 2025, a 63% decline driven by MEMS fabrication scaling and competitive pressure from Chinese manufacturers [9]. Simultaneously, cloud computing costs for real-time data ingestion fell by roughly 40% over the same period. This dual cost compression makes connected irrigation economically viable for mid-tier commercial landscapers and smallholder farms that were previously priced out of the Smart Irrigation Market.

Precision Agriculture Expansion

The global precision agriculture sector surpassed USD 12 billion in 2024, and smart irrigation sits at its operational core. Variable-rate irrigation (VRI) systems โ€” which adjust water delivery zone by zone based on crop canopy imagery and soil conductivity maps โ€” are moving from pilot-stage deployments on large commodity farms to standard practice across specialty crop operations. The USDA's Agricultural Research Service documented yield improvements of 12โ€“18% and water savings of 25โ€“35% on VRI-equipped fields in the Central Valley, numbers compelling enough to drive rapid fleet-wide upgrades [15].

ย 

Restraints Impact Analysis

Restraint ~% Impact on CAGR Geographic Relevance Impact Timeline
High upfront installation and integration costs โ€“1.5% Global Short-term (โ‰ค2 yr)
Fragmented connectivity infrastructure in rural areas โ€“1.2% Asia-Pacific, Africa Medium-term (2โ€“4 yr)
Lack of trained personnel for system maintenance โ€“0.8% South America, MEA Long-term (โ‰ฅ4 yr)
Data privacy and cybersecurity concerns โ€“0.6% North America, Europe Medium-term (2โ€“4 yr)
Low awareness among smallholder farmers โ€“0.5% Asia-Pacific, Africa Long-term (โ‰ฅ4 yr)

ย 

High Upfront Installation Costs

Including controllers, soil sensors, flow meters, gateway hardware, and expert installation, a fully integrated smart irrigation system for a 500-acre farm can cost between USD 45,000 and USD 75,000 [16]. The overall deployment costs for commercial landscaping companies that oversee several locations frequently surpass USD 120,000. The initial capital expenditure delays uptake among price-sensitive purchasers and creates a financing gap that leasing models have only partially addressed, even though operating savings eventually cover these outlays, especially in regions without subsidy programs.

ย 

Fragmented Rural Connectivity

Reliable cellular or LPWAN (Low Power Wide Area Network) coverage is essential for sensor-based and cloud-connected irrigation solutions; yet, almost 40% of farmland in Sub-Saharan Africa and 25% in South and Southeast Asia still do not have consistent network connection [17]. Although satellite-based IoT is becoming more popular as a workaround, real-time control loops are still too expensive due to latency and subscription fees. The addressable market in these high-growth agricultural regions is artificially confined until connectivity gaps close, such as through projects like India's BharatNet fiber scheme or the spread of LoRaWAN gateways.

ย 

Workforce Skill Gaps

Operating a modern connected irrigation system requires agronomic knowledge, basic data literacy, and comfort with cloud dashboards โ€” a skill combination that is scarce outside well-resourced farm operations [18]. In Latin America, fewer than 15% of irrigation equipment dealers currently offer post-sale technical support for smart controllers. This gap creates a vicious cycle: systems underperform due to poor calibration, which erodes word-of-mouth credibility and delays the next wave of purchases.

ย 

Smart Irrigation Market Opportunities

Emerging-Market Leapfrog via Mobile-First Platforms

Many smallholder farmers in India, Kenya, and Vietnam access the internet exclusively through smartphones. Irrigation vendors that build SMS- and app-based controller interfaces โ€” requiring no desktop or browser โ€” can unlock a market of over 450 million smallholder farms globally [20]. Companies like Jain Irrigation and CropX have already piloted lightweight mobile dashboards that pair with low-cost valve actuators, demonstrating 20% water savings at a system cost under USD 200 per hectare.

Data Monetization and Irrigation-as-a-Service

The data generated by connected irrigation networks โ€” soil health trends, microclimate patterns, water-use benchmarks โ€” has value far beyond on-farm optimization. Aggregated and anonymized, this data is purchased by crop insurers, commodity traders, and government drought-monitoring agencies. An Irrigation-as-a-Service (IaaS) model that bundles hardware, cloud analytics, and agronomic advisory for a monthly subscription fee reduces the upfront cost barrier while creating recurring revenue for vendors.

Smart City Green Infrastructure Mandates

Cities including Singapore, Dubai, and Los Angeles have enacted green building codes that require connected irrigation for commercial landscapes exceeding specified thresholds [12]. Singapore's Building and Construction Authority mandates smart landscape management for all new developments above 5,000 square meters. This regulatory pull creates a reliable, non-agricultural demand stream for the Smart Irrigation Market and diversifies revenue away from weather-dependent farming cycles.

AI-Driven Predictive Irrigation Scheduling

Machine learning models trained on satellite imagery, weather forecasts, and historical sensor data can predict crop water demand 72โ€“96 hours in advance, enabling pre-emptive rather than reactive irrigation adjustments [13]. Early adopters in California's almond orchards reported 30% reductions in over-irrigation events. As edge computing chips become powerful enough to run inference locally on field controllers, latency and connectivity constraints diminish, opening the Smart Irrigation Market to regions with poor network coverage.

Integration with Carbon and Water Credit Markets

Verified water savings from smart irrigation deployments are increasingly eligible for tradeable water stewardship credits under frameworks like the Alliance for Water Stewardship (AWS) Standard [21]. In California, quantified groundwater recharge from reduced agricultural runoff has begun generating Sustainable Groundwater Management Act (SGMA) compliance credits. This financial mechanism adds a secondary revenue stream that improves ROI calculations and accelerates adoption among large agribusiness operators.

ย 

Smart Irrigation Market Future Outlook

AI-Autonomous Irrigation Networks

By 2030, irrigation systems that require zero human input for day-to-day scheduling decisions will move from pilot to mainstream deployment. These autonomous networks fuse satellite spectral imagery, ground-sensor telemetry, and probabilistic weather models through reinforcement-learning algorithms that continuously optimize water delivery [13]. The IEA's World Energy Outlook 2024 projects that agricultural energy demand โ€” of which irrigation pumping is a major component โ€” will need to decline 20% by 2035 to meet net-zero targets, and autonomous water management is the most scalable pathway to achieve that reduction [25].

Platform Economics and Ecosystem Consolidation

The Smart Irrigation Market is shifting from a hardware-sales model to a platform-economics model. Vendors like Rain Bird and Toro are building open-API cloud platforms that integrate third-party sensors, weather services, and agronomic advisory modules. This platform approach generates subscription revenue, raises switching costs, and positions incumbents as ecosystem orchestrators rather than component suppliers. By 2028, recurring software and data-service revenue is expected to account for 25โ€“30% of leading vendors' irrigation-segment income [26].

Sustainability Reporting and ESG Compliance

The EU Corporate Sustainability Reporting Directive (CSRD), effective 2025, requires large companies to disclose water-use metrics across their supply chains [22]. For food and beverage conglomerates, this means tracking irrigation efficiency at the farm level โ€” a task practically impossible without connected sensor infrastructure. As CSRD-equivalent regulations emerge in the U.S. (SEC climate disclosure rules) and Asia (Singapore's SGX sustainability requirements), the Smart Irrigation Market gains a powerful demand driver that operates independently of commodity prices or weather cycles.

Electrification and Solar-Powered Irrigation

Solar-powered irrigation pumps paired with smart controllers are unlocking off-grid agricultural regions across Sub-Saharan Africa and South Asia. The World Bank's Solar Irrigation for Agricultural Resilience (SoLAR) program has financed over 200,000 solar pump installations since 2022, and each installation creates a logical entry point for connected water management [20]. As battery storage costs continue to fall โ€” BloombergNEF projects a further 40% decline by 2030 โ€” the economics of self-sufficient, solar-plus-smart-irrigation systems become compelling even for marginal farmland [27].

ย 

Smart Irrigation Market Segmentation

By System Type

Segment Key Metric Primary Demand Driver
Sensor-Based Systems 48% share (2025) Soil-specific precision and ROI visibility
Weather-Based Systems CAGR 13.1% Satellite data cost reductions
Hybrid Systems USD 0.32 B (2025) Enterprise-grade accuracy requirements

ย 

Sensor-based systems dominate the Smart Irrigation Market because they deliver site-specific data that weather-based alternatives cannot match. Capacitance and tensiometer probes embedded in root zones provide direct measurements of plant-available water, enabling irrigation decisions grounded in actual soil conditions rather than modeled estimates. This precision is especially valued in high-value crop operations โ€” vineyards, orchards, and greenhouse cultivation โ€” where overwatering degrades product quality and underwatering destroys yield.

Weather-based systems, however, are gaining ground thanks to plummeting costs for evapotranspiration (ET) data feeds. The National Weather Service's expanded FRET (Forecast Reference Evapotranspiration) dataset now covers granular grid cells as small as 4 kmยฒ, giving weather-based controllers accuracy that was unthinkable five years ago [3]. For large turf operations like golf courses and municipal parks, where soil heterogeneity is lower, weather-based controllers offer a compelling cost-per-acre advantage.

By Application

Segment Key Metric Primary Demand Driver
Agricultural 58% share (2025) Food security mandates and subsidy programs
Non-Agricultural CAGR 13.4% Smart city codes and commercial landscaping standards

ย 

Agricultural applications anchor the Smart Irrigation Market, spanning row crops, orchards, vineyards, and greenhouse operations. The scale of addressable farmland โ€” over 340 million hectares of irrigated cropland globally according to FAO data โ€” creates an enormous runway for penetration growth [28]. Non-agricultural applications are growing faster in percentage terms, driven by golf course operators facing membership pressure to demonstrate sustainability and by commercial property managers subject to green building certification requirements like LEED v4.1 water-efficiency credits [12].

By Component

Segment Key Metric Primary Demand Driver
Controllers 36% share (2025) Regulatory mandates requiring smart controllers
Sensors CAGR 14.2% Falling hardware costs and miniaturization
Water Flow Meters USD 0.18 B (2025) Leak detection and compliance metering
Software & Platforms CAGR 15.8% Subscription revenue models and analytics demand

ย 

Controllers remain the largest component category in the Smart Irrigation Market because they represent the central decision-making unit in any irrigation system. Regulatory mandates โ€” like California's MWELO and the EU's water-reuse requirements โ€” specifically name controllers as the compliance mechanism, guaranteeing baseline demand. The software and platforms segment is growing fastest as vendors pivot toward recurring-revenue models, offering cloud dashboards, mobile apps, and API-based integrations that turn one-time hardware sales into ongoing service relationships.

ย 

Regional Market Share Analysis

Region Key Metric Primary Investment Themes
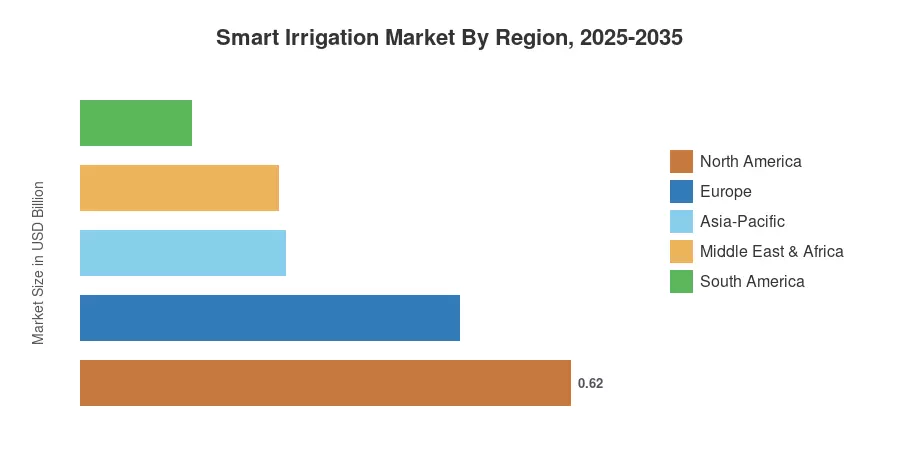
North America 35% share (2025) Drought regulation, precision agriculture, smart city mandates
Europe 27% share (2025) Water Framework Directive, CAP greening subsidies
Asia-Pacific CAGR 14.8% Government micro-irrigation subsidies, digital farming
South America USD 0.14 B (2025) Export-crop irrigation modernization
Middle East & Africa CAGR 13.9% Desalination-fed irrigation, food security programs
Total USD 1.78 B (2025) โ€”

The Smart Irrigation Market exhibits distinct regional dynamics shaped by water-scarcity severity, agricultural intensity, regulatory maturity, and connectivity infrastructure. North America and Europe together account for over 60% of global revenue, but Asia-Pacific and the Middle East & Africa are narrowing the gap rapidly.

ย 

North America

Country Key Metric Key Driver
United States 82% of regional share State-level drought mandates (CA, AZ, CO)
Canada CAGR 11.8% Municipal landscaping codes, turf management
Mexico USD 0.03 B (2025) Export agriculture water-efficiency requirements

ย 

The United States drives the North American Smart Irrigation Market through a combination of stringent water-use regulations and a well-established distribution network. California's Model Water Efficient Landscape Ordinance (MWELO) requires weather-based or sensor-based irrigation controllers for all new commercial developments, and similar ordinances are spreading to Arizona, Colorado, and Texas [4]. The USDA's EQIP program continues to funnel federal dollars into on-farm upgrades, while the residential segment benefits from EPA WaterSense rebate partnerships with over 1,800 utilities nationwide [1].

Europe

Country Key Metric Key Driver
Spain 28% of regional share Mediterranean drought and CAP reform
Italy CAGR 13.2% Precision viticulture and orchard irrigation
France USD 0.08 B (2025) AgriTech startup ecosystem
Germany CAGR 11.5% Smart landscaping for commercial properties

ย 

European growth in the Smart Irrigation Market is tightly coupled with the Common Agricultural Policy (CAP) 2023โ€“2027 reform, which conditions direct payments on demonstrable water-efficiency measures [2]. Spain, facing chronic water deficits in Andalusia and Murcia, leads adoption. Italy's precision viticulture sector โ€” where water stress management directly influences wine quality and pricing โ€” is emerging as a high-value niche. EU Horizon Europe grants worth EUR 95 million have been earmarked for digital water management research through 2027 [22].

Asia-Pacific

Country Key Metric Key Driver
India 38% of regional share PMKSY subsidies, smallholder adoption
China CAGR 15.2% Digital agriculture modernization plans
Australia USD 0.09 B (2025) Murray-Darling Basin water-trading framework
Japan CAGR 10.8% Aging farmer automation, rice-paddy management

ย 

Asia-Pacific represents the most dynamic growth frontier for the Smart Irrigation Market. India's PMKSY program is the single largest government irrigation subsidy globally, targeting 10 million hectares of micro-irrigation coverage by 2029 [5]. China's Ministry of Agriculture has embedded smart irrigation in its 14th Five-Year Plan for agricultural modernization, with pilot projects covering 3 million hectares in Xinjiang and Henan provinces [6]. Australia's water-trading market creates price signals that strongly incentivize technology-driven efficiency on dryland farms.

South America

Country Key Metric Key Driver
Brazil 65% of regional share Soybean and sugarcane export irrigation
Argentina CAGR 12.8% Pampas grain-belt modernization
Chile USD 0.01 B (2025) Avocado and grape precision irrigation

ย 

Brazil's position as the world's largest soybean exporter creates natural demand for irrigation optimization on its expanding cerrado farmland. Embrapa, Brazil's agricultural research agency, has partnered with Israeli irrigation technology providers to deploy sensor networks across 500,000 hectares of pilot farmland, generating field-level efficiency data that is expected to catalyze broader commercial adoption across the Smart Irrigation Market in the region [23].

Middle East & Africa

Country Key Metric Key Driver
Saudi Arabia 34% of regional share NEOM and Vision 2030 food security
UAE CAGR 14.5% Controlled-environment agriculture mandates
South Africa USD 0.02 B (2025) Commercial farming drought adaptation
Kenya CAGR 15.1% Smallholder mobile-first irrigation platforms

ย 

The Middle East & Africa segment of the Smart Irrigation Market benefits from an acute water-scarcity imperative. Saudi Arabia's Vision 2030 program has allocated over USD 2 billion for agricultural technology, with smart irrigation identified as a priority vertical within the kingdom's food-security strategy [24]. In East Africa, organizations like the World Bank and AGRA are co-funding connected irrigation pilots that pair solar-powered pumps with SMS-based soil monitoring โ€” a model designed specifically for off-grid smallholder contexts [20].

ย 

Smart Irrigation Market By Region, 2025-2035

Competitive Benchmarking

The Smart Irrigation Market is moderately concentrated, with an estimated Herfindahl-Hirschman Index (HHI) below 1,500 and the top five players collectively holding approximately 40โ€“45% of global revenue. The competitive field spans large diversified irrigation corporations, specialized smart-technology startups, and agricultural conglomerates entering through acquisition. Differentiation increasingly hinges on software capabilities and ecosystem breadth rather than hardware specifications alone.

Company Est. Revenue Share Range Key Offerings for Smart Irrigation Market Strategic Positioning
Rain Bird Corporation ~8โ€“11% ESP-TM2 controllers, IQ4 central control platform Full-stack residential and commercial solutions
The Toro Company / Irritrol ~7โ€“10% Evolution series controllers, Lynx central control Integrated turf and landscape management
Hunter Industries ~7โ€“9% HC Hydrawise controllers, soil-clik sensors Cloud-native residential and light commercial
Netafim (Orbia) ~6โ€“8% NetBeat digital farming platform, precision drip Global precision agriculture leadership
Lindsay Corporation ~4โ€“6% FieldNET Advisor, Zimmatic pivot controls Large-scale pivot and lateral irrigation
Galcon ~2โ€“4% GSi controllers, FertiGal integration Greenhouse and fertigation automation
Rachio ~2โ€“3% Rachio 3 smart sprinkler controller Direct-to-consumer residential smart home
HydroPoint Data Systems ~2โ€“3% WeatherTRAK controllers, baseline management Commercial landscape water management
CropX Technologies ~1โ€“3% Soil sensing platform, agronomic analytics Data-driven farm advisory services
Weathermatic ~1โ€“2% SmartLink controllers, SL series Commercial landscape, municipal parks

ย 

ย 

Recent News & Developments

  • Rain Bird Corporation (March 2025): Launched the IQ4 cloud-based central control platform with open API support for third-party sensor integration, targeting commercial landscape operators managing 50+ sites [26].
  • Netafim (January 2025): Announced a strategic partnership with a major satellite imagery provider to integrate crop-canopy analytics into its NetBeat platform, enabling prescription-based irrigation scheduling for row-crop farmers.
  • The Toro Company (October 2024): Acquired a soil-sensing startup to strengthen its Lynx central control ecosystem, adding real-time root-zone moisture monitoring across turf and agricultural applications [26].
  • Rachio (August 2024): Released Rachio 3 firmware update incorporating predictive scheduling powered by NOAA hourly forecast data, reducing average residential water use by an estimated 15% compared to fixed schedules [3].
  • U.S. EPA (June 2024): Expanded the WaterSense certification program to cover commercial irrigation controllers for the first time, establishing minimum water-efficiency performance criteria for products sold in the U.S. market [1].
  • Indian Ministry of Agriculture (April 2024): Disbursed USD 620 million under PMKSY Phase III for IoT-enabled micro-irrigation systems, representing the largest single-year allocation in the program's history [5].

ย 

  • Hunter Industries (November 2023): Introduced the HC Pro commercial controller with built-in cellular connectivity and multi-site remote management via the Hydrawise cloud platform [26].

ย 

Smart Irrigation Market Report Scope

Parameter Detail
Market Scope Global Smart Irrigation Market covering controllers, sensors, flow meters, software, and services
Study Period 2021โ€“2035
Historical Period 2021โ€“2024
Base Year 2025
Forecast Period 2026โ€“2035
CAGR 12.5% (2026โ€“2035)
Market Size (2025) USD 1.78 Billion
Market Size (2035) USD 5.78 Billion
Fastest Growing Segment Software & Platforms (CAGR 15.8%)
Fastest Growing Region Asia-Pacific (CAGR 14.8%)
Companies Profiled 10
Valuation Currency USD (constant 2025 dollars)

ย 

ย 

FAQs

What procurement criteria should buyers prioritize when selecting smart irrigation controllers?
Prioritize open API interoperability, SWAT-tested performance ratings from the Irrigation Association, and cybersecurity certifications like SOC 2 [16]. Budget 15โ€“20% above hardware cost for professional installation and staff training.
How does ROI differ between residential and commercial Smart Irrigation Market deployments?
Commercial deployments typically recover costs within 18โ€“24 months due to larger water savings volumes. Residential systems take 3โ€“5 years but benefit from utility rebate programs that offset 20โ€“30% of upfront costs [1].
What cybersecurity risks affect cloud-connected irrigation controllers?
Cloud-connected controllers face risks from unsecured APIs, weak device authentication, and unencrypted data transmission [19]. Buyers should require TLS 1.3 encryption and vendor SOC 2 compliance before procurement.
How do municipal water-pricing structures influence Smart Irrigation Market adoption?
Tiered and increasing-block water tariffs create stronger financial incentives for smart irrigation adoption. Regions with flat-rate pricing see 40โ€“50% slower uptake because water savings produce minimal bill reductions [11].
What role do insurance incentives play in Smart Irrigation Market purchasing decisions?
Some property insurers offer 5โ€“10% premium discounts for commercial properties using verified smart irrigation systems [16]. This trend is expanding as insurers quantify reduced water-damage claim frequency.
How should facility managers compare sensor-based versus weather-based systems?
Sensor-based systems deliver superior accuracy for heterogeneous soil profiles and microclimates. Weather-based systems suit large uniform landscapes at lower per-acre cost [3].
What emerging interoperability standards govern the Smart Irrigation Market?
The Irrigation Association's SWAT protocol and EPA WaterSense certification set baseline efficiency and interoperability standards [1]. Open-source protocols like MQTT are gaining traction for multi-vendor device-to-cloud communication. ย  ย 
Author
Author
Author Profile
Ankit Gupta LinkedIn
Team Lead - Research
Ankit Gupta is a seasoned market intelligence and strategic research professional with over six plus years of experience in the ICT and Semiconductor industries. With academic roots in Telecom, Marketing, and Electronics, he blends technical insight with business strategy. Ankit has led 200+ projects, including work for Fortune 500 clients like Microsoft and Rio Tinto, covering market sizing, tech forecasting, and go-to-market strategies. Known for bridging engineering and enterprise decision-making, his insights support growth, innovation, and investment planning across diverse technology markets.

Research Approach

ย 

Secondary Research

The secondary research process involved comprehensive analysis of regulatory databases, agricultural technology publications, peer-reviewed journals, irrigation industry reports, and authoritative agricultural and environmental organizations. Key sources included the United States Department of Agriculture (USDA), Environmental Protection Agency (EPA) WaterSense Program, Food and Agriculture Organization (FAO) of the United Nations, International Commission on Irrigation and Drainage (ICID), Irrigation Association (IA), European Environment Agency (EEA), European Commission Agriculture and Rural Development, Bureau of Indian Standards (BIS) Agricultural Division, National Institute of Hydrology (India), China Ministry of Water Resources, Israeli Ministry of Agriculture and Rural Development, USDA National Agricultural Statistics Service (NASS), United States Geological Survey (USGS) Water Resources, World Bank Climate Change Knowledge Portal, International Water Management Institute (IWMI), and national agricultural ministry reports from key markets. These sources were used to collect irrigation statistics, technology adoption rates, water usage data, regulatory compliance requirements, and precision agriculture trends for weather-based systems, sensor-based controllers, soil moisture sensors, and smart flow meter technologies.

ย 

Primary Research

Qualitative and quantitative insights were obtained by interviewing supply-side and demand-side stakeholders during the primary research process. CEOs, VPs of Product Development, Chief Technology Officers, and directors of Agricultural Solutions from smart irrigation equipment manufacturers, precision agriculture technology providers, and IoT sensor OEMs are among the supply-side sources. The demand-side sources included procurement leads from agricultural enterprises, municipal water authorities, and commercial turf management companies, as well as large-scale farm operators, agricultural cooperative managers, golf course superintendents, commercial landscaping directors, and greenhouse facility managers. The primary research validated market segmentation across controller technologies and sensor systems, confirmed product development pipelines, and garnered insights on adoption barriers, pricing dynamics, water policy impacts, and integration challenges with existing irrigation infrastructure.

Primary Respondent Breakdown:

By Designation: C-level Primaries (28%), Director Level (35%), Others (37%)

By Region: North America (32%), Europe (30%), Asia-Pacific (33%), Rest of World (5%)

ย 

Market Size Estimation

Global market valuation was derived through revenue mapping and installation volume analysis across agricultural and non-agricultural segments. The methodology included:

Identification of 50+ key manufacturers and technology providers across North America, Europe, Asia-Pacific, Middle East, and Latin America

Product mapping across weather-based controllers, sensor-based controllers, soil moisture sensors, rain/freeze sensors, smart water flow meters, and integrated IoT irrigation platforms

Analysis of reported and modeled annual revenues specific to smart irrigation product portfolios

Coverage of manufacturers representing 75-80% of global market share in 2024

Extrapolation using bottom-up (installation volume ร— ASP by application and region) and top-down (manufacturer revenue validation) approaches to derive segment-specific valuations for greenhouse automation, open-field precision agriculture, residential smart home integration, and commercial turf management sectors

Download Free Sample

Kindly complete the form below to receive a free sample of this Report

Download PDF ×

We do not share your information with anyone. However, we may send you emails based on your report interest from time to time. You may contact us at any time to opt-out.
















