Smart Transportation Market (2026 - 2035)

Smart Transportation Market Size, Share and Research Report By Application (Traffic Management, Road Safety and Security, Parking Management, Passenger Information Management, Freight Management), By Product Type (Advanced Transportation Management Systems (ATMS), Advanced Traveler Information Systems (ATIS), Cooperative Vehicle Systems, Electronic Fare Collection), By Service (Cloud Services, Professional Services, Deployment and Integration), By Transportation Mode (Roadways, Railways, Airways, Waterways), By Connectivity Technology (Cellular / C-V2X, 5G and LTE-M, DSRC, LPWAN / Other) and By Regional (North America, Europe, South America, Asia Pacific, Middle East and Africa) - Industry Forecast to 2035.
ID: MRFR/SEM/1834-CR
132 Pages
Nirmit Biswas, Aarti Dhapte
Last Updated: July 10, 2026
Smart Transportation Market
Market Size
Forecast Period2026-2035
CAGR (2026-2035)13.10%
2025 Market SizeUSD 134.50 Billion
2026 Market SizeUSD 153.50 Billion
2035 Market SizeUSD 464.70 Billion
Key Players
Siemens Mobility
IBM Corporation
Cisco Systems
Thales Group
Cubic Transportation Systems
Kapsch TrafficCom
Opportunities
  • Mobility-as-a-Service Platform Expansion
  • Freight Corridor Intelligence in Emerging Markets
  • Data Monetization and Anonymized Traffic Analytics

Smart Transportation Market Summary

The Smart Transportation Market reached an estimated USD 134.50 billion in 2025 and is projected to grow from USD 153.50 billion in 2026 to USD 464.70 billion by 2035, registering a CAGR of 13.10% across the forecast window. This expansion is anchored in aggressive public-sector capital commitments — the United States alone approved more than USD 4.5 billion for next-generation mobility projects in late 2024, while the European Union's Sustainable and Smart Mobility Strategy is channeling billions into zero-emission corridors and open-data mandates across all transport modes [1][2]. These policy catalysts are converting pilot-stage technology into system-wide deployments at an unprecedented pace.

Legacy traffic control hardware — loop detectors, fixed-timing signals, and siloed fare-collection platforms — is giving way to cloud-native analytics, 5G-enabled vehicle connectivity, and digital-twin modeling that can simulate entire metropolitan corridors before a single sensor is installed. The Smart Transportation Market is absorbing this technology shift as cities discover that data-centric traffic systems deliver measurably more capacity without additional lane construction [3]. Cooperative vehicle systems and AI-driven signal optimization are moving from research papers to production intersections.

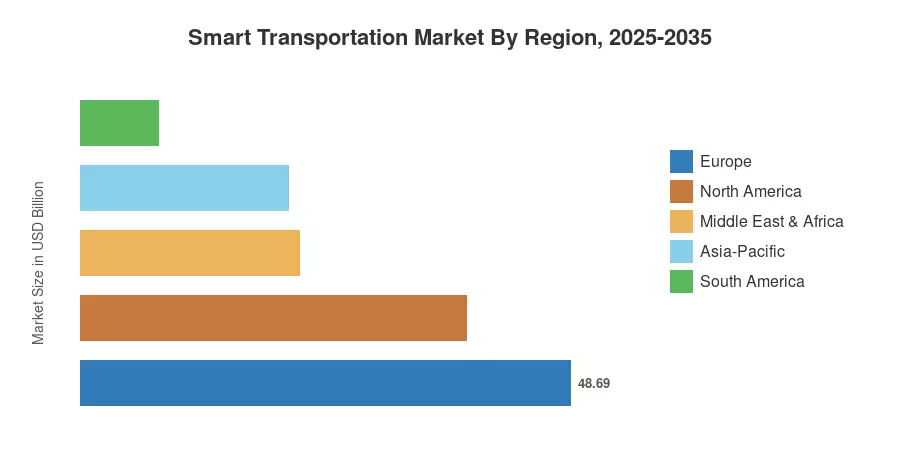
Europe commands approximately 36.20% of the Smart Transportation Market, backed by regulatory harmonization and a continent-wide C-ITS deployment roadmap. Asia-Pacific is the fastest-growing region, propelled by megacity-scale intelligent highway and connected vehicle infrastructure programs in China, India, and Southeast Asia. North America holds the second-largest share at roughly 28.50%, driven by federal grant cycles and private-sector autonomy pilots. Over the coming decade, convergence of electrification, autonomy, and platform economics will redefine how people and freight move through urban and intercity networks.


Key Report Takeaways

• By Application & Product Type

  • Traffic management accounted for an estimated 34.50% of the Smart Transportation Market in 2025, underpinned by municipal demand for adaptive signal control and real-time congestion analytics.
  • Advanced transportation management systems (ATMS) commanded roughly 28.90% of the Smart Transportation Market in 2025, reflecting widespread replacement of legacy fixed-timing infrastructure.
  • Cooperative vehicle systems are expanding at a 18.10% CAGR through 2035 as V2X mandates gain traction across North America and Europe.

• By Service & Connectivity

  • Cloud services captured approximately 44.20% share in 2025, driven by municipal preference for scalable, subscription-based traffic platforms.
  • Cellular and C-V2X connectivity technology held around 54.50% of the Smart Transportation Market in 2025.

• By Region

  • Europe led the Smart Transportation Market with 36.20% revenue share in 2025, anchored in EU regulatory mandates.
  • Asia-Pacific is the fastest-growing region, forecast to expand at a 15.40% CAGR through 2035.


Market Size and Forecast (2021–2035)

Market Research Future's sizing model integrates primary interviews with transport-agency procurement officers, OEM revenue disclosures, government budget allocations, and bottom-up technology-adoption curves validated against secondary databases. Historical figures (2021–2024) are actuals; 2025 is the calibrated base year; and 2026–2035 projections apply a constant 13.10% CAGR adjusted for anticipated policy and technology inflections.
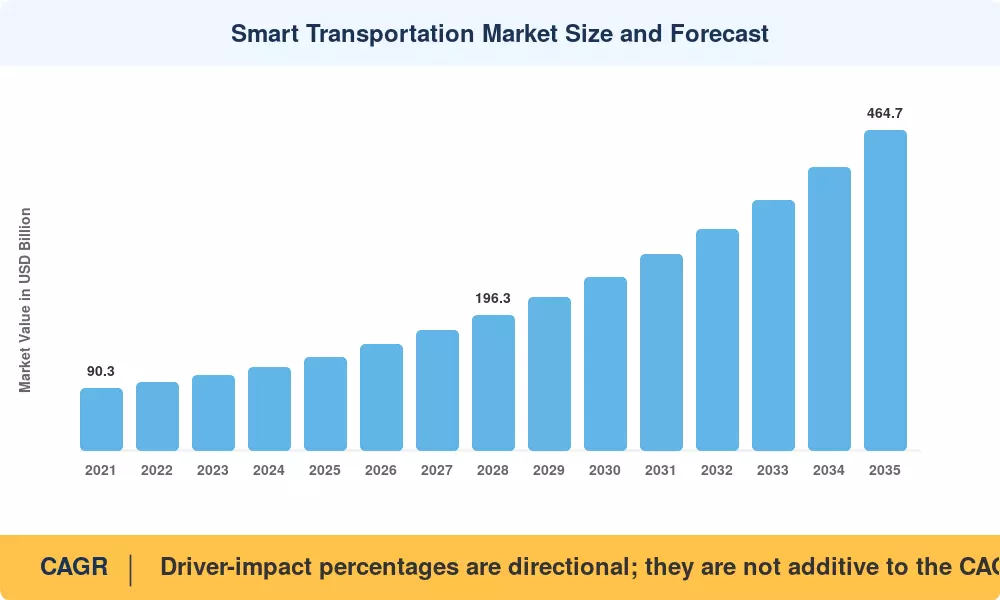
Smart Transportation Market Size and Forecast
Our Impact
Enabled $4.3B Revenue Impact for Fortune 500 and Leading Multinationals
Partnering with 2000+ Global Organizations Each Year
30K+ Citations by Top-Tier Firms in the Industry

Driver Impact Analysis

Driver ~% Impact on CAGR Geographic Relevance Impact Timeline
Government smart-city funding mandates +2.8% Global Short-term (≤2 yr)
5G and C-V2X network deployment +2.5% North America, Asia-Pacific Medium-term (2–4 yr)
Urbanization-driven congestion pressure +2.2% Asia-Pacific, South America Long-term (≥4 yr)
AI-powered adaptive signal optimization +1.9% Europe, North America Medium-term (2–4 yr)
Electrification of public transit fleets +1.5% Europe, China Long-term (≥4 yr)
Freight digitization and corridor intelligence +1.2% North America, Europe Medium-term (2–4 yr)
Data monetization from transport platforms +0.9% Global Long-term (≥4 yr)


Government Smart-City Funding Mandates

Federal and supranational grant programs are the single largest near-term accelerant for the Smart Transportation Market. The US Bipartisan Infrastructure Law allocated over USD 7.5 billion specifically for intelligent-transportation-system upgrades between 2022 and 2026, while India's Smart Cities Mission has disbursed more than USD 6 billion across 100 cities for integrated traffic management and public-transit modernization [1][6]. These capital injections compress procurement timelines and lower the effective payback period for municipalities.

5G and C-V2X Network Deployment

Low-latency 5G networks transform vehicle-to-everything communication from a concept into a production-grade capability. China's Ministry of Industry and Information Technology targeted 3.5 million 5G-connected roadside units by 2025, while the US FCC reallocated the 5.9 GHz band to support C-V2X alongside DSRC [8]. This dual-standard environment is creating equipment demand across the chipset, module, and infrastructure layers within the Smart Transportation Market.

Urbanization-Driven Congestion Pressure

The World Bank estimates that traffic congestion costs urban economies 2–5% of GDP annually, a figure that rises with every percentage-point increase in urbanization [2]. Cities exceeding 10 million residents — projected to number 43 globally by 2030 — face capacity constraints that cannot be solved by road-building alone. Demand for real-time analytics, dynamic tolling, and multimodal journey planning is a structural growth driver for the Smart Transportation Market throughout the forecast period.

AI-Powered Adaptive Signal Optimization

Machine-learning algorithms trained on intersection-level data can reduce corridor travel times by 15–25%, according to field trials in Pittsburgh and Manchester [9]. Municipal adoption is accelerating because these systems deliver measurable ROI within 18 months of deployment, making them politically viable projects for city transportation departments.


Restraints Impact Analysis

Restraint ~% Impact on CAGR Geographic Relevance Impact Timeline
High upfront infrastructure investment costs –1.8% Global Short-term (≤2 yr)
Cybersecurity and data-privacy risks –1.4% North America, Europe Medium-term (2–4 yr)
Interoperability gaps across legacy systems –1.1% Europe, Asia-Pacific Long-term (≥4 yr)
Skilled-workforce shortages for ITS integration –0.8% Global Medium-term (2–4 yr)
Regulatory fragmentation across jurisdictions –0.6% Asia-Pacific, South America Long-term (≥4 yr)


High Upfront Infrastructure Investment Costs

The cost of deploying a citywide adaptive traffic management system is estimated to be between USD 30–80 million, depending on the number of intersections and sensor density, which is beyond the budget of municipalities outside of major urban centers [13]. Smaller towns and municipalities in emerging economies are typically unable to self-finance due to a lack of bonding capacity or tax base, limiting the adoption of the Smart Transportation Market’s most significant solutions until grant funding or PPP arrangements become available.


Cybersecurity and Data-Privacy Risks

Transportation control systems are prime targets for ransomware and cyberattacks sponsored by nation-states. The 2023 ransomware attack on the Dallas Area Rapid Transit network demonstrated how a single compromise may disable fare collecting and passenger information systems for weeks [14]. Compulsory requirements from the EU’s NIS2 Directive and the US TSA cybersecurity directives also bring compliance expenses that can be as high as 8-12% of total project budgets.


Interoperability Gaps Across Legacy Systems

Many cities operate traffic-signal controllers from three or more vendors with incompatible communication protocols. Bridging these systems requires middleware layers and custom API development, adding 12–18 months to deployment schedules and inflating integration costs by 20–30% [15]. This friction is a persistent drag on the Smart Transportation Market, particularly in European cities with decades-old installed bases.


Smart Transportation Market Opportunities

Mobility-as-a-Service Platform Expansion

Integrated MaaS platforms that unify public transit, ride-hail, bike-share, and micro-mobility under a single payment interface represent a multi-billion-dollar opportunity within the Smart Transportation Market. Helsinki's Whim platform demonstrated that unified ticketing can shift 10–15% of private-car trips to shared modes, reducing congestion and emissions simultaneously. Cities across Southeast Asia and Latin America are issuing tenders for similar platforms, opening greenfield territory for technology providers.

Freight Corridor Intelligence in Emerging Markets

India’s Dedicated Freight Corridor initiative and Brazil’s proposed smart-highway concessions are generating USD-billion procurement pipelines for intelligent-transportation-system manufacturers. These projects apply weigh-in-motion sensors, dynamic routing, and emissions monitoring over long-haul corridors, a use case that is underpenetrated compared to urban traffic management.


Data Monetization and Anonymized Traffic Analytics

Aggregated, anonymized traffic-flow data have commercial value to real-estate developers, insurance underwriters, retail-site pickers, and logistics planners. Open data policies in cities allow licensing of curated datasets as ongoing cash streams to offset infrastructure expenditures [12]. The Smart Transportation Market would benefit when municipalities transition from pure cost centers to data-enabled revenue generators.


Cooperative Automated Driving Corridors

Dedicated corridors that combine V2X infrastructure with Level 4 autonomous truck platooning can boost freight throughput by 30–40% on intercity highways without widening a single lane. The EU's C-Roads Platform is piloting cooperative automated driving on cross-border corridors between Germany, Austria, and the Netherlands, establishing a procurement template that other regions will replicate.

Airport and Seaport Landside Intelligence

Landside traffic management at major airports and container ports is an emerging niche within the Smart Transportation Market. Heathrow Airport's Surface Access Strategy, which integrates real-time parking guidance, bus-priority signaling, and passenger-flow prediction, illustrates the operational and revenue upside of applying intelligent-transportation principles outside the traditional road-network context.


Smart Transportation Market Future Outlook

AI-Native Traffic Operations

By 2030, leading cities will operate traffic networks through AI-native command platforms that fuse camera feeds, lidar point clouds, connected-vehicle telemetry, and weather data into a single real-time decision layer. The IEA projects that AI-optimized signal networks alone could cut urban transport emissions by 8–12% by 2035, making the Smart Transportation Market a critical lever in municipal climate-action plans [10].

Platform Economics and MaaS Consolidation

The mobility-as-a-service sector is consolidating rapidly; fewer than a dozen global platform operators are expected to control integrated ticketing across the top 200 metropolitan areas by 2032. Revenue models will shift from per-trip fees to subscription bundles that blend transit, micro-mobility, and ride-hail — mirroring the streaming industry's evolution. The Smart Transportation Market will absorb this platform layer as a core growth segment.

Electrification and Charging-Network Intelligence

The global electric-vehicle fleet is forecast to exceed 350 million units by 2035, according to IRENA projections [18]. Smart charging orchestration — dynamic pricing, grid-aware load balancing, and route-integrated charging reservations — will generate a distinct technology layer within the Smart Transportation Market, linking energy and mobility data ecosystems.

ESG Reporting and Sustainable-Mobility Mandates

Corporate ESG disclosure frameworks (CSRD in Europe, SEC climate-risk rules in the US) increasingly require companies to quantify Scope 3 transport emissions [19]. Fleet operators and logistics companies will procure smart-transportation analytics to measure, report, and reduce their carbon footprints — translating regulatory pressure into sustained technology demand through the end of the forecast period.


Smart Transportation Market Segmentation

By Application

Segment Key Metric Primary Demand Driver
Traffic Management 34.50% share (2025) Municipal congestion-reduction mandates
Road Safety and Security 14.80% CAGR (2026–2035) Vision-zero policies, AI incident detection
Parking Management USD 14.80 Billion (2025) Sensor-guided urban parking, dynamic pricing
Passenger Information Management 12.90% CAGR (2026–2035) Real-time transit apps, digital signage
Freight Management USD 16.50 Billion (2025) E-commerce logistics, corridor intelligence


Traffic management remains the dominant application within the Smart Transportation Market, fueled by cities upgrading from fixed-timing signal controllers to AI-powered adaptive systems that respond to real-time flow data. Road safety and security is the fastest-growing application as vision-zero legislation in Europe and North America mandates intersection-level crash-prevention technology.

By Product Type

Segment Key Metric Primary Demand Driver
Advanced Transportation Management Systems (ATMS) 28.90% share (2025) Signal-optimization replacements
Advanced Traveler Information Systems (ATIS) USD 18.70 Billion (2025) Commuter-facing apps, digital signage
Cooperative Vehicle Systems 18.10% CAGR (2026–2035) V2X regulatory mandates
Electronic Fare Collection 12.20% CAGR (2026–2035) Contactless payment adoption


ATMS platforms anchor the product-type landscape of the Smart Transportation Market because they serve as the operational backbone for every signal, sensor, and camera within a city's traffic network. Cooperative vehicle systems are gaining momentum as V2X-equipped vehicles reach critical mass and roadside infrastructure investments mature across pilot corridors.

By Service

Segment Key Metric Primary Demand Driver
Cloud Services 44.20% share (2025) SaaS transit platforms, pay-as-you-grow models
Professional Services 16.40% CAGR (2026–2035) System integration, consulting
Deployment and Integration USD 22.80 Billion (2025) Greenfield smart-city builds


Cloud services dominate the Smart Transportation Market's service landscape because municipal agencies increasingly prefer subscription-based analytics platforms that eliminate on-premise hardware refresh cycles.

By Transportation Mode

Segment Key Metric Primary Demand Driver
Roadways 37.10% share (2025) Urban signal networks, highway ITS
Railways USD 25.60 Billion (2025) ERTMS/ETCS digital rail upgrades
Airways 13.40% CAGR (2026–2035) UTM, airport landside intelligence
Waterways 9.80% CAGR (2026–2035) Port vessel-traffic systems


Roadways is the largest segment in the Smart Transportation Market since the existing physical road infrastructure is widely available. Hence, it is the major segment to implement intelligent traffic management, adaptive signal control, and smart tolling systems to address urban congestion. Airways is the fastest expanding sector, fuelled by the rapid upgrading of Unmanned Traffic Management (UTM) systems and deployment of innovative landside intelligence solutions to boost efficiency at major airport hubs.

By Connectivity Technology

Segment Key Metric Primary Demand Driver
Cellular / C-V2X 54.50% share (2025) Automaker OEM integration, spectrum allocation
5G and LTE-M 20.30% CAGR (2026–2035) Ultra-low-latency use cases, edge computing
DSRC USD 10.40 Billion (2025) Installed-base toll systems, legacy interoperability
LPWAN / Other 11.20% CAGR (2026–2035) Parking sensors, asset tracking


Cellular / C-V2X stands as the dominant connectivity technology within the Smart Transportation Market, widely adopted by automotive OEMs due to its integration with existing mobile network infrastructure and favorable spectrum allocation policies globally. 5G and LTE-M represent the fastest-growing segment, as the push for ultra-low-latency communication and edge computing becomes essential for supporting advanced autonomous driving features and real-time, data-intensive intelligent transportation applications.

Regional Market Share Analysis

Region Key Metric Primary Investment Themes
North America 28.50% share (2025) Federal ITS grants, V2X spectrum policy, autonomy pilots
Europe 36.20% share (2025) C-ITS deployment, zero-emission mandates, open data
Asia-Pacific 15.40% CAGR (2026–2035) Megacity highways, MaaS, 5G-V2X rollouts
South America USD 7.80 Billion (2025) Smart-highway concessions, BRT modernization
Middle East & Africa 16.20% CAGR (2026–2035) NEOM/Vision 2030, new-city builds
Total USD 134.50 Billion (2025)

The Smart Transportation Market spans mature regulatory environments in Europe and North America alongside high-growth urbanization corridors in Asia-Pacific, South America, and the Middle East.


North America

Country Key Metric Key Driver
US 78.30% of regional share IIJA funding, FCC C-V2X spectrum allocation
Canada 12.80% of regional share Transport Canada connected-vehicle pilots
Mexico USD 3.40 Billion (2025) Toll-road digitization, Mexico City congestion pricing


The United States dominates the North American Smart Transportation Market owing to multi-billion-dollar federal grant cycles under the Infrastructure Investment and Jobs Act and a regulatory environment that is actively harmonizing C-V2X spectrum rules [6]. Canada's investments center on harsh-climate V2X testing corridors in Ontario and Alberta, while Mexico's toll-road concessionaires are embedding intelligent-transportation modules into newly awarded highway contracts.

Europe

Country Key Metric Key Driver
Germany 22.40% of regional share Autobahn digitization, C-Roads corridor leadership
UK 18.60% of regional share National Highways smart motorway programme
France USD 6.90 Billion (2025) SNCF digital rail, Paris low-emission zone tech
Italy 11.30% of regional share Telepass tolling ecosystem upgrades
Spain 14.80% CAGR (2026–2035) Barcelona superblock sensor networks
Nordic Countries USD 4.10 Billion (2025) Helsinki MaaS platform, Oslo EV-charging corridors
Russia 5.20% of regional share Moscow ITS ring-road network
Rest of Europe 8.70% of regional share EU Cohesion Fund ITS projects


Europe's leadership in the Smart Transportation Market stems from the EU's binding Sustainable and Smart Mobility Strategy, which requires member states to deploy C-ITS services on TEN-T core corridors by 2030 [5]. Germany's digital-autobahn initiative and the UK's smart-motorway program are the continent's two largest single-country investment streams, collectively exceeding USD 5 billion in committed capital through 2028.

Asia-Pacific

Country Key Metric Key Driver
China 38.50% of regional share Highway informatization, Baidu Apollo V2X
India 17.90% CAGR (2026–2035) Smart Cities Mission, NHAI intelligent corridors
Japan USD 5.20 Billion (2025) Society 5.0 transport digitization
South Korea 13.70% of regional share K-City autonomous testbed, 5G-V2X mandates
ASEAN 16.50% CAGR (2026–2035) Jakarta MRT integration, Bangkok BTS expansion
Rest of Asia-Pacific 8.40% of regional share Smart-highway tenders in Vietnam, Bangladesh


Asia-Pacific is the fastest-growing region for the Smart Transportation Market, propelled by the largest urbanization wave in human history. China alone plans to equip 500,000 km of national highways with intelligent sensing infrastructure by 2035, while India's NHAI is deploying electronic toll-collection and incident-detection systems across 65,000 km of national highways [2][8].

South America

Country Key Metric Key Driver
Brazil 58.30% of regional share São Paulo adaptive signal program
Argentina 13.50% CAGR (2026–2035) Buenos Aires BRT corridor digitization
Rest of South America USD 1.90 Billion (2025) Colombian and Chilean toll-road modernization


Brazil anchors the South American Smart Transportation Market through São Paulo's USD 400-million adaptive-signal and bus-priority program, which serves as a template for other Latin American megacities [17]. Argentina and Colombia are following with IDB-financed corridor-intelligence projects focused on freight logistics and BRT system upgrades.

Middle East & Africa

Country Key Metric Key Driver
Saudi Arabia 34.20% of regional share NEOM autonomous-transit corridor
UAE 28.70% of regional share Dubai RTA self-driving transport strategy
South Africa USD 1.10 Billion (2025) Gauteng Freeway Improvement Scheme
Egypt 15.80% CAGR (2026–2035) New Administrative Capital ITS build-out
Rest of MEA 12.60% of regional share Kenya, Nigeria urban BRT sensor networks


The Middle East's new-city mega-projects — NEOM, Lusail, and Masdar — are deploying intelligent-transportation systems from inception rather than retrofitting legacy infrastructure, creating showcase implementations that accelerate vendor credibility globally.


Smart Transportation Market By Region, 2025-2035

Competitive Benchmarking

The Smart Transportation Market exhibits medium concentration, with the top five players collectively holding an estimated 28–35% revenue share. The competitive field spans global technology conglomerates, defense-oriented systems integrators, and niche ITS pure-plays. M&A activity is intensifying as platform providers seek end-to-end portfolio coverage, though the market remains fragmented enough for specialized entrants to capture municipal tenders in specific geographies. The estimated HHI sits between 600 and 900, indicating a moderately competitive environment.

Company Est. Revenue Share Range Key Offerings for Smart Transportation Market Strategic Positioning
Siemens Mobility ~7–10% Adaptive signal control, rail automation, MaaS platforms Full-stack urban and rail ITS integrator
IBM Corporation ~5–8% Intelligent Operations Center, AI traffic analytics AI-first enterprise transport platform
Cisco Systems ~4–7% Network infrastructure, edge computing for ITS Connectivity backbone and cybersecurity layer
Thales Group ~4–6% Fare collection, rail signaling, security systems Defense-grade transport systems
Cubic Transportation Systems ~3–6% Contactless fare media, traffic management Transit-payment and operations specialist
Kapsch TrafficCom ~3–5% Tolling, traffic management, C-ITS European corridor tolling leader
Iteris Inc. ~2–4% Intersection sensors, ClearGuide analytics Signal-optimization pure-play
TomTom International ~2–4% HD mapping, real-time traffic data, navigation Location-data and routing intelligence
Conduent Incorporated ~2–3% Tolling, transit fare collection, violations processing Government-services outsourcing model
Hitachi Ltd. ~2–3% Rail operations, urban mobility analytics, Lumada IoT Rail-centric digital transformation


Recent News & Developments

  • Siemens Mobility (June 2025) presented state-of-the-art digital transport solutions as Signaling X, Train2Cloud, Digital Station and Railigent X, among others at the UITP Summit 2025. These systems aim at enhancing transportation efficiency, connection, infrastructure intelligence and passenger experience in urban mobility networks.
  • Thales (December 2024) collaborated with Avinor to roll out a next-generation unmanned traffic management (UTM) system throughout Norway, in an effort to upgrade the country’s airspace management for both unmanned and manned aircraft. The project aims to address the issues of the European drone legal environment and scalability of the drone sector. The system will allow and assure real time data sharing, monitoring of the airspace compliance and automatic integration into the regulated airspace for an efficient air traffic management.


Smart Transportation Market Report Scope

Parameter Detail
Market Scope Global Smart Transportation Market — hardware, software, services, connectivity
Study Period 2021–2035
CAGR (Forecast) 13.10% (2026–2035)
Base Year Value USD 134.50 Billion (2025)
2026 Forecast Value USD 153.50 Billion
2035 Forecast Value USD 464.70 Billion
Fastest Growing Segment Cooperative Vehicle Systems (18.10% CAGR)
Companies Profiled Siemens, IBM, Cisco, Thales, Cubic, Kapsch, Iteris, TomTom, Conduent, Hitachi
Valuation Currency USD Billion
CAGR Driver Disclaimer Driver-impact percentages are directional; they are not additive to the CAGR


FAQs

How does edge computing change deployment timelines for Smart Transportation Market projects?
Edge nodes cut signal-optimization latency below 10 milliseconds, enabling real-time adaptive responses at intersections. Cities using edge-first architectures report 15–20% faster system rollouts than cloud-only designs [14].
What cybersecurity standards should procurement teams require in Smart Transportation Market contracts?
ISO/SAE 21434 governs vehicle cybersecurity engineering, while NIST SP 800-82 covers industrial transport control systems. Vendor contracts should mandate compliance with both frameworks [14].
How do public-private partnerships affect Smart Transportation Market project financing?
PPP structures reduce upfront municipal capital exposure by 40–60%, shifting lifecycle costs to concession operators across 15–25 year terms. This model accelerates deployment in budget-constrained cities [13].
What role does digital-twin simulation play in corridor planning?
Digital twins model corridor traffic scenarios before physical deployment, cutting infrastructure rework costs by 25–30%. Singapore and Helsinki have pioneered city-scale twin platforms [9].
How can legacy fleet operators integrate with smart transportation platforms?
Retrofit telematics modules transmit GPS, speed, and diagnostics to centralized platforms without full vehicle replacement. Integration typically costs USD 200–500 per unit [11].
Which interoperability standards matter most for multi-vendor Smart Transportation Market deployments?
NTCIP, DATEX II, and GTFS-RT ensure cross-vendor data exchange. Interoperability gaps remain the leading cause of integration delays in mixed-vendor environments [15].
How does weather-adaptive routing benefit freight corridor efficiency?
Algorithms reroute freight around storms and icy roads, reducing delay costs by 12–18% annually. Carriers using predictive weather feeds report measurable fuel savings [11].    
Author
Author
Author Profile
Nirmit Biswas LinkedIn
Senior Research Analyst
With 5+ years of expertise in Market Intelligence and Strategic Research, Nirmit Biswas specializes in ICT, Semiconductors, and BFSI. Backed by an MBA in Financial Services and a Computer Science foundation, Nirmit blends technical depth with business acumen. He has successfully led 100+ projects for global enterprises and startups, including Amazon, Cisco, L&T and Huawei, delivering market estimations, competitive benchmarking, and GTM strategies. His focus lies in transforming complex data into clear, actionable insights that drive growth, innovation, and investment decisions. Recognized for bridging engineering innovation with executive strategy, Nirmit helps businesses navigate dynamic markets with confidence.
Co-Author
Co-Author Profile
Aarti Dhapte LinkedIn
AVP - Research
A consulting professional focused on helping businesses navigate complex markets through structured research and strategic insights. I partner with clients to solve high-impact business problems across market entry strategy, competitive intelligence, and opportunity assessment. Over the course of my experience, I have led and contributed to 100+ market research and consulting engagements, delivering insights across multiple industries and geographies, and supporting strategic decisions linked to $500M+ market opportunities. My core expertise lies in building robust market sizing, forecasting, and commercial models (top-down and bottom-up), alongside deep-dive competitive and industry analysis. I have played a key role in shaping go-to-market strategies, investment cases, and growth roadmaps, enabling clients to make confident, data-backed decisions in dynamic markets.

Research Approach


Secondary Research

The secondary research process involved comprehensive analysis of regulatory databases, transportation authority publications, government policy documents, and authoritative industry organizations. Key sources included the US Department of Transportation (USDOT), Federal Highway Administration (FHWA), Federal Transit Administration (FTA), European Commission Directorate-General for Mobility and Transport (DG MOVE), European Union Agency for Railways (ERA), International Transport Forum (ITF/OECD), International Association of Public Transport (UITP), US Intelligent Transportation Society of America (ITS America), European Telecommunications Standards Institute (ETSI), National Highway Traffic Safety Administration (NHTSA), Bureau of Transportation Statistics (BTS), Eurostat Transport Database, World Bank Transport Data, International Civil Aviation Organization (ICAO), International Maritime Organization (IMO), and national transport ministry reports from key markets. These sources were used to collect infrastructure investment data, regulatory frameworks for autonomous vehicles, smart city initiatives, traffic management statistics, public transit ridership trends, and market landscape analysis for vehicle telematics, intelligent traffic systems, mobility-as-a-service platforms, and connected vehicle technologies.


Primary Research

Qualitative and quantitative insights were obtained by interviewing supply-side and demand-side stakeholders during the primary research process. The supply-side sources consisted of CEOs, VPs of Product Development, leaders of smart mobility solutions, and commercial directors from software vendors, automotive technology companies, and intelligent transportation system providers. Urban planners, fleet managers, public transit operators, smart city coordinators, transportation authority directors, and procurement leads from municipal governments, transportation agencies, and logistics companies constituted demand-side sources. The primary research garnered insights on infrastructure investment patterns, public-private partnership models, and regulatory compliance requirements, confirmed technology deployment timelines, and validated market segmentation.

Primary Respondent Breakdown:

By Designation: C-level Primaries (28%), Director Level (35%), Others (37%)

By Region: North America (40%), Europe (25%), Asia-Pacific (28%), Rest of World (7%)


Market Size Estimation

Global market valuation was derived through revenue mapping and deployment volume analysis. The methodology included:

Identification of 50+ key technology providers and system integrators across North America, Europe, Asia-Pacific, and Latin America

Product mapping across vehicle telematics, traffic management systems, smart parking solutions, freight management platforms, rail traffic management, aviation systems, and maritime software

Analysis of reported and modeled annual revenues specific to smart transportation portfolios

Coverage of manufacturers and service providers representing 75-80% of global market share in 2024

Extrapolation using bottom-up (deployment volume × ASP by country/region) and top-down (vendor revenue validation) approaches to derive segment-specific valuations across roadways, railway, airway, and marine transportation modes

This methodology is tailored specifically for the smart transportation market segments identified in your report, incorporating relevant government transportation authorities and adjusting the primary respondent percentages as requested.

Download Free Sample

Kindly complete the form below to receive a free sample of this Report

Download PDF ×

We do not share your information with anyone. However, we may send you emails based on your report interest from time to time. You may contact us at any time to opt-out.

















