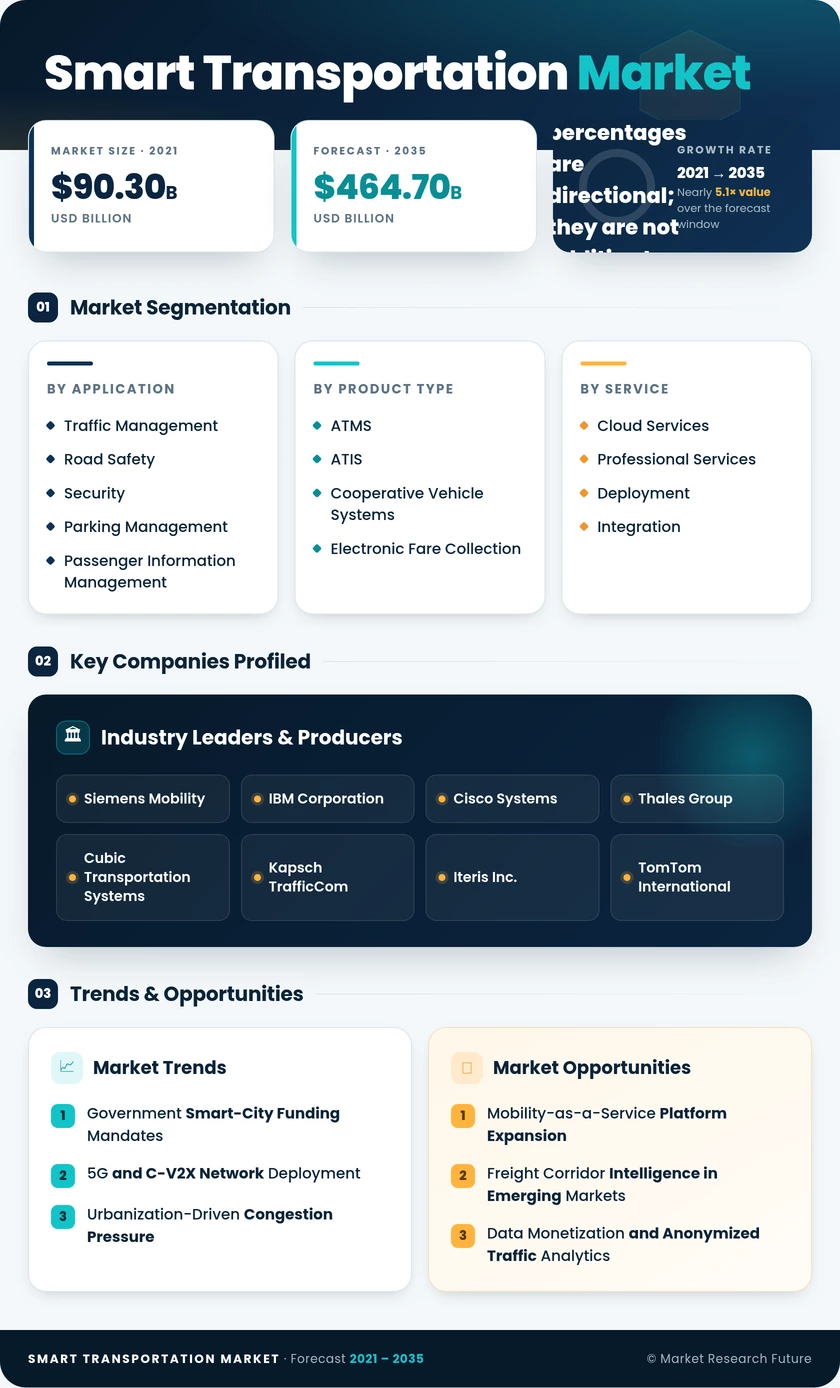
Smart Transportation Market (2026 - 2035)

ID: MRFR/SEM/1834-CR
132 Pages
Nirmit Biswas
Last Updated: July 10, 2026
Smart Transportation Market Size, Share and Research Report By Application (Traffic Management, Road Safety and Security, Parking Management, Passenger Information Management, Freight Management), By Product Type (Advanced Transportation Management Systems (ATMS), Advanced Traveler Information Systems (ATIS), Cooperative Vehicle Systems, Electronic Fare Collection), By Service (Cloud Services, Professional Services, Deployment and Integration), By Transportation Mode (Roadways, Railways, Airways, Waterways), By Connectivity Technology (Cellular / C-V2X, 5G and LTE-M, DSRC, LPWAN / Other) and By Regional (North America, Europe, South America, Asia Pacific, Middle East and Africa) - Industry Forecast to 2035.
Smart Transportation Market
Market Size
Forecast Period2026-2035
CAGR (2026-2035)13.10%
2025 Market SizeUSD 134.50 Billion
2026 Market SizeUSD 153.50 Billion
2035 Market SizeUSD 464.70 Billion
Key Players
Siemens Mobility
IBM Corporation
Cisco Systems
Thales Group
Cubic Transportation Systems
Kapsch TrafficCom
Opportunities
  • Mobility-as-a-Service Platform Expansion
  • Freight Corridor Intelligence in Emerging Markets
  • Data Monetization and Anonymized Traffic Analytics
  1. 1 Market Overview |
    1. 1.1 Study Assumptions & Market Definition |
    2. 1.2 Scope of the Study |
    3. 1.3 Research Methodology
  2. 2 Market Summary & Key Takeaways
  3. 3 Market Dynamics |
    1. 3.1 Market Drivers Analysis | |
      1. 3.1.1 Government Smart-City Funding Mandates | |
      2. 3.1.2 5G and C-V2X Network Deployment | |
      3. 3.1.3 Urbanization-Driven Congestion Pressure | |
      4. 3.1.4 AI-Powered Adaptive Signal Optimization | |
      5. 3.1.5 Electrification of Public Transit Fleets | |
      6. 3.1.6 Freight Digitization and Corridor Intelligence | |
      7. 3.1.7 Data Monetization from Transport Platforms |
    2. 3.2 Market Restraints Analysis | |
      1. 3.2.1 High Upfront Infrastructure Investment Costs | |
      2. 3.2.2 Cybersecurity and Data-Privacy Risks | |
      3. 3.2.3 Interoperability Gaps Across Legacy Systems | |
      4. 3.2.4 Skilled-Workforce Shortages for ITS Integration | |
      5. 3.2.5 Regulatory Fragmentation Across Jurisdictions |
    3. 3.3 Market Opportunity Analysis | |
      1. 3.3.1 Mobility-as-a-Service Platform Expansion | |
      2. 3.3.2 Freight Corridor Intelligence in Emerging Markets | |
      3. 3.3.3 Data Monetization and Anonymized Traffic Analytics | |
      4. 3.3.4 Cooperative Automated Driving Corridors | |
      5. 3.3.5 Airport and Seaport Landside Intelligence |
    4. 3.4 Industry Value Chain Analysis |
    5. 3.5 Porter's Five Forces Analysis
  4. 4 Global Smart Transportation Market Size & Forecast (2021–2035) |
    1. 4.1 Historical Market Size (2021–2025) |
    2. 4.2 Current & Forecast Market Size (2026–2035) |
    3. 4.3 Market Size by Revenue (USD Billion) |
    4. 4.4 Year-over-Year Growth Analysis
  5. 5 Segmentation Analysis |
    1. 5.1 By Application | |
      1. 5.1.1 Traffic Management | |
      2. 5.1.2 Road Safety and Security | |
      3. 5.1.3 Parking Management | |
      4. 5.1.4 Passenger Information Management | |
      5. 5.1.5 Freight Management |
    2. 5.2 By Product Type | |
      1. 5.2.1 Advanced Transportation Management Systems (ATMS) | |
      2. 5.2.2 Advanced Traveler Information Systems (ATIS) | |
      3. 5.2.3 Cooperative Vehicle Systems | |
      4. 5.2.4 Electronic Fare Collection |
    3. 5.3 By Service | |
      1. 5.3.1 Cloud Services | |
      2. 5.3.2 Professional Services | |
      3. 5.3.3 Deployment and Integration |
    4. 5.4 By Transportation Mode | |
      1. 5.4.1 Roadways | |
      2. 5.4.2 Railways | |
      3. 5.4.3 Airways | |
      4. 5.4.4 Waterways |
    5. 5.5 By Connectivity Technology | |
      1. 5.5.1 Cellular / C-V2X | |
      2. 5.5.2 5G and LTE-M | |
      3. 5.5.3 DSRC | |
      4. 5.5.4 LPWAN / Other
  6. 6 Regional Analysis |
    1. 6.1 North America | |
      1. 6.1.1 United States | |
      2. 6.1.2 Canada | |
      3. 6.1.3 Mexico |
    2. 6.2 Europe | |
      1. 6.2.1 Germany | |
      2. 6.2.2 United Kingdom | |
      3. 6.2.3 France | |
      4. 6.2.4 Italy | |
      5. 6.2.5 Spain | |
      6. 6.2.6 Nordic Countries | |
      7. 6.2.7 Russia | |
      8. 6.2.8 Rest of Europe |
    3. 6.3 Asia-Pacific | |
      1. 6.3.1 China | |
      2. 6.3.2 India | |
      3. 6.3.3 Japan | |
      4. 6.3.4 South Korea | |
      5. 6.3.5 ASEAN | |
      6. 6.3.6 Rest of Asia-Pacific |
    4. 6.4 South America | |
      1. 6.4.1 Brazil | |
      2. 6.4.2 Argentina | |
      3. 6.4.3 Rest of South America |
    5. 6.5 Middle East & Africa | |
      1. 6.5.1 Saudi Arabia | |
      2. 6.5.2 UAE | |
      3. 6.5.3 South Africa | |
      4. 6.5.4 Egypt | |
      5. 6.5.5 Rest of MEA
  7. 7 Competitive Landscape |
    1. 7.1 Market Share Analysis (2025) |
    2. 7.2 Competitive Benchmarking Matrix |
    3. 7.3 Company Profiles | |
      1. 7.3.1 Siemens Mobility | |
      2. 7.3.2 IBM Corporation | |
      3. 7.3.3 Cisco Systems | |
      4. 7.3.4 Thales Group | |
      5. 7.3.5 Cubic Transportation Systems | |
      6. 7.3.6 Kapsch TrafficCom | |
      7. 7.3.7 Iteris Inc. | |
      8. 7.3.8 TomTom International | |
      9. 7.3.9 Conduent Incorporated | |
      10. 7.3.10 Hitachi Ltd.
  8. 8 Future Outlook & Strategic Recommendations (2026–2035) |
    1. 8.1 AI-Native Traffic Operations |
    2. 8.2 Platform Economics and MaaS Consolidation |
    3. 8.3 Electrification and Charging-Network Intelligence |
    4. 8.4 ESG Reporting and Sustainable-Mobility Mandates
  9. 9 Recent Developments & News
  10. 10 Frequently Asked Questions (FAQs)
  11. 11 Report Scope & Methodology |
    1. 11.1 Study Period & Base Year |
    2. 11.2 Data Sources & Citations |
    3. 11.3 Abbreviations
  12. 12 LIST OF TABLES |
  13. TABLE 1 Global Smart Transportation Market Size & Forecast, by Revenue (USD Billion), 2021–2035 |
  14. TABLE 2 Global Smart Transportation Market — Year-over-Year Growth Analysis, 2021–2035 |
  15. TABLE 3 Market Driver Impact Analysis, 2026–2035 |
  16. TABLE 4 Market Restraint Impact Analysis, 2026–2035 |
  17. TABLE 5 Global Smart Transportation Market Size, by Application, 2021–2035 (USD Billion) |
  18. TABLE 6 Global Smart Transportation Market Size, by Product Type, 2021–2035 (USD Billion) |
  19. TABLE 7 Global Smart Transportation Market Size, by Service, 2021–2035 (USD Billion) |
  20. TABLE 8 Global Smart Transportation Market Size, by Transportation Mode, 2021–2035 (USD Billion) |
  21. TABLE 9 Global Smart Transportation Market Size, by Connectivity Technology, 2021–2035 (USD Billion) |
  22. TABLE 10 Global Smart Transportation Market Size, by Region, 2021–2035 (USD Billion) |
  23. TABLE 11 North America Smart Transportation Market Size, by Country, 2021–2035 (USD Billion) |
  24. TABLE 12 Europe Smart Transportation Market Size, by Country, 2021–2035 (USD Billion) |
  25. TABLE 13 Asia-Pacific Smart Transportation Market Size, by Country, 2021–2035 (USD Billion) |
  26. TABLE 14 South America Smart Transportation Market Size, by Country, 2021–2035 (USD Billion) |
  27. TABLE 15 Middle East & Africa Smart Transportation Market Size, by Country, 2021–2035 (USD Billion) |
  28. TABLE 16 Competitive Benchmarking Matrix — Global Smart Transportation Market, 2025 |
  29. TABLE 17 Company Profiles — Key Players, Global Smart Transportation Market |
  30. TABLE 18 Recent Developments & Strategic Announcements, 2023–2025 |
  31. TABLE 19 Report Scope & Methodology Summary |
  32. TABLE 20 Detailed Sources and Citations
  33. 13 LIST OF FIGURES |
  34. FIGURE 1 Smart Transportation Market Dynamics — Drivers, Restraints, and Opportunities |
  35. FIGURE 2 Industry Value Chain Analysis — Smart Transportation Market |
  36. FIGURE 3 Porter's Five Forces Analysis — Smart Transportation Market |
  37. FIGURE 4 Global Smart Transportation Market Size Trend (USD Billion), 2021–2035 |
  38. FIGURE 5 Smart Transportation Market Share, by Application, 2025 |
  39. FIGURE 6 Smart Transportation Market Share, by Product Type, 2025 |
  40. FIGURE 7 Smart Transportation Market Share, by Service, 2025 |
  41. FIGURE 8 Smart Transportation Market Share, by Transportation Mode, 2025 |
  42. FIGURE 9 Smart Transportation Market Share, by Connectivity Technology, 2025 |
  43. FIGURE 10 Smart Transportation Market Share, by Region, 2025 |
  44. FIGURE 11 North America Smart Transportation Market Share, by Country, 2025 |
  45. FIGURE 12 Europe Smart Transportation Market Share, by Country, 2025 |
  46. FIGURE 13 Asia-Pacific Smart Transportation Market Share, by Country, 2025 |
  47. FIGURE 14 South America Smart Transportation Market Share, by Country, 2025 |
  48. FIGURE 15 Middle East & Africa Smart Transportation Market Share, by Country, 2025 |
  49. FIGURE 16 Competitive Landscape — Market Concentration & Top-Player Positioning

Segmentation Quick Reference

DimensionSub-SegmentsDominant SegmentFastest Growing Segment
ApplicationTraffic Management, Road Safety and Security, Parking Management, Passenger Information Management, Freight ManagementTraffic Management (34.50% share, 2025)Road Safety and Security (14.80% CAGR)
Product TypeATMS, ATIS, Cooperative Vehicle Systems, Electronic Fare CollectionATMS (28.90% share, 2025)Cooperative Vehicle Systems (18.10% CAGR)
ServiceCloud Services, Professional Services, Deployment and IntegrationCloud Services (44.20% share, 2025)Professional Services (16.40% CAGR)
Transportation ModeRoadways, Railways, Airways, WaterwaysRoadways (37.10% share, 2025)Airways (13.40% CAGR)
Connectivity TechnologyCellular / C-V2X, 5G and LTE-M, DSRC, LPWAN / OtherCellular / C-V2X (54.50% share, 2025)5G and LTE-M (20.30% CAGR)


Market Segmentation Overview

By Application

Sub-SegmentKey Trend
Traffic ManagementAI-driven adaptive signals replacing fixed-timing controllers across Tier-1 and Tier-2 cities
Road Safety and SecurityVision-zero legislation mandating intersection-level crash-prevention technology
Parking ManagementSensor-guided systems with dynamic pricing reducing urban cruising by 20–30%
Passenger Information ManagementReal-time transit apps and digital signage improving rider experience and mode shift
Freight ManagementE-commerce growth driving corridor-level digitization for last-mile and long-haul logistics


Traffic management and road safety together account for the largest share of application-layer spending, reflecting municipal priorities around congestion reduction and pedestrian protection. Freight management is gaining strategic importance as e-commerce volumes intensify pressure on intercity and urban distribution networks.

By Product Type

Sub-SegmentKey Trend
Advanced Transportation Management Systems (ATMS)Backbone platforms integrating signal, sensor, and camera networks city-wide
Advanced Traveler Information Systems (ATIS)Commuter-facing real-time journey planners and multimodal route optimizers
Cooperative Vehicle SystemsV2X-equipped roadside units enabling vehicle-infrastructure communication at scale
Electronic Fare CollectionContactless open-loop payment systems replacing legacy magnetic-stripe media


ATMS remains the product-type anchor because it underpins all downstream analytics and control functions. Cooperative vehicle systems are the fastest-growing segment as V2X regulatory mandates create a hardware-upgrade cycle for both vehicles and roadside infrastructure.

By Service

Sub-SegmentKey Trend
Cloud ServicesSaaS traffic-analytics platforms with subscription pricing gaining municipal adoption
Professional ServicesSystem-integration consultancies bridging legacy infrastructure and new ITS platforms
Deployment and IntegrationTurnkey smart-city project delivery for greenfield urban developments


Cloud services dominate because they eliminate capital-intensive on-premise hardware refreshes and allow agencies to scale analytics capacity on demand. Professional services are growing fastest as the complexity of multi-vendor, multi-protocol ITS environments demands specialized integration expertise.

By Transportation Mode

Sub-SegmentKey Trend
RoadwaysUrban signal networks and highway ITS absorbing the largest capital flows
RailwaysERTMS/ETCS digital-rail migration programs in Europe and Asia
AirwaysUTM systems and airport landside traffic intelligence expanding rapidly
WaterwaysPort vessel-traffic management systems digitizing maritime corridors


Roadways capture the largest share of mode-level spending due to the sheer scale of urban and intercity road networks. Airways represent the fastest-growing mode as unmanned-traffic-management and airport-surface-movement solutions move from pilot to production deployments.

By Connectivity Technology

Sub-SegmentKey Trend
Cellular / C-V2XAutomaker OEM integration and spectrum reallocation driving dominant share
5G and LTE-MUltra-low-latency use cases enabling real-time V2X and edge computing
DSRCInstalled-base toll systems maintaining relevance in legacy interoperability
LPWAN / OtherLow-cost parking sensors and asset trackers serving municipal IoT networks


Cellular/C-V2X holds the largest connectivity-technology share as automakers embed C-V2X chipsets into production vehicles and transport agencies deploy compatible roadside units. 5G and LTE-M represent the fastest-growing connectivity tier, driven by latency-sensitive applications that require sub-10-millisecond response times.


 

Download PDF ×

We do not share your information with anyone. However, we may send you emails based on your report interest from time to time. You may contact us at any time to opt-out.