Smart Window Market (2026 - 2035)

Smart Window Market Size, Share and Research Report By Technology (Electrochromic Technology, PDLC, SPD and Photochromic), by Application (Architectural and construction, Transportation, Automotive, Aircraft, Marine, Consumer Goods and Power Generation), by Region (North America, Europe, Asia-Pacific, Middle East & Africa and Central & South America) - Industry Forecast Till 2035
ID: MRFR/SEM/8117-CR
120 Pages
Apoorva Priyadarshi, Aarti Dhapte
Last Updated: July 10, 2026
Smart Window Market
Market Size
Forecast Period2026-2035
CAGR (2026-2035)8.50%
2025 Market SizeUSD 6.55 Billion
2035 Market SizeUSD 14.82 Billion
Key Players
Lutron Electronics
Somfy SA
Hunter Douglas
View Inc.
Saint-Gobain
Gentex Corporation
Opportunities
  • Retrofit Incentive Programs in Mature Economies
  • Solar-Powered and Energy-Harvesting Glazing
  • Emerging-Market Adoption in the Middle East and South America

Smart Window Market Summary

The Smart Window Market stood at USD 6.55 Billion in 2025, is projected to reach USD 7.11 Billion in 2026, and is forecast to grow to USD 14.82 Billion by 2035, expanding at a CAGR of 8.50% during 2026–2035. Two forces are pulling this growth forward simultaneously: mandatory building energy codes — California's Title 24 and the 2024 IECC edition chief among them — and corporate decarbonization pledges that treat automated fenestration as a non-negotiable line item in capital budgets [1]. The Smart Window Market is no longer a niche luxury play; it sits at the intersection of energy policy and occupant comfort, with procurement teams evaluating payback cycles rather than aesthetics alone.

Legacy manual blinds and static glazing are giving way to sensor-driven motorized shading and switchable glass that respond to daylight, occupancy, and grid signals in real time. The U.S. Department of Energy estimates that windows account for roughly 30% of building heating and cooling loads, and advanced fenestration can cut that figure by 20–35% [2]. Venture-backed glass specialists and established shade manufacturers alike are embedding edge computing into motor controllers, layering cybersecurity protections, and piloting ESCO financing to shorten payback periods for retrofit projects.

North America commands the largest revenue pool in the Smart Window Market, holding approximately 34.4% of global revenue in 2025, anchored by stringent energy codes and a deep commercial real-estate pipeline. Asia-Pacific is the fastest-growing region, advancing at a 13.25% CAGR through 2035 as urbanization and green-building certification programs accelerate adoption across China, India, and South Korea. Europe ranks second by market share at roughly 26%, driven by the EU Energy Performance of Buildings Directive and aggressive renovation-wave targets [3]. By the mid-2030s, smart fenestration will likely be standard specification in most Class A office construction globally.


Key Report Takeaways

• By Product Type

  • Motorized Roller Shades captured approximately 36.5% of the Smart Window Market share in 2025, buoyed by competitive pricing and compatibility with existing window frames.
  • Smart Glass Panels & Controllers are expanding at a 11.75% CAGR through 2035, driven by demand for tint-on-demand glazing in premium commercial envelopes.

• By Application

  • Commercial deployments accounted for roughly 39.8% of the Smart Window Market share in 2025, led by Class A office and healthcare campus projects.
  • Residential applications are registering the fastest growth at 12.65% CAGR, propelled by smart-home platform integration and Matter-enabled IoT ecosystems.

• By Region

  • North America retained the dominant position in the Smart Window Market, contributing about 34.4% of 2025 global revenue.
  • Asia-Pacific is on track to post a 13.25% CAGR from 2026 to 2035, with China and India leading capacity additions.


Smart Window Market Size and Forecast (2021–2035)

Market Research Future's sizing model blends bottom-up product shipment data, top-down macroeconomic indicators, and validated vendor disclosures across 35 countries. Historical figures (2021–2024) reflect actual trade flows, while the forecast period (2026–2035) applies regression-adjusted growth assumptions calibrated to energy code adoption curves and construction-start indices.
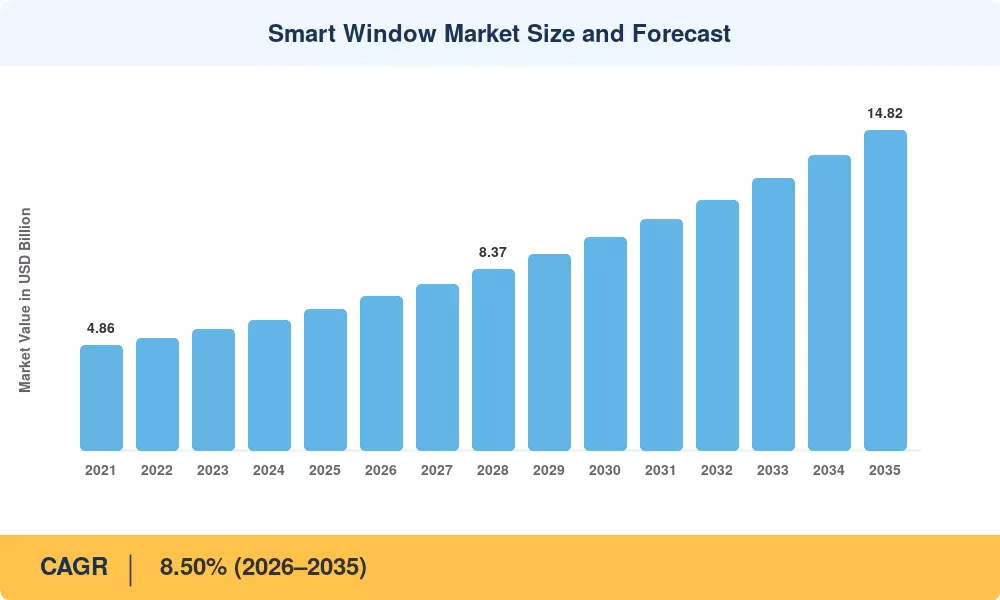
Smart Window Market Size and Forecast
Our Impact
Enabled $4.3B Revenue Impact for Fortune 500 and Leading Multinationals
Partnering with 2000+ Global Organizations Each Year
30K+ Citations by Top-Tier Firms in the Industry

Driver Impact Analysis

Driver ~% Impact on CAGR Geographic Relevance Impact Timeline
Stringent building energy codes 22% North America, Europe Short-term (≤2 yr)
Smart-home & IoT platform convergence 18% Global Medium-term (2–4 yr)
Corporate net-zero commitments 16% North America, Europe Medium-term (2–4 yr)
Urbanization in Asia-Pacific 14% Asia-Pacific Long-term (≥4 yr)
HVAC energy savings from dynamic glazing 12% Global Short-term (≤2 yr)
ESCO financing & green bonds 10% North America, Europe Medium-term (2–4 yr)
Occupant wellness & daylighting mandates 8% North America Long-term (≥4 yr)


Building Energy Codes and Regulatory Mandates

In commercial buildings larger than 10,000 square feet, California's Title 24 now mandates automatic shading controls, so turning smart windows from an optional upgrade into a code-compliance requirement [1]. In a similar vein, the 2024 International Energy Conservation Code strengthened constraints on solar heat gain coefficient and fenestration U-factor, encouraging architects to use dynamic glass solutions that can adjust transmittance in real time. The near-term growth trajectory of the Smart Window Market is supported by these mandates, which transform discretionary spending into non-negotiable capital expenditure.


Smart-Home and IoT Platform Convergence

The fragmentation that had previously impeded the adoption of motorized shades in residential settings was eliminated with the ratification of the Matter protocol in late 2023, which established a single interoperability layer across the Amazon Alexa, Google Home, and Apple HomeKit ecosystems [11]. Compared to proprietary options, shade manufacturers who incorporate Matter-compatible radios into motor controllers are able to charge price premiums of 15–20%. This platform convergence speeds up replacement cycles and increases demand in the residential part of the smart window market.


Corporate Net-Zero Targets

More than 6,000 companies worldwide have committed to Science Based Targets, and envelope optimization ranks among the top three decarbonization levers for commercial real estate portfolios [8]. Dynamic glazing that demonstrably cuts HVAC consumption by 20–30% provides verifiable Scope 2 emission reductions, aligning capital-improvement budgets with sustainability reporting requirements. The resulting pipeline of corporate retrofit projects lends multi-year visibility to the Smart Window Market.

Urbanization and Construction Growth in Asia-Pacific

The United Nations projects that Asia-Pacific will add approximately 1.2 billion urban residents by 2050, requiring an estimated 230 billion square feet of new commercial and residential floor space [7]. Green-building certification programs such as India's GRIHA and China's Three-Star Rating increasingly award credits for automated fenestration, creating a regulatory pull effect similar to what Title 24 achieved in the United States. This construction pipeline positions Asia-Pacific as the highest-growth geography for the Smart Window Market through 2035.


Restraints Impact Analysis

The restraint percentages below represent directional estimates of each barrier's dampening effect on Smart Window Market growth. They are qualitative and should not be subtracted from the headline CAGR.

Restraint ~% Negative Impact on CAGR Geographic Relevance Impact Timeline
High upfront installation cost –20% Global Short-term (≤2 yr)
Fragmented retrofit standards –15% Europe, Asia-Pacific Medium-term (2–4 yr)
Skilled-labor shortage for integration –12% North America Medium-term (2–4 yr)
Cybersecurity and data-privacy concerns –10% Global Long-term (≥4 yr)
Limited consumer awareness in emerging markets –8% South America, MEA Long-term (≥4 yr)


High Upfront Installation Cost

Dynamic glazing systems can cost USD 50–100 per square foot installed — three to five times the price of conventional low-E glass — creating sticker shock for building owners evaluating total project budgets [14]. While lifecycle savings typically offset the premium within seven to ten years, capital-constrained developers in price-sensitive markets often default to static alternatives. Compression of this cost gap depends on manufacturing scale-up and thin-film process yields that remain below 80% at several leading fabrication lines.

Fragmented Retrofit Standards

The lack of standardized mullion dimensions and wire paths in existing building stocks throughout Europe and Asia-Pacific necessitates specialized designing for every retrofit project [3]. In comparison to new-construction installations, this fragmentation inflates soft expenses, such as design, permitting, and commissioning, by an estimated 25–35%. The addressable retrofit opportunity in the Smart Window Market will remain partially locked until modular retrofit kits are widely accepted.


Skilled-Labor Shortage

Electricians, low-voltage technicians, and BMS integrators must collaborate to install and commission networked smart window systems; this labor nexus is severely short-staffed throughout North America [15]. The rate at which the Smart Window Market can turn backlog into installed capacity is limited by the U.S. Bureau of Labor Statistics' forecast of a 6% imbalance between supply and demand for electricians through 2032.


Smart Window Market Opportunities

Retrofit Incentive Programs in Mature Economies

Federal programs such as the U.S. Inflation Reduction Act's Section 179D deduction and the EU's Renovation Wave initiative earmark billions in tax credits and grants for envelope upgrades [6]. Smart window manufacturers that pre-certify product lines for these incentive programs can collapse procurement timelines and win specification in public-sector projects. The retrofit segment is already registering a 10.95% CAGR, and accelerated incentive drawdowns could push that figure higher.

Solar-Powered and Energy-Harvesting Glazing

Solar-powered smart window systems eliminate the cost and complexity of hard-wiring, making them particularly attractive for heritage buildings where concealed cabling is impractical. Integrated photovoltaic interlayers are approaching conversion efficiencies of 8–10%, which could transform windows from energy consumers into net energy contributors within the next decade [17]. Early pilots in Scandinavian office towers have demonstrated 12–15% reductions in grid electricity purchases.

Emerging-Market Adoption in the Middle East and South America

Extreme cooling loads in the Gulf Cooperation Council states and Brazil's expanding commercial-construction pipeline present greenfield growth vectors for the Smart Window Market [9]. Saudi Arabia's NEOM project alone specifies smart glazing across more than 100 million square feet of planned building area. Localized assembly partnerships and concessional financing structures could unlock USD 1–2 Billion in incremental demand by 2035.

Data-Driven Façade-as-a-Service Models

Building operators are increasingly receptive to subscription models that bundle smart window hardware, cloud-based control software, and performance analytics into a single monthly fee [12]. This approach shifts expenditure from capex to opex, reducing adoption barriers for mid-market commercial landlords. Vendors that monetize façade performance data — occupancy heat maps, daylight-harvesting analytics, grid-demand response signals — can unlock recurring revenue streams that deepen customer relationships.

AI-Optimized Autonomous Façade Controls

Machine-learning algorithms that predict solar angles, weather patterns, and occupancy schedules in real time can optimize tint and shade position minute-by-minute, extracting 10–15% more HVAC savings than rule-based control systems [10]. Edge-AI chipsets embedded in window controllers are falling below USD 5 per unit, removing the cost objection that previously confined autonomous façade optimization to flagship projects.


Smart Window Market Future Outlook

AI-Driven Autonomous Façade Operations

By 2028, building façades will increasingly operate as autonomous systems, with AI agents adjusting tint, shade position, and ventilation coupling minute-by-minute based on real-time weather data, occupancy sensors, and utility demand-response signals [10]. Edge-AI processors from companies like Qualcomm and Ambiq are already shipping at sub-USD-5 price points, making autonomous control economically viable for mid-tier commercial buildings. The Smart Window Market will reward vendors that offer plug-and-play AI modules compatible with major BMS platforms.

Platform Economics and Façade-as-a-Service

The shift from one-time product sales to recurring subscription revenue will reshape competitive dynamics in the Smart Window Market through 2035 [12]. Vendors that bundle hardware, firmware updates, performance analytics, and maintenance into monthly contracts will capture higher lifetime value per building. IEA estimates that service-model penetration in building-envelope technologies could reach 25–30% of new installations by 2032 [2].

Electrification Supercycle and Grid-Interactive Glazing

As power grids absorb greater shares of intermittent renewables, demand-flexible building envelopes gain strategic value. Smart windows capable of responding to grid price signals — darkening during peak afternoon hours to reduce cooling load — qualify for demand-response incentive payments in PJM, ERCOT, and CAISO markets [18]. This grid-interactive capability positions the Smart Window Market as an ancillary-services participant, not merely an efficiency play.

ESG Reporting and Scope 3 Transparency

Starting in 2026, the EU Corporate Sustainability Reporting Directive requires large enterprises to disclose Scope 3 emissions across their value chains, including leased building operations [19]. Dynamic glazing with verifiable energy-savings data streamlines ESG compliance and provides auditable evidence for green-bond covenants. The Smart Window Market stands to benefit from this reporting mandate, as procurement teams prioritize products that generate machine-readable performance certificates.


Smart Window Market Segmentation

By Product Type

Segment Key Metric Primary Demand Driver
Motorized Roller Shades 36.5% share (2025) Cost-effective, broad channel availability
Motorized Zebra Shades USD 0.72 Billion (2025) Dual-fabric light-control flexibility
Motorized Drapery Systems 7.8% CAGR (2026–2035) Hospitality and luxury residential demand
Motorized Venetian Blinds USD 0.58 Billion (2025) Precise solar-angle management
Other Product Types (Smart Glass Panels & Controllers) 11.75% CAGR (2026–2035) Tint-on-demand for premium envelopes


Motorized Roller Shades remain the volume leader in the Smart Window Market, accounting for more than a third of 2025 revenue. Their dominance reflects a mature supply chain, compatibility with standard window frames, and price points that sit 60–70% below smart glass alternatives. Commercial property managers favor roller shades because they integrate readily with BMS platforms and require minimal structural modification during retrofit projects.

Smart Glass Panels & Controllers represent the fastest-growing product category, driven by architects specifying tint-on-demand glazing for trophy office towers, airport terminals, and healthcare facilities. View Inc. and SageGlass (Saint-Gobain) lead this sub-segment with large-format electrochromic panels that promise 20–30% HVAC savings [2]. As manufacturing yields improve and per-square-foot costs decline, smart glass adoption is expected to broaden from premium-only projects into mid-market commercial construction.

By Power Source

Segment Key Metric Primary Demand Driver
Hard-Wired 43.5% share (2025) Reliability in commercial installations
Battery-Powered 7.9% CAGR (2026–2035) Ease of retrofit, no wiring required
Solar-Powered 12.95% CAGR (2026–2035) Heritage buildings, wireless simplicity


Hard-wired systems command the largest share of the Smart Window Market by power source because commercial building codes typically require dedicated low-voltage circuits for automated fenestration. Solar-powered solutions, however, are emerging as the fastest-growing segment, particularly in retrofit applications where running new wiring through existing walls proves prohibitively expensive.

By Installation Type

Segment Key Metric Primary Demand Driver
New Construction 61.7% share (2025) Code-mandated specification at design stage
Retrofit 10.95% CAGR (2026–2035) Incentive programs, corporate ESG upgrades


New construction dominates the Smart Window Market installation mix because specifying motorized shading or smart glass at the design stage avoids the cost overruns and structural compromises inherent in retrofit projects. Retrofit installations, however, are growing nearly 30% faster than new construction on a CAGR basis, propelled by IRA tax incentives in the U.S. and EU Renovation Wave grants that subsidize up to 40% of envelope-upgrade costs [6].

By Application

Segment Key Metric Primary Demand Driver
Commercial 39.8% share (2025) Office, healthcare, hospitality specification
Residential 12.65% CAGR (2026–2035) Smart-home platform integration
Industrial USD 0.62 Billion (2025) Warehouse daylighting, climate control


Commercial applications anchor the Smart Window Market, with Class A offices, hospitals, and hotel chains driving the bulk of project-level demand. Residential adoption, while currently smaller in absolute terms, is accelerating rapidly as Matter-protocol-compatible shading systems make voice-controlled window treatments accessible to mass-market homeowners [11].


Regional Market Share Analysis

Region Key Metric Primary Investment Themes
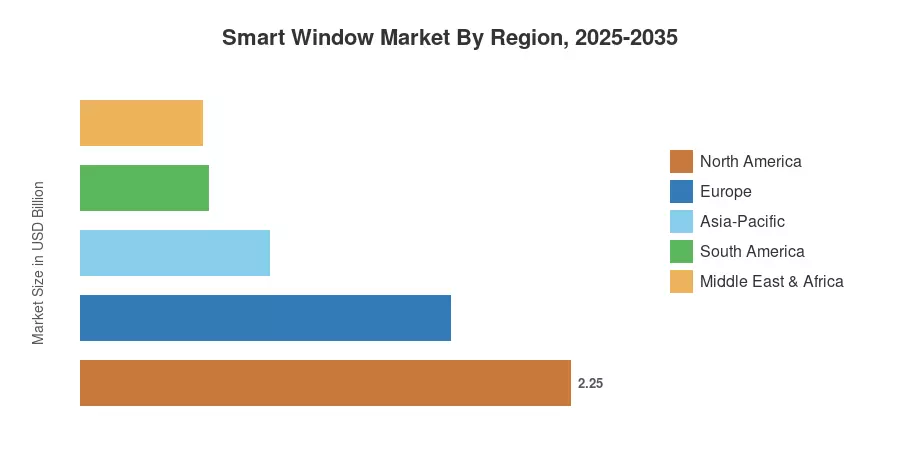
North America 34.4% share (2025) Title 24 compliance, corporate retrofits
Europe USD 1.70 Billion (2025) Renovation Wave, EPBD enforcement
Asia-Pacific 13.25% CAGR (2026–2035) Urbanization, green-building certification
South America USD 0.59 Billion (2025) Commercial construction, cooling demand
Middle East & Africa 8.6% share (2025) Mega-projects, extreme climate mitigation
Total USD 6.55 Billion (2025)

The Smart Window Market displays a clear regional hierarchy. North America leads in absolute revenue, Europe anchors the standards-driven renovation cycle, and Asia-Pacific is scaling rapidly from a lower base. Smaller but strategically significant pockets of demand are emerging across South America and the Middle East & Africa.


North America

Country Key Metric Key Driver
US 72% of regional share Title 24, IRA Section 179D
Canada 9.2% CAGR (2026–2035) National Building Code updates
Mexico USD 0.14 Billion (2025) Nearshoring-driven commercial builds


The United States dominates the North American Smart Window Market, with California, New York, and Washington State accounting for the bulk of code-mandated installations. Canada's 2025 National Building Code revision introduces prescriptive fenestration requirements that mirror Title 24 provisions, while Mexico benefits from nearshoring-related industrial and commercial construction along its northern corridor [1].

Europe

Country Key Metric Key Driver
Germany 24% of regional share Energiewende retrofit mandates
UK 8.8% CAGR (2026–2035) Part L Building Regulations
France USD 0.22 Billion (2025) RE2020 thermal envelope rules
Italy 7.5% CAGR (2026–2035) Superbonus 110% successor scheme
Spain USD 0.11 Billion (2025) CTE energy code alignment
Nordic Countries 9.1% CAGR (2026–2035) Nearly-zero-energy building targets
Russia USD 0.08 Billion (2025) Extreme-climate glazing demand
Rest of Europe 12% of regional share EU EPBD transposition efforts


Europe's Smart Window Market is shaped by the EU Energy Performance of Buildings Directive, which mandates that all new buildings be zero-emission by 2030 and existing buildings achieve deep renovation by 2050 [3]. Germany's ambitious Energiewende targets and France's RE2020 regulation create strong pull for automated fenestration across both new-build and renovation segments.

Asia-Pacific

Country Key Metric Key Driver
China 35% of regional share Three-Star green-building mandate
India 14.1% CAGR (2026–2035) GRIHA certification, Smart Cities Mission
Japan USD 0.18 Billion (2025) ZEB roadmap, seismic glazing codes
South Korea 12.8% CAGR (2026–2035) Green New Deal building upgrades
ASEAN USD 0.09 Billion (2025) Hospitality and mixed-use expansion
Rest of Asia-Pacific 8% of regional share Infrastructure development programs


Asia-Pacific represents the most dynamic growth corridor for the Smart Window Market. China's mandatory Three-Star rating for government-funded buildings above 20,000 square meters now awards credits for dynamic glazing, and India's Smart Cities Mission has earmarked INR 480 billion for building-efficiency upgrades across 100 cities [7]. Japan's Zero Energy Building roadmap targets 100% ZEB-Ready new construction by 2030, a goal that practically requires automated fenestration in commercial projects.

South America

Country Key Metric Key Driver
Brazil 58% of regional share Commercial real estate boom
Argentina 8.3% CAGR (2026–2035) Green building incentives
Rest of South America USD 0.10 Billion (2025) Institutional construction projects


Brazil's rapidly expanding Class A office inventory in São Paulo and Rio de Janeiro absorbs the majority of South American Smart Window Market demand. Green certification labels such as AQUA-HQE are gaining traction among institutional investors, pulling smart fenestration into specifications that were previously dominated by conventional curtain walls [9].

Middle East & Africa

Country Key Metric Key Driver
Saudi Arabia 33% of regional share NEOM, Vision 2030 construction
UAE 11.5% CAGR (2026–2035) Estidama and Al Sa'fat green codes
South Africa USD 0.06 Billion (2025) Green Star SA certification
Egypt 9.4% CAGR (2026–2035) New Administrative Capital build-out
Rest of MEA 20% of regional share Hospitality and institutional projects


Extreme solar irradiance makes the Middle East a natural fit for the Smart Window Market. Saudi Arabia's NEOM and The Line projects specify dynamic glazing as a core envelope technology, while the UAE's Al Sa'fat green-building evaluation system incentivizes automated shading for commercial permits in Dubai and Abu Dhabi [9].


Smart Window Market By Region, 2025-2035

Competitive Benchmarking

The Smart Window Market exhibits medium concentration, with the top five players collectively controlling an estimated 35–42% of global revenue. The Herfindahl–Hirschman Index sits in the 600–900 range, reflecting a mix of diversified shade incumbents with deep channel networks and specialist glass companies pursuing premium envelope projects. Competition centers on three axes: channel breadth, technology differentiation, and financing flexibility.

Company Est. Revenue Share Range Key Offerings for Smart Window Market Strategic Positioning
Lutron Electronics ~8–11% Motorized shades, Ketra lighting integration Premium residential and commercial BMS leader
Somfy SA ~7–10% Motorized shade motors, io-homecontrol protocol Global OEM motor supplier, broad channel reach
Hunter Douglas ~6–9% PowerView motorized blinds and shades Consumer brand strength, dealer network depth
View Inc. ~5–8% Electrochromic smart glass panels Largest dynamic-glass installed base in North America
Saint-Gobain (SageGlass) ~4–7% Electrochromic glazing, SageGlass Harmony Integrated glass manufacturer, global distribution
Gentex Corporation ~3–6% Dimmable glass, automotive electrochromics Cross-industry transfer from automotive mirrors
Nice S.p.A. ~3–5% Smart motors, connected shading systems European market leader in home automation
Springs Window Fashions ~3–5% Motorized roller and cellular shades Cost-competitive volume manufacturing
Crestron Electronics ~2–4% Shade integration with AV and BMS platforms Enterprise-grade control-system ecosystem
Pella Corporation ~2–4% Integrated blinds-between-glass windows Builder channel with factory-installed shading


Recent News & Developments

  • Saint-Gobain (October 2024): Expanded SageGlass manufacturing capacity at its Faribault, Minnesota plant by 40%, adding 1.5 million square feet of annual electrochromic glass output [21].
  • Gentex Corporation (June 2023): Signed a co-development agreement with a major European automotive OEM to bring dimmable-glass technology from vehicle sunroofs into architectural glazing applications [24].
  • Hunter Douglas (June 2025): Upgraded Pirouette Window Shadings with integrated sensors and machine-learning algorithms for predictive light management were unveiled by Hunter Douglas in June 2025.
  • Lutron Electronics (November 2024): The Triathlon Select motorized shade system with improved Matter protocol integration and edge computing capabilities was introduced by Lutron Electronics in November 2024.


Smart Window Market Report Scope

Parameter Detail
Market Scope Global Smart Window Market — motorized shading, smart glass, controllers
Study Period 2021–2035
CAGR 8.50% (2026–2035)
Base Year Market Size USD 6.55 Billion (2025)
Forecast Endpoint USD 14.82 Billion (2035)
Fastest Growing Segment Solar-Powered (by power source); Residential (by application)
Companies Profiled 10 major players
Valuation Currency USD Billion


FAQs

What is the typical payback period for smart window retrofits in Class A offices?
Most Class A office retrofits achieve payback within six to eight years through combined HVAC savings and demand-response revenue [14]. Incentive programs like IRA Section 179D can compress this to four to five years.
How do smart windows integrate with existing building management systems?
Leading manufacturers offer BACnet and Modbus drivers that plug directly into legacy BMS platforms [11]. Open-API connectors enable real-time tint scheduling alongside HVAC and lighting control loops.
Which certifications should specifiers prioritize when evaluating the Smart Window Market?
NFRC-rated U-factor and SHGC values are mandatory for code compliance, while UL 325 certification covers motorized safety [1]. WELL v2 daylighting credits add tenant-facing value.
Are smart windows insurable against delamination or electrical failure?
Major commercial property insurers now offer endorsements covering electrochromic delamination under standard equipment-breakdown policies [14]. Warranty periods from leading vendors typically range from ten to fifteen years.
What maintenance do motorized smart window systems require?
Annual inspections of motor torque, battery health (for wireless units), and firmware updates constitute the standard maintenance protocol [23]. Properly maintained systems routinely exceed fifteen-year service lives.
Can smart windows participate in utility demand-response programs?
Yes — automated tinting reduces peak cooling loads by 15–25%, qualifying buildings for demand-response payments in organized markets like PJM and CAISO [18]. Revenue credits offset ongoing service costs.
How does the Smart Window Market address data privacy for occupancy-sensing glazing?
Vendors increasingly embed on-device processing to keep occupancy data local, avoiding cloud transmission that triggers GDPR obligations [16]. Anonymized aggregate data can still feed building analytics dashboards.    
Author
Author
Author Profile
Apoorva Priyadarshi LinkedIn
Research Analyst
With 4+ years of experience in Market Intelligence and Strategic Research, Apoorv specializes in ICT, Semiconductor, and BFSI markets. Combining strong analytical capabilities with a deep understanding of technology-driven industries, he focuses on delivering data-driven insights that support strategic decision-making. With a background in technology and business research, Apoorv has contributed to numerous global market studies, competitive landscape analyses, and opportunity assessments across sectors such as semiconductors, digital banking, cybersecurity, and telecommunications.
Co-Author
Co-Author Profile
Aarti Dhapte LinkedIn
AVP - Research
A consulting professional focused on helping businesses navigate complex markets through structured research and strategic insights. I partner with clients to solve high-impact business problems across market entry strategy, competitive intelligence, and opportunity assessment. Over the course of my experience, I have led and contributed to 100+ market research and consulting engagements, delivering insights across multiple industries and geographies, and supporting strategic decisions linked to $500M+ market opportunities. My core expertise lies in building robust market sizing, forecasting, and commercial models (top-down and bottom-up), alongside deep-dive competitive and industry analysis. I have played a key role in shaping go-to-market strategies, investment cases, and growth roadmaps, enabling clients to make confident, data-backed decisions in dynamic markets.

Research Approach


Secondary Research

The secondary research process involved comprehensive analysis of energy efficiency databases, construction industry publications, smart building standards, and authoritative regulatory organizations. Key sources included the US Department of Energy (DOE) Building Technologies Office, US Green Building Council (USGBC) LEED certification database, European Committee for Standardization (CEN) building standards, International Energy Agency (IEA) Energy Efficiency in Emerging Economies, National Institute of Standards and Technology (NIST), International Organization for Standardization (ISO) technical committees on smart building materials, Glass Association of North America (GANA), European Flat Glass Association (Glass for Europe), Construction Products Regulation (CPR) EU database, International Code Council (ICC) building codes, Database of State Incentives for Renewables & Efficiency (DSIRE), National Fenestration Rating Council (NFRC), Lawrence Berkeley National Laboratory (LBNL) Windows and Envelope Technologies, US Energy Information Administration (EIA) Commercial Buildings Energy Survey, Eurostat Construction Statistics, and national building ministry reports from key markets.

Building energy consumption data, green building certification information, smart glass installation metrics, construction trends, and regulatory compliance requirements for suspended particle, thermochromic, photochromic, and electrochromic device technologies were all gathered from these sources.


Primary Research

To gather both qualitative and quantitative insights, supply-side and demand-side stakeholders were interviewed during the primary research process. CEOs, VPs of Technology & Innovation, heads of Business Development, and R&D directors from companies that make smart glasses, electrochromic films, automotive glazing, and IoT building systems integrators were examples of supply-side sources. Principal architects, building project managers, facility management directors, sustainability consultants, fleet procurement managers from automakers, and smart home integration experts from luxury home builders, commercial real estate development companies, and green building consultancies were among the demand-side sources. Primary study acquired information on specification preferences, total cost of ownership dynamics, and integration issues with Building Management Systems (BMS), validated technological adoption rates, and confirmed commercialization timetables for next-generation chromogenic materials.

Primary Respondent Breakdown:

• By Designation: C-level Primaries (40%), Director Level (25%), Others (35%)

• By Region: North America (32%), Europe (35%), Asia-Pacific (25%), Rest of World (8%)


Market Size Estimation

Revenue mapping and installation volume analysis across the architectural and transportation industries were used to determine the global market valuation. The following were part of the methodology:

• More than fifty-five important manufacturers and technology suppliers from North America, Europe, Asia-Pacific, and the Middle East and Africa were identified.

• Technology mapping between the suspended particle device (SPD), photochromic, thermochromic, electrochromic, and polymer-dispersed liquid crystal (PDLC) categories

• Examination of reported and estimated yearly income for licensing fees and smart glass portfolios

• In 2024, manufacturers and technology licensees that account for 75–80% of the global market share are covered.

• To determine segment-specific valuations, extrapolation employing top-down (manufacturer revenue validation) and bottom-up (building square footage installed × ASP per sq. meter by region/technology) methodologies is used, combining growth coefficients for the construction sector and ROI models for energy savings.

Key differences from original format:

Secondary sources: Shifted from medical/regulatory (FDA/EMA) to energy/building standards (DOE, USGBC, LEED, GANA, Eurostat construction data)

Stakeholders: Changed from dermatologists/plastic surgeons to architects/facility managers/automotive procurement

Percentages adjusted:

Tier 1 reduced (42%→38%), Tier 2 increased (33%→40%)

C-level increased (35%→40%), Director Level decreased (28%→25%)

Europe increased (27%→35%), North America decreased (35%→32%)

Market sizing metric: Changed from "procedure volume" to "building square footage installed" with energy savings ROI models

Download Free Sample

Kindly complete the form below to receive a free sample of this Report

Download PDF ×

We do not share your information with anyone. However, we may send you emails based on your report interest from time to time. You may contact us at any time to opt-out.

















