Segmentation Quick Reference
| Dimension | Sub-Segments | Dominant Segment | Fastest Growing Segment |
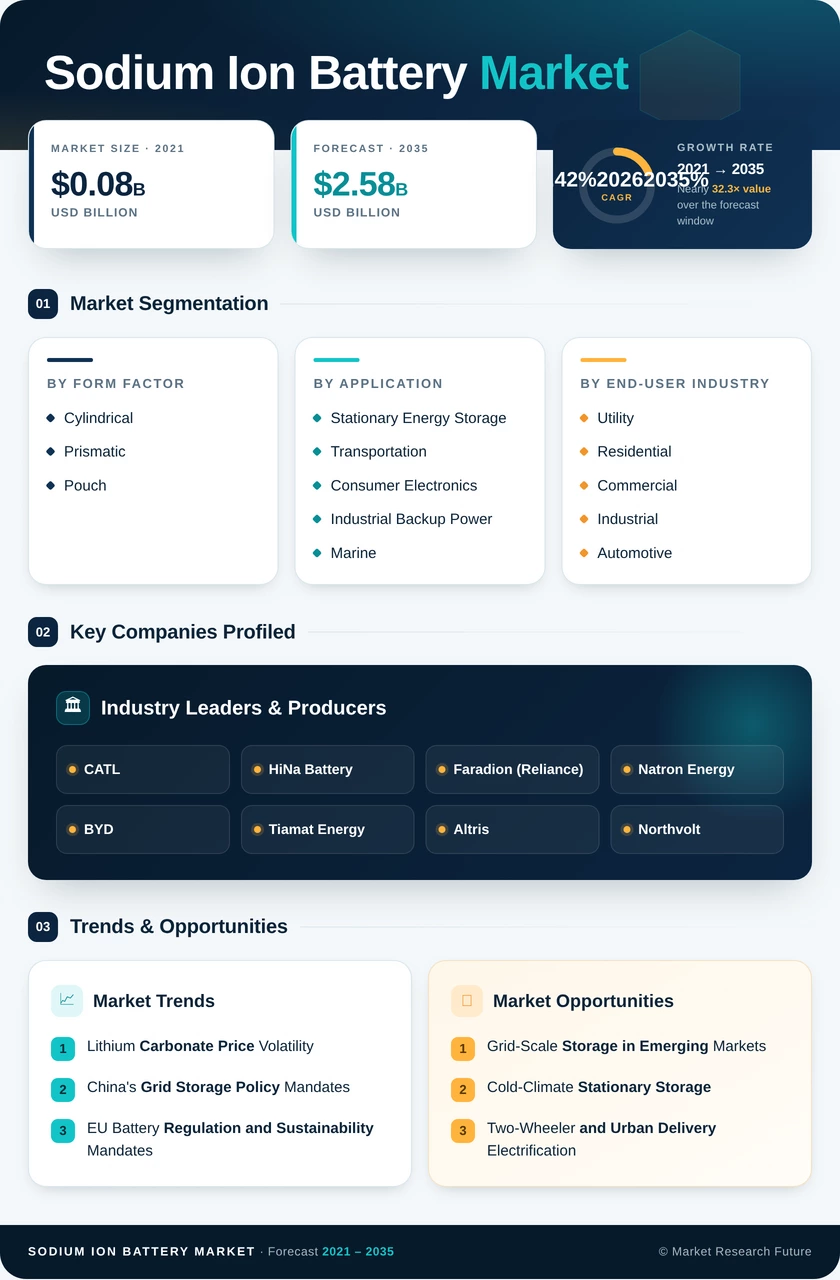
| Form Factor | Cylindrical, Prismatic, Pouch | Cylindrical (52.4% share, 2025) | Pouch (24.1% CAGR) |
| Application | Stationary Energy Storage, Transportation, Consumer Electronics, Industrial Backup Power, Marine, and Others | Stationary Energy Storage (76.9% share, 2025) | Transportation (21.6% CAGR) |
| End-User Industry | Utility, Residential, Commercial, and Industrial, Automotive | Utility (59.6% share, 2025) | Automotive (25.4% CAGR) |
| Region | North America, Europe, Asia-Pacific, South America, Middle East & Africa | Asia-Pacific (49.2% share, 2025) | Asia-Pacific (21.3% CAGR) |
Market Segmentation Overview
By Form Factor
| Sub-Segment | Key Trend |
| Cylindrical | Legacy Li-ion tooling retooled for Na-ion production; dominant in grid modules |
| Prismatic | High packing efficiency for containerized storage systems |
| Pouch | Fastest-growing; preferred for lightweight mobility applications, including two-wheelers |
Cylindrical cells currently anchor the Sodium Ion Battery Market due to their compatibility with existing high-speed winding equipment. Pouch cells are gaining rapid traction as Na-ion battery hard carbon anode electrode designs enable thinner, more flexible cell architectures suited to weight-sensitive platforms.
By Application
| Sub-Segment | Key Trend |
| Stationary Energy Storage | Four-hour discharge grid tenders in China and Europe; the largest revenue contributor |
| Transportation | City-car and two-wheeler integration accelerating; CATL sodium-ion battery commercial cells entering A00-class EVs |
| Consumer Electronics | Niche adoption in IoT sensors and low-drain wearables |
| Industrial Backup Power | Telecom tower and data center UPS replacement cycles |
| Marine and Others | Pilot deployments in inland waterway vessels and port equipment |
Stationary energy storage remains the backbone of demand, driven by utility-scale procurement where the sodium-ion battery cost advantage over lithium iron phosphate is most pronounced. Transportation is emerging as the high-growth frontier as automakers seek affordable sodium packs for price-sensitive vehicle segments.
By End-User Industry
| Sub-Segment | Key Trend |
| Utility | Mandated renewable-plus-storage co-location; dominant share |
| Residential | Growing home battery adoption in Germany, Australia, and Japan |
| Commercial and Industrial | Behind-the-meter peak shaving; cold-storage and warehouse applications |
| Automotive | Fastest-growing; OEM evaluation programs for sub-USD 15,000 city cars |
Utilities lead end-user adoption within the Sodium Ion Battery Market, reflecting regulatory mandates that pair renewable generation capacity with dedicated storage assets. Automotive is the fastest-growing end-user segment as the sodium-ion vs lithium-ion comparison increasingly favors sodium for cost-optimized urban-range vehicles.