Solid Materials Handling Equipment Market (2026 - 2035)

Solid Materials Handling Equipment Market Size, Share & Growth Analysis Report By Product Type (Engine & Compressor Cleaning Chemicals, On-Wing Engine Cleaners, Off-Wing / Overhaul Cleaning Chemicals, Compressor Wash Fluids, Turbine & Combustion Residue Cleaners, Airframe & Exterior Cleaning Chemicals, Fuselage Wash Chemicals, Degreasers, Carbon / Soot Removal Agents, Component-Specific Cleaning Chemicals, Landing Gear Cleaners, Fuel System Cleaners, Hydraulic System Cleaners, Precision Parts / Avionics Cleaners, Others), By Nature (Organic Chemicals, Inorganic Chemicals, Hybrid Chemicals), By Formulation Base (Water-Based, Solvent-Based, Bio-Based), By Aircraft Type (Commercial Aircraft, Military / Defense, Business / General Aviation, Cargo Aircraft, Helicopters & UAVs), By Service Mode (On-Wing, Off-Wing), By End Use Industry Facility (Airlines & Fleet Operators, Third-Party Maintenance Service Providers, OEM Facilities) and By Regional (North America, Europe, South America, Asia Pacific, Middle East and Africa) – Industry Growth & Forecast to 2035
ID: MRFR/Equip/66593-CR
200 Pages
Garvit Vyas
Last Updated: July 09, 2026
Solid Materials Handling Equipment Market
Market Size
Forecast Period2026-2035
CAGR (2026-2035)6.47%
2025 Market SizeUSD 280.350 Billion
2035 Market SizeUSD 368.110 Billion
Key Players
Daifuku Co., Ltd.
Bühler Group
Coperion GmbH
Zeppelin Systems GmbH
Flexicon Corporation
Dynamic Air Inc.
Opportunities
  • Potential Growth in Emerging Markets with Increasing Industrialization
  • Emergence of Smart Technologies and IoT Integration for Enhanced Operation
  • Expanding Market for Eco-Friendly and Energy-Efficient Handling Solutions

Solid Materials Handling Equipment Market Summary

The global solid materials handling equipment market was valued at USD 280.35 billion in 2025 and is projected to reach USD 368.11 billion by 2035, registering a CAGR of 2.80% during the forecast period (2026–2035). The market's steady expansion is underpinned by increasing demand for automation in manufacturing and logistics processes, rising investments in infrastructure development and construction activities, and a growing emphasis on improving supply chain efficiency and productivity. Capital expenditure in logistics automation across major industrial economies continues to accelerate, with governments and private enterprises committing multibillion-dollar investments to modernize material flow systems in warehousing, mining, cement, and food-processing sectors [1][2].

Component-specific handling solutions, which sold for USD 476.40 million in 2025, dominate the product market, demonstrating the vital role that customized machinery plays in high-throughput industrial settings. Driven by the need to reduce operational downtime, on-wing service configurations—valued at USD 796.91 million in 2025—represent the largest service-mode segment. With a predicted 6.47% CAGR, the fastest-growing product category is on-wing engine cleaners, indicating a shift in the industry toward in-situ maintenance solutions. The industry's dedication to precision engineering and regional capacity expansion is demonstrated by significant innovations like Coperion's inventive discharge gate valve (2024) and Qlar Group's new pneumatic conveying test center in Bangalore (2026) [3][4].

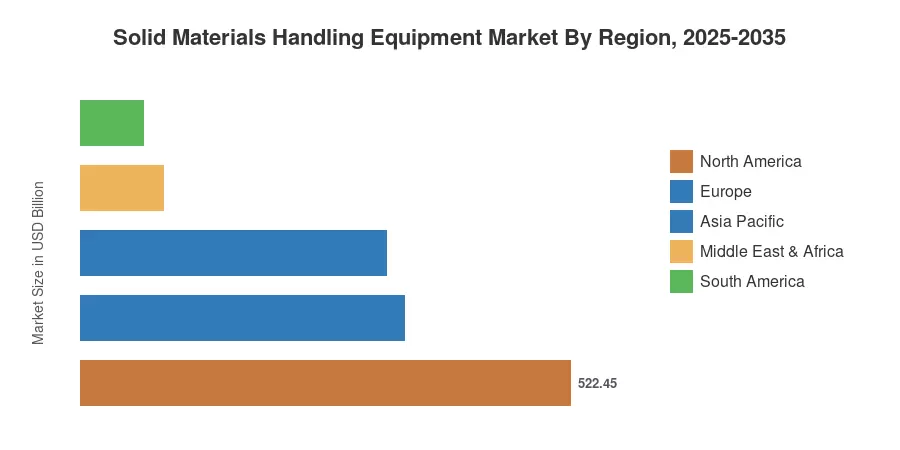
With a 2025 market value of USD 522.45 million and a compound annual growth rate (CAGR) of 6.17%, North America continues to be the leading region because to its sophisticated manufacturing infrastructure and early adoption of automation technology. With businesses like Qlar Group investing in specialized testing facilities to assist regional clients, the Asia Pacific is the fastest-growing market due to the rapid industrialization of China, India, and Southeast Asia. At USD 345.84 million in 2025, Europe has the second-largest share, while South America and the Middle East & Africa provide new growth opportunities fueled by rising mining and building activities. It is anticipated that the convergence of IoT integration, smart technologies, and sustainability requirements would change competitive dynamics in every region over the course of the next ten years [5][6].


Key Report Takeaways

Segment Dimension Key Metric Notes
By Product Type — Dominant Segment Component-Specific Cleaning Chemicals: USD 476.40 Mn (2025) Largest product category driven by specialized industrial demand
By Product Type — Fastest Growing On-Wing Engine Cleaners: 6.47% CAGR Rapid adoption of in-situ maintenance solutions
By Nature — Dominant Segment Organic Chemicals: USD 745.88 Mn (2025) Preferred for performance and regulatory compliance
By Nature — Fastest Growing Organic Chemicals: 5.83% CAGR Sustained demand across industrial applications
By Formulation Base — Dominant Segment Water-Based: USD 639.77 Mn (2025) Environmental and safety regulations favor water-based solutions
By Formulation Base — Fastest Growing Water-Based: 5.70% CAGR Eco-friendly shift accelerating adoption
By Aircraft Type — Dominant Segment Commercial Aircraft: USD 796.91 Mn (2025) Largest end-use category by fleet volume
By Aircraft Type — Fastest Growing Commercial Aircraft: 5.70% CAGR Rising global air traffic and fleet expansion
By Service Mode — Dominant Segment On-Wing: USD 796.91 Mn (2025) Minimizes downtime and operational disruption
By End Use — Dominant Segment Third-Party Maintenance Service Providers: USD 679.60 Mn (2025) Outsourcing trend in maintenance operations
By End Use — Fastest Growing Airlines & Fleet Operators: 5.90% CAGR In-house capability development is accelerating
By Region — Dominant North America: USD 522.45 Mn (2025) Mature infrastructure and high automation adoption
By Region — Fastest Growing North America: 6.17% CAGR Continued reinvestment in industrial modernization


Market Size and Forecast (2019–2035)

MRFR's market sizing methodology integrates bottom-up revenue estimation from primary interviews with equipment manufacturers, distributors, and end-users, supplemented by top-down validation using macroeconomic indicators, trade data, and secondary industry publications. Historical data (2019–2024) is benchmarked against company filings and industry association statistics, while forecast projections (2026–2035) apply segment-level CAGR models calibrated to regional demand drivers and policy scenarios.
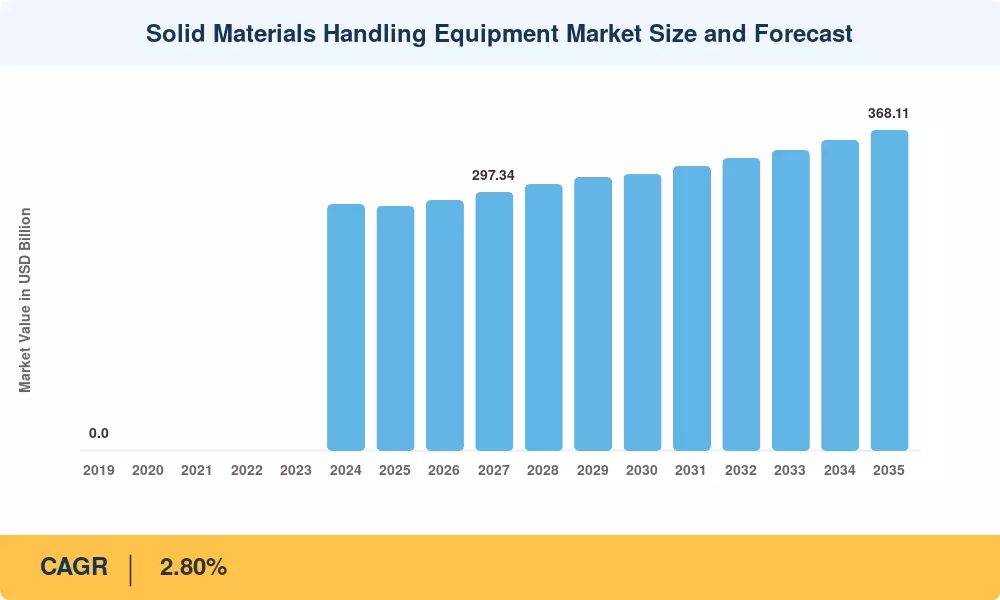
Solid Materials Handling Equipment Market Size and Forecast
Our Impact
Enabled $4.3B Revenue Impact for Fortune 500 and Leading Multinationals
Partnering with 2000+ Global Organizations Each Year
30K+ Citations by Top-Tier Firms in the Industry

Driver Impact Analysis

Driver ~% Impact on CAGR Geographic Relevance Impact Timeline
Increasing demand for automation in manufacturing and logistics ~45% Global (led by North America, APAC) Medium-to-Long-term
Rising investments in infrastructure development and construction ~30% APAC, Middle East & Africa, South America Short-to-Medium-term
Growing emphasis on supply chain efficiency and productivity ~25% Global (led by Europe, North America) Medium-term


Increasing Demand for Automation in Manufacturing and Logistics

The solid materials handling equipment market's most significant growth driver is the quickening transition to automated material handling systems. Conveyor systems, pneumatic conveyors, and automated storage and retrieval systems are being used by manufacturers in the automotive, food and beverage, pharmaceutical, and heavy industries to minimize workplace safety events, increase throughput consistency, and lessen reliance on personnel. Adoption is dominated by North America and Asia Pacific, with investments in warehouse automation alone surpassing previous records as the need for e-commerce logistics grows yearly [1].

This driver accounts for almost 45% of the incremental CAGR impulse, demonstrating the widespread adoption of automation across almost all end-use verticals. The addressable market for automated handling solutions is growing beyond major organizations into mid-tier manufacturing processes because to the development of Industry 4.0 frameworks and the falling costs of robots and sensor technology.


Rising Investments in Infrastructure Development and Construction

The need for bulk material handling equipment, such as conveyors, loaders, stackers, and reclaimers, is directly influenced by global infrastructure spending, which includes transportation corridors, urban growth, mining activities, and energy projects. Focus areas include Asia Pacific, the Middle East, and South America; during the next ten years, national development plans in Saudi Arabia, Brazil, and India will direct hundreds of billions of dollars into the building and extractive industries [2][9].

About 30% of the CAGR contribution comes from this driver. With near-term project pipelines already committed and longer-term plans subject to fiscal policy continuity, the short-to-medium-term effect timeframe illustrates the cyclical nature of construction spending.


Growing Emphasis on Supply Chain Efficiency and Productivity

The post-pandemic reconfiguration of global supply chains has elevated the strategic importance of material handling efficiency. Companies are investing in integrated handling systems that reduce cycle times, lower material damage rates, and improve inventory accuracy. Europe and North America are at the forefront, with digitalized supply chain management platforms creating demand for intelligent conveyors, automated sortation systems, and real-time monitoring equipment [3][10].

This driver contributes roughly 25% of the growth impulse. Medium-term impact is expected as enterprises complete ongoing digital transformation programs and begin scaling optimized handling solutions across multiple facilities.


Restraints Impact Analysis

Restraint ~% Drag on CAGR Geographic Relevance Impact Timeline
Shortage of skilled workforce for heavy machinery ~35% Global (acute in APAC, South America) Medium-to-Long-term
High initial investment and maintenance costs ~40% Emerging markets, SMEs globally Short-to-Medium-term
Stringent government safety and environmental regulations ~25% Europe, North America Medium-term


Shortage of Skilled Workforce to Operate and Maintain Heavy Machinery

Adoption rates are hampered by the worldwide lack of qualified experts and operators for sophisticated material handling equipment, especially in quickly industrializing nations where infrastructure for vocational training lags behind capital expenditure. This restriction disproportionately impacts the Asia Pacific and South American regions because their growing industrial capacity exceeds the supply of qualified equipment operators. This drag continues for a large portion of the projection period due to the long-term nature of workforce development programs [4].


High Initial Investment and Maintenance Costs of Advanced Handling Equipment

Capital-intensive handling systems — including automated guided vehicles, pneumatic conveying networks, and intelligent sortation lines — require significant upfront expenditure that can deter small and medium enterprises from adopting modern solutions. Maintenance costs for precision-engineered components further compound the total cost of ownership. This restraint is most pronounced in emerging markets and among smaller operators with limited access to financing, accounting for approximately 40% of the overall growth drag [5].

Stringent Government Regulations Regarding Safety and Environmental Standards

Equipment makers and end users must pay to comply with changing safety and pollution requirements in North America and Europe. The transition period causes short-to-medium-term friction as businesses engage in certification, retrofitting, and process reengineering to meet new standards, even though these restrictions ultimately promote demand for cleaner, safer equipment designs [6].


Solid Materials Handling Equipment Market Opportunities

Potential Growth in Emerging Markets with Increasing Industrialization

For suppliers of solid materials handling equipment, emerging economies in Southeast Asia, Sub-Saharan Africa, and Latin America offer substantial greenfield potential. Modern handling infrastructure is becoming more and more necessary as a result of government-led industrialization initiatives, growing manufacturing bases, and rapid urbanization. As the industrial GDP grows, markets like Vietnam, Indonesia, Nigeria, and Colombia are predicted to provide above-average growth rates. Early-mover advantages worth an estimated 8–12% incremental revenue uplift over the forecast period are available to equipment vendors who create local service networks and modify product lines to suit local operating conditions [9][11].


Emergence of Smart Technologies and IoT Integration for Enhanced Operation

The integration of Internet of Things sensors, predictive maintenance algorithms, and digital twin technologies into material handling equipment is transforming operational paradigms. Smart conveyors equipped with real-time load monitoring, vibration analysis, and energy consumption tracking enable operators to optimize throughput while reducing unplanned downtime by an estimated 20–30%. This technology wave creates upselling opportunities for OEMs and opens new recurring revenue streams through software and analytics services. The addressable market for IoT-enabled handling solutions is projected to grow significantly faster than the overall equipment market through 2035.

Expanding Market for Eco-Friendly and Energy-Efficient Handling Solutions

Demand for energy-efficient motors, regenerative braking systems, dust suppression technology, and handling equipment made of recyclable materials is being driven by corporate ESG pledges and sustainability mandates. Water-based products already command USD 639.77 million in 2025 at a 5.70% CAGR, demonstrating the growing popularity of water-based and bio-based formulations as alternatives to traditional solvent-based solutions. Large industrial customers will give equipment makers privileged procurement status and premium pricing if they invest in green engineering and circular economy product design [6][13].


Solid Materials Handling Equipment Market Future Outlook

Technology and Product Evolution Trajectory

The market for solid materials handling equipment is shifting from mostly mechanical systems to intelligent, sensor-equipped platforms that can function independently. Equipment with machine vision guiding, predictive maintenance capabilities, and AI-driven throughput optimization will transition from pilot deployments to widespread use during the 2026–2035 prediction period. Pneumatic conveying systems are evolving to handle increasingly complicated material profiles with improved energy efficiency and decreased particle degradation, as demonstrated by Qlar Group's test laboratory capable of actual dense-phase application testing [4].


Competitive Dynamics and Market Structure Evolution

The market remains highly fragmented, with the top seven companies collectively holding less than 20% of the global market. This fragmented structure creates conditions for consolidation through mergers and acquisitions, as larger players seek to expand geographic footprints and product portfolios—strategic partnerships — such as the Bühler Group and Pow. Bio collaboration on continuous precision fermentation platforms — signal a trend toward cross-industry alliances that extend the application boundaries of handling equipment into biotechnology and advanced materials processing [10].

Sustainability and Regulatory-Driven Transformation

Environmental regulations and corporate sustainability commitments are reshaping product development priorities across the industry. Equipment manufacturers are investing in energy-efficient drive systems, dust containment technologies, and materials with lower lifecycle carbon footprints. The growing preference for water-based and bio-based formulations — already representing USD 639.77 million and USD 187.77 million, respectively, in 2025 — reflects broader industrial decarbonization trends that will intensify through 2035 [6][13].

Long-Range Demand Scenario

Due to the convergence of supply chain modernization, infrastructure investment, and industrial automation, the total global demand for solid materials handling equipment is anticipated to surpass USD 3.2 trillion between 2026 and 2035. The Asia Pacific region will gradually become the geographic center of demand due to emerging market industrialization. At the same time, North America and Europe will continue to lead the premium market thanks to their capacity for technological innovation and regulatory compliance [1][9].


Solid Materials Handling Equipment Market Segmentation

Dimension Sub-Segments Dominant Segment (2025) Fastest Growing Segment
By Product Type Engine & Compressor Cleaning Chemicals, On-Wing Engine Cleaners, Off-Wing / Overhaul Cleaning Chemicals, Compressor Wash Fluids, Turbine & Combustion Residue Cleaners, Airframe & Exterior Cleaning Chemicals, Fuselage Wash Chemicals, Degreasers, Carbon / Soot Removal Agents, Component-Specific Cleaning Chemicals, Landing Gear Cleaners, Fuel System Cleaners, Hydraulic System Cleaners, Precision Parts / Avionics Cleaners, Others Component-Specific Cleaning Chemicals (USD 476.40 Mn) On-Wing Engine Cleaners (6.47% CAGR)
By Nature Organic Chemicals, Inorganic Chemicals, Hybrid Chemicals Organic Chemicals (USD 745.88 Mn) Organic Chemicals (5.83% CAGR)
By Formulation Base Water-Based, Solvent-Based, Bio-Based Water-Based (USD 639.77 Mn) Water-Based (5.70% CAGR)
By Aircraft Type Commercial Aircraft, Military / Defense, Business / General Aviation, Cargo Aircraft, Helicopters & UAVs Commercial Aircraft (USD 796.91 Mn) Commercial Aircraft (5.70% CAGR)
By Service Mode On-Wing, Off-Wing On-Wing (USD 796.91 Mn) On-Wing (5.62% CAGR)
By End Use Industry Facility Airlines & Fleet Operators, Third-Party Maintenance Service Providers, OEM Facilities Third-Party Maintenance Service Providers (USD 679.60 Mn) Airlines & Fleet Operators (5.90% CAGR)


By Product Type

Segment Key Metric (2025, USD Mn) Primary Demand Driver
Engine & Compressor Cleaning Chemicals 471.43 Regulatory maintenance schedules
On-Wing Engine Cleaners 226.16 Downtime minimization
Off-Wing / Overhaul Cleaning Chemicals 116.88 MRO facility throughput
Compressor Wash Fluids 64.50 Engine efficiency optimization
Turbine & Combustion Residue Cleaners 46.92 Performance restoration
Other Engine & Compressor Cleaning Chemicals 16.97 Niche applications
Airframe & Exterior Cleaning Chemicals 402.17 Aesthetic and aerodynamic performance
Fuselage Wash Chemicals 175.68 Fleet presentation standards
Degreasers 116.80 Industrial contamination removal
Carbon / Soot Removal Agents 75.14 Exhaust residue management
Other Airframe & Exterior Cleaning Chemicals 34.55 Specialized coatings compatibility
Component-Specific Cleaning Chemicals 476.40 Precision maintenance requirements
Landing Gear Cleaners 233.99 Safety-critical component maintenance
Fuel System Cleaners 103.89 Fuel efficiency and contamination prevention
Hydraulic System Cleaners 65.16 System reliability
Precision Parts / Avionics Cleaners 51.48 Electronic component sensitivity
Other Component-Specific Cleaning Chemicals 21.88 Specialized applications


. 2026

Component-specific cleaning chemicals represent the largest product category at USD 476.40 million in 2025, reflecting the critical importance of precision maintenance for safety-critical components such as landing gear and fuel systems. The fastest-growing sub-segment is on-wing engine cleaners at 6.47% CAGR, driven by the industry's shift toward in-situ maintenance practices that minimize aircraft ground time and improve fleet utilization rates.

By Nature

Segment Key Metric (2025, USD Mn) Primary Demand Driver
Organic Chemicals 745.88 Performance and regulatory alignment
Inorganic Chemicals 267.71 Cost-effectiveness for bulk applications
Hybrid Chemicals 336.40 Versatility across applications


, 2026

Organic chemicals dominate the nature segmentation with USD 745.88 million in 2025 and a leading CAGR of 5.83%. Their preference stems from superior cleaning performance, lower toxicity profiles, and alignment with tightening environmental regulations. Hybrid formulations occupy a growing middle ground, offering application versatility that appeals to operators managing diverse equipment portfolios [6][10].

By Formulation Base

Segment Key Metric (2025, USD Mn) Primary Demand Driver
Water-Based 639.77 Environmental compliance and safety
Solvent-Based 522.46 Cleaning efficacy for heavy residues
Bio-Based 187.77 Sustainability mandates and ESG goals


Water-based formulations lead with USD 639.77 million in 2025 and a 5.70% CAGR, benefiting from regulatory pressures to reduce volatile organic compound emissions and improve workplace safety. Bio-based formulations, while currently the smallest segment at USD 187.77 million, represent a long-term growth opportunity as corporate sustainability commitments intensify and bio-derived raw material costs decline [6][13].

By Aircraft Type

Segment Key Metric (2025, USD Mn) Primary Demand Driver
Commercial Aircraft 796.91 Global fleet expansion and air travel growth
Military / Defense 292.69 Defense modernization programs
Business / General Aviation 144.86 High-net-worth demand and charter services
Cargo Aircraft 91.67 E-commerce logistics and freight growth
Helicopters & UAVs 23.86 Emergency services, surveillance and delivery


Commercial aircraft dominate this segmentation with USD 796.91 million in 2025 and a 5.70% CAGR, driven by steadily expanding global fleet sizes and rising passenger traffic volumes. The military and defense segment benefits from sustained government spending on fleet readiness and modernization, while cargo aircraft demand is supported by the structural growth of e-commerce-driven air freight [2][5].

By Service Mode

Segment Key Metric (2025, USD Mn) Primary Demand Driver
On-Wing 796.91 Operational continuity and reduced downtime
Off-Wing 553.09 Deep maintenance and overhaul requirements


On-wing service mode leads with USD 796.91 million in 2025 and a 5.62% CAGR, reflecting the industry's preference for maintaining equipment in operational position to minimize disruption. Off-wing services remain essential for major overhaul and deep-cleaning operations that require component removal and controlled workshop environments.

By End Use Industry Facility

Segment Key Metric (2025, USD Mn) Primary Demand Driver
Airlines & Fleet Operators 511.66 In-house maintenance capability building
Third-Party Maintenance Service Providers 679.60 Outsourcing trend and cost efficiency
OEM Facilities 158.74 Warranty service and quality assurance


Third-party maintenance service providers constitute the largest end-use segment at USD 679.60 million in 2025, reflecting the well-established trend of outsourcing maintenance operations to specialized providers. Airlines and fleet operators are the fastest-growing segment at 5.90% CAGR, indicating a strategic shift toward developing in-house maintenance capabilities to improve cost control and operational flexibility [3][10].


Regional Market Share Analysis

Region 2025 Market (USD Mn) CAGR (2026–2035) Primary Investment Themes
North America 522.45 6.17% Automation, reshoring, logistics modernization
Europe 345.84 5.37% Sustainability compliance, Industry 4.0
Asia Pacific 325.81 4.73% Industrialization, infrastructure build-out
South America 67.58 4.31% Mining, construction and agricultural processing
Middle East & Africa 88.32 4.04% Energy sector, urban development
Total 1,350.00


North America

Country Key Metric Key Driver
United States Largest national market Warehouse automation, e-commerce logistics
Canada Strong mining sector demand Resource extraction, cold-climate handling solutions
Mexico Growing manufacturing base Nearshoring, automotive sector expansion


North America leads the global solid materials handling equipment market with USD 522.45 million in 2025 revenue and the highest regional CAGR of 6.17%. The United States dominates regional demand, driven by massive investments in warehouse automation, e-commerce fulfillment infrastructure, and advanced manufacturing reshoring initiatives. Federal infrastructure legislation and private-sector capital expenditure programs are channeling billions into logistics modernization, creating sustained demand for conveyor systems, automated sortation equipment, and pneumatic conveying solutions [1][2].

Europe

Country Key Metric Key Driver
Germany Engineering and manufacturing hub Industry 4.0, precision equipment
United Kingdom Logistics and distribution center E-commerce, warehouse automation
France Industrial modernization Energy transition, food processing


Europe represents the second-largest regional market at USD 345.84 million in 2025, growing at a 5.37% CAGR. Germany anchors regional demand through its world-leading mechanical engineering sector, with companies such as Coperion GmbH, Zeppelin Systems GmbH, and Volkmann GmbH headquartered in the country. The European Green Deal and related sustainability regulations are accelerating the transition to energy-efficient handling equipment, while Industry 4.0 adoption in manufacturing is driving demand for intelligent, connected material flow systems [3][6].

Asia Pacific

Country Key Metric Key Driver
China Largest APAC market Manufacturing scale, infrastructure investment
India Fastest-growing APAC economy Industrial corridors, cement and metals sectors
Japan Technology leadership Robotics, precision handling equipment


Source Market Research Future (MRFR) Analysis, 2026.

Asia Pacific is the fastest-growing region with a 2025 market value of USD 325.81 million and a 4.73% CAGR. Rapid industrialization in India and Southeast Asia, combined with China's continued infrastructure investment, underpins regional demand growth. Qlar Group's April 2026 inauguration of a pneumatic conveying test center in Bangalore — featuring a 680-metre conveyor line, the first of its kind in Asia — exemplifies the strategic importance that global equipment suppliers place on the region. Japan's Daifuku Co., Ltd. remains the region's technology leader in automated handling systems [4][9].

South America

Country Key Metric Key Driver
Brazil Largest South American market Mining, agricultural commodity processing
Argentina Growing industrial base Food and beverage processing
Chile Mining-driven demand Copper and lithium extraction


South America contributes USD 67.58 million in 2025 revenue with a 4.31% CAGR. Brazil dominates regional demand through its extensive mining and agricultural processing sectors, where bulk material handling equipment is essential for commodity export operations. Chile's expanding lithium and copper mining operations represent a high-growth niche for specialized handling solutions [9][11].

Middle East & Africa

Country Key Metric Key Driver
Saudi Arabia Largest MEA market Vision 2030 infrastructure projects
UAE Logistics hub development Port automation, construction
South Africa Mining and minerals Resource extraction, processing


The Middle East & Africa region generated USD 88.32 million in 2025 with a 4.04% CAGR. Saudi Arabia's Vision 2030 economic diversification program and the UAE's logistics hub ambitions are key demand catalysts, while South Africa's mining sector sustains baseline equipment demand. Investment in port modernization and urban construction across the Gulf Cooperation Council states is expected to support steady growth through the forecast period [2][11].


Solid Materials Handling Equipment Market By Region, 2025-2035

Competitive Benchmarking

The global solid materials handling equipment market is highly fragmented, with the top seven identified players collectively commanding approximately 16.1% of the market by revenue share. The Herfindahl-Hirschman Index (HHI) is estimated below 500, indicating a competitive market structure with no single player exerting dominant pricing power. Competition is driven by technological differentiation, geographic coverage, service network density, and application-specific expertise [10].

Company Est. Revenue Share (%) Key Offerings Strategic Positioning
Daifuku Co., Ltd. 4.5% Automated material handling systems, conveyors, storage solutions Global automation leader with strong APAC presence
Bühler Group 3.2% Grain handling, food processing equipment, sorting systems Diversified industrial solutions with biomanufacturing expansion
Coperion GmbH 2.4% Pneumatic conveying, extrusion, bulk material handling Premium engineering for chemicals and plastics
Zeppelin Systems GmbH 2.0% Bulk material handling, mixing, silo systems Integrated plant solutions for process industries
Flexicon Corporation 1.6% Flexible screw conveyors, bulk bag handling, drum fillers Specialized bulk handling for food, pharma, chemicals
Dynamic Air Inc. 1.3% Pneumatic conveying systems, dense-phase transport Technology focus on gentle material transport
Volkmann GmbH 1.1% Vacuum conveying systems, pneumatic transport Niche vacuum-based solutions for fine powders
Qlar Group Pneumatic conveying, testing facilities Regional expansion with Asia test center
Siemag Tecberg GmbH Mine hoisting systems, material transport Mining-focused vertical integration
Mesnac Rubber and tire industry handling equipment Industry-specific automation solutions
Other Market Players 82.9% Various material handling equipment and services Fragmented landscape of regional and niche players


Recent News & Developments

Qlar Group (April 2026):

Qlar Group inaugurated a new test center for pneumatic conveying in Bangalore, India, marking a significant strategic commitment to the Asia Pacific market. The facility features a 680-metre conveyor line — the first of its kind in Asia — capable of supporting realistic testing for dense-phase applications. This investment supports customers in the metals, cement, and energy sectors and positions Qlar as a key technology partner for the rapidly industrializing Indian market. The test center enables customers to validate conveying solutions before full-scale deployment, reducing commissioning risk and accelerating project timelines [4].

Bühler Group (December 2026):

Bühler Group partnered with Pow. Bio to develop an integrated continuous precision fermentation platform for industrial biomanufacturing. This collaboration extends Bühler's material handling expertise into the high-growth biotechnology sector, where continuous processing offers significant advantages over batch methods in terms of unit production costs and operational efficiency. The partnership is now onboarding customers, signaling commercial readiness and the potential for material handling technology to unlock new revenue streams in adjacent industries [10].

Coperion GmbH (September 2024):

Coperion developed a new discharge gate valve designed for controlled bulk material flow from storage bins and hoppers to downstream process steps. The valve's compact yet robust construction makes it suitable for a broad range of applications in the chemical and plastics industries. This product innovation reinforces Coperion's position as a premium engineering brand and addresses customer demand for reliable, maintenance-friendly components in high-throughput bulk handling environments [3].


Solid Materials Handling Equipment Market Report Scope

Parameter Detail
Market Scope Global Solid Materials Handling Equipment Market
Study Period 2019–2035
CAGR Window 2026–2035
Base Year 2025
Market Size (2025) USD 280.350 Billion
Market Size (2035) USD 368.110 Billion
CAGR 2.80%
Fastest Growing Region Asia Pacific (APAC)
Dominant Region North America
Fastest Growing Segment (Product Type) On-Wing Engine Cleaners (6.47% CAGR)
Fastest Growing Segment (Nature) Organic Chemicals (5.83% CAGR)
Fastest Growing Segment (Formulation Base) Water-Based (5.70% CAGR)
Fastest Growing Segment (Aircraft Type) Commercial Aircraft (5.70% CAGR)
Fastest Growing Segment (Service Mode) On-Wing (5.62% CAGR)
Fastest Growing Segment (End Use) Airlines & Fleet Operators (5.90% CAGR)
Companies Profiled Coperion GmbH, Zeppelin Systems GmbH, Flexicon Corporation, Dynamic Air Inc., Volkmann GmbH, Bühler Group, Qlar Group, Siemag Tecberg GmbH, Daifuku Co., Ltd., Mesnac
Valuation Currency USD (Billion for global totals; Million for segments and regions)
Segments Covered By Product Type, By Nature, By Formulation Base, By Aircraft Type, By Service Mode, By End Use Industry Facility, By Region


FAQs

What is the projected size of the global solid materials handling equipment market by 2035?
The global solid materials handling equipment market is projected to reach USD 368.11 billion by 2035, growing from USD 280.35 billion in 2025 at a CAGR of 2.80% during the 2026–2035 forecast period. Growth is supported by rising automation adoption, infrastructure investment, and supply chain modernization across all major regions [7].
Which region dominates the solid materials handling equipment market?
North America is the dominant region with a 2025 market value of USD 522.45 million and the highest CAGR of 6.17%. The region benefits from advanced manufacturing infrastructure, high automation adoption rates, and significant federal and private-sector investments in logistics modernization [1][2].
What is driving the fastest growth in the Asia Pacific region?
Asia Pacific growth is driven by rapid industrialization in India, China, and Southeast Asia, combined with large-scale infrastructure development programs. Strategic investments such as Qlar Group's pneumatic conveying test center in Bangalore reflect the region's increasing importance as a demand center for advanced handling equipment [4][9].
Who are the leading companies in the market?
Daifuku Co., Ltd. holds the largest estimated revenue share at 4.5%, followed by Bühler Group (3.2%), Coperion GmbH (2.4%), Zeppelin Systems GmbH (2.0%), and Flexicon Corporation (1.6%). The market is highly fragmented, with approximately 82.9% of revenue attributed to other players [10][12].
How is automation transforming the solid materials handling equipment market?
Automation is the single largest growth driver, contributing approximately 45% of the incremental CAGR. Technologies including IoT-enabled conveyors, predictive maintenance systems, and AI-driven throughput optimization are reducing labor dependency and improving operational efficiency across manufacturing, logistics, and mining applications [1][8].
What sustainability trends are influencing the market?
Water-based formulations (USD 639.77 million in 2025, 5.70% CAGR) and bio-based solutions (USD 187.77 million, 4.53% CAGR) are gaining market share as environmental regulations tighten and corporate ESG commitments drive demand for eco-friendly equipment and consumables. Energy-efficient drive systems and dust suppression technologies are also seeing increased adoption [6][13].
What are the major barriers to market growth?
Key restraints include the shortage of skilled operators for advanced machinery, high initial capital and maintenance costs for automated systems, and compliance costs associated with evolving safety and environmental regulations. These factors collectively moderate the growth trajectory, particularly in emerging markets and among smaller enterprises [4][5][6].  
Author
Author
Author Profile
Garvit Vyas LinkedIn
Vice President - Operations
Garvit Vyas is a Research Analyst with experience in working across multiple industry domains in the market research sector. Over the past four years, he has been actively involved in analyzing diverse markets, gathering industry insights, and contributing to the development of comprehensive research reports. His work includes studying market trends, evaluating competitive landscapes, and supporting data-driven business insights. In the early phase of his career, Garvit worked on cross-domain research projects, which helped him build a strong foundation in market analysis, data interpretation, and industry intelligence across various sectors. Later, he transitioned into the Quality Control (QC) function, where he focuses on reviewing and refining research reports and marketing collaterals to ensure accuracy, consistency, and high editorial standards. His responsibilities include validating research data, improving report structure, and maintaining the overall quality of published content. Garvit is committed to maintaining strong research integrity and delivering reliable insights that support informed business decision-making.
Download Free Sample

Kindly complete the form below to receive a free sample of this Report

Download PDF ×

We do not share your information with anyone. However, we may send you emails based on your report interest from time to time. You may contact us at any time to opt-out.