South America Graph Database Market
South America Graph Database Market Research Report By Application (Social Networking, Fraud Detection, Recommendation Engines, Network and IT Operations, Knowledge Graphs), By Deployment Type (Cloud-Based, On-Premises, Hybrid), By Database Model (Property Graph, Resource Description Framework, Hypergraph), By End Use (BFSI, Healthcare, Telecommunications, Retail, Government) and By Regional (Brazil, Mexico, Argentina, Rest of South America)- Forecast to 2035
Market Segment Insights
South America Graph Database Market Segment Insights
Graph Database Market Application Insights
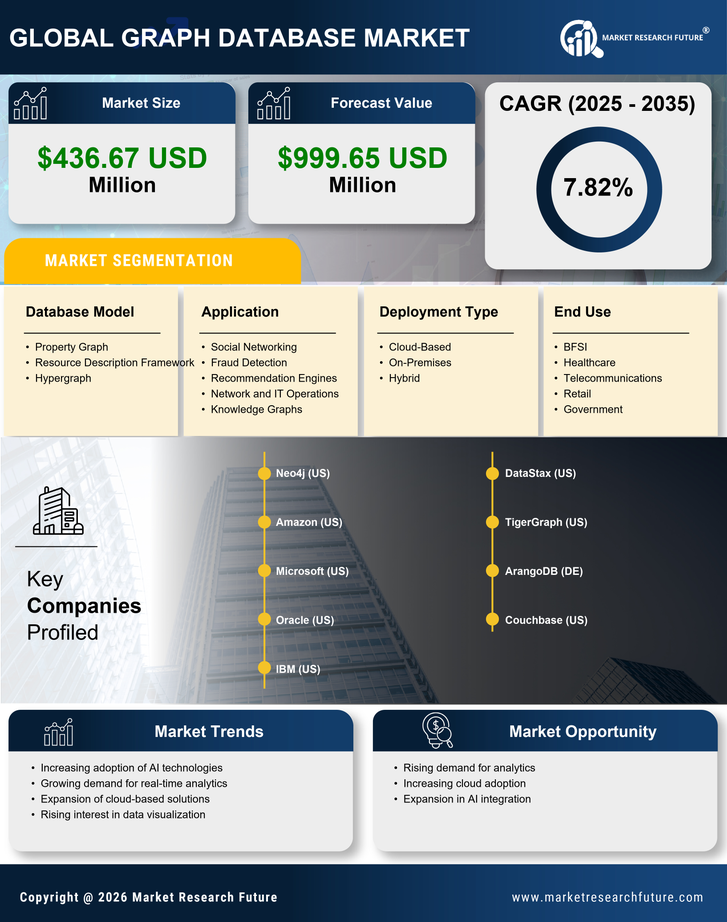
The South America Graph Database Market is witnessing a notable shift towards various applications that leverage the unique capabilities of graph databases. In the realm of Social Networking, these databases facilitate dynamic interactions and connections among users, enabling platforms to enhance user engagement and personalization. The Fraud Detection application is significant in this region, as organizations utilize graph databases to identify unusual patterns and relationships that could indicate fraudulent activities, which is crucial given the rise of cyber threats in South America.Recommendation Engines benefit from the versatility of graph databases to analyze user behavior and preferences, delivering tailored recommendations that enhance customer satisfaction and drive sales.
Network and IT Operations utilize graph databases to streamline data management and networking complexities, thus improving operational efficiency and resource allocation, which is essential in a region that is rapidly digitizing. Furthermore, Knowledge Graphs play a critical role by aggregating and contextualizing information, allowing businesses to harness the power of their data for better decision-making and innovation.
The segmentation of the South America Graph Database Market into these applications underscores the growing reliance on advanced data management technologies, as businesses seek to optimize operations, enhance customer experiences, and address emerging challenges across various sectors. This increasing adoption and integration of graph databases indicate a robust market trajectory, fueled by a demand for innovative data solutions that can handle the complexities of modern data interactions.

Graph Database Market Deployment Type Insights
The South America Graph Database Market is significantly influenced by its Deployment Type, which plays a crucial role in catering to diverse user requirements. The market is categorized primarily into Cloud-Based, On-Premises, and Hybrid options, each providing distinct advantages that meet varying business needs. Cloud-Based deployment is gaining traction due to its flexible infrastructure, scalability, and cost-effectiveness, enabling organizations to rapidly adapt to fluctuating workloads and demanding data requirements.
On-Premises solutions offer enhanced control and security, appealing to industries with strict data governance and compliance regulations.The Hybrid model combines the benefits of both cloud and on-premises setups, providing the flexibility to manage sensitive data locally while taking advantage of cloud resources for less critical tasks. As businesses in South America increasingly embrace digital transformation, the demand for diverse deployment methods is expected to grow, driven by the need for more efficient data management and analysis strategies. This evolution reflects broader trends in technology and data utilization across the region, where organizations are leveraging graph databases for applications such as social networking, recommendation engines, and fraud detection.
Graph Database Market Database Model Insights
The South America Graph Database Market has gained significant traction, particularly within the Database Model segment, which encompasses various frameworks like Property Graph, Resource Description Framework, and Hypergraph. Graph databases have become increasingly important due to their ability to efficiently handle complex relationships between data points, a necessity for sectors such as finance, telecommunication, and logistics in South America. The Property Graph model, known for its flexibility in representing diverse relationships and properties, caters to applications that require intricate data connections.
In contrast, the Resource Description Framework (RDF) excels in semantic data management and has become essential for organizations focusing on Linked Data and interoperability between different data systems, particularly in government and educational sectors. Meanwhile, Hypergraph models offer advanced capabilities for representing higher-order relationships, making them significant in research and complex systems analysis. The growing emphasis on big data analytics and real-time processing further propels the adoption of these database models within the South American region, as organizations increasingly seek solutions that provide insights through interconnected data structures.With various industries in South America recognizing the importance of data-driven decision-making, the demand for innovative graph database solutions is expected to continue to rise.
Graph Database Market End Use Insights
The South America Graph Database Market is seeing significant traction across various sectors, particularly within the End Use segment. The BFSI sector is increasingly adopting graph databases to enhance fraud detection, risk management, and customer relationship management, utilizing the interconnectivity of data. In the Healthcare industry, the ability to manage complex patient data and facilitate medical research through data relationship mapping makes graph databases essential for improved patient outcomes and operational efficiencies. Telecommunications firms leverage these databases for network management and optimizing service delivery, benefiting from real-time insights into customer behavior and network performance.
Retailers utilize graph databases to personalize consumer experiences and optimize inventory management, responding to market trends and consumer preferences swiftly. Additionally, the Government sector employs graph databases for enhancing public safety, crime analysis, and streamlining public service operations through better data integration. These sectors collectively reflect the South America Graph Database Market's capacity for growth, driven by the demand for data-driven decision-making and complexity management across diverse applications.The continuous evolution of technology and increasing digital transformation among these sectors underline the significance of this market segment in shaping data strategies.
Report Scope
| Report Attribute/Metric Source: | Details |
| MARKET SIZE 2023 | 324.0(USD Million) |
| MARKET SIZE 2024 | 350.0(USD Million) |
| MARKET SIZE 2035 | 800.0(USD Million) |
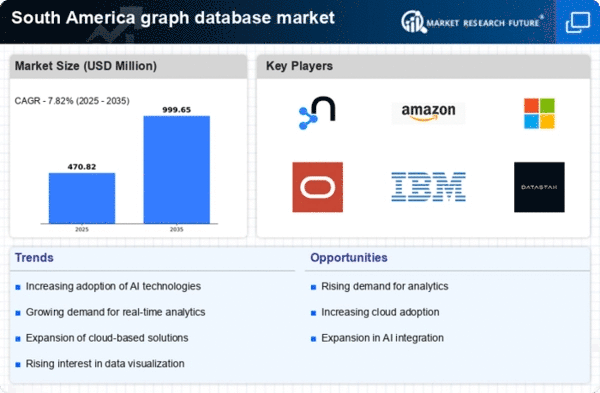
| COMPOUND ANNUAL GROWTH RATE (CAGR) | 7.805% (2025 - 2035) |
| REPORT COVERAGE | Revenue Forecast, Competitive Landscape, Growth Factors, and Trends |
| BASE YEAR | 2024 |
| MARKET FORECAST PERIOD | 2025 - 2035 |
| HISTORICAL DATA | 2019 - 2024 |
| MARKET FORECAST UNITS | USD Million |
| KEY COMPANIES PROFILED | Oracle, TigerGraph, Redis, Cytoscape, ArangoDB, Abertis, SAP, Graphistry, Bloomreach, IBM, DataStax, Neo4j, Microsoft, Amazon Web Services |
| SEGMENTS COVERED | Application, Deployment Type, Database Model, End Use, Regional |
| KEY MARKET OPPORTUNITIES | Growing demand for real-time analytics, Increasing adoption of IoT technologies, Expansion in e-commerce analytics, Rise of social network analysis, Enhanced data integration capabilities |
| KEY MARKET DYNAMICS | Rapid data growth, Increasing cloud adoption, Rise in AI applications, Enhanced data relationships, Demand for real-time analytics |
| COUNTRIES COVERED | Brazil, Mexico, Argentina, Rest of South America |
FAQs
What is the expected market size of the South America Graph Database Market in 2024?
In 2024, the South America Graph Database Market is expected to be valued at 350.0 million USD.
What will be the expected market value in 2035?
The market is anticipated to reach a value of 800.0 million USD by 2035.
What is the projected CAGR for the South America Graph Database Market from 2025 to 2035?
The expected CAGR for the market from 2025 to 2035 is 7.805%.
Which country is expected to hold the largest share of the market in 2024?
Brazil is projected to have the largest market share in 2024, valued at 140.0 million USD.
What market size is attributed to social networking applications in 2024?
The social networking application segment is expected to be valued at 105.0 million USD in 2024.
What is the market size for fraud detection applications in 2035?
By 2035, the fraud detection application segment is expected to be valued at 150.0 million USD.
What are the key players in the South America Graph Database Market?
Major players in the market include Oracle, Neo4j, IBM, Microsoft, and Amazon Web Services.
What is the market size attributed to Mexico in 2035?
In 2035, the market size for Mexico is expected to reach 160.0 million USD.
What is the expected market value for recommendation engines in 2025?
The recommendation engines segment is anticipated to be valued significantly in 2025, building towards 130.0 million USD by 2035.
How much is the Rest of South America segment valued at in 2024?
The Rest of South America segment is expected to be valued at 90.0 million USD in 2024.
Kindly complete the form below to receive a free sample of this Report
Customer Stories
“This is really good guys. Excellent work on a tight deadline. I will continue to use you going forward and recommend you to others. Nice job”
“Thanks. It’s been a pleasure working with you, please use me as reference with any other Intel employees.”
“Thanks for sending the report it gives us a good global view of the Betaïne market.”
“Thank you, this will be very helpful for OQS.”
“We found the report very insightful! we found your research firm very helpful. I'm sending this email to secure our future business.”
“I am very pleased with how market segments have been defined in a relevant way for my purposes (such as "Portable Freezers & refrigerators" and "last-mile"). In general the report is well structured. Thanks very much for your efforts.”
“I have been reading the first document or the study, ,the Global HVAC and FP market report 2021 till 2026. Must say, good info! I have not gone in depth at all parts, but got a good indication of the data inside!”
“We got the report in time, we really thank you for your support in this process. I also thank to all of your team as they did a great job.”
Leave a Comment