Specialty Fertilizers Market (2026 - 2035)

Specialty Fertilizers Market Size, Share, Industry Trend & Analysis information By Specialty Type (Liquid Fertilizers, Controlled-Release Fertilizers, Slow-Release Fertilizers, Water-Soluble Fertilizers, Micronutrients), By Application Mode (Fertigation, Foliar, Soil), By Crop Type (Horticultural Crops, Field Crops, Turf & Ornamental), By Region (Asia-Pacific, Europe, North America, South America, Middle East & Africa) - Forecast till 2035

Forecast Period
2026-2035
CAGR
5.80%
2025 Market Size
USD 27.12 Billion
2035 Market Size
USD 47.77 Billion
Agriculture ● Updated July 2026 Report ID: MRFR/Agri/3838-HCR | Pages: 110 | Author: Snehal Singh, Tejas Chaudhary

Specialty Fertilizers Market Summary

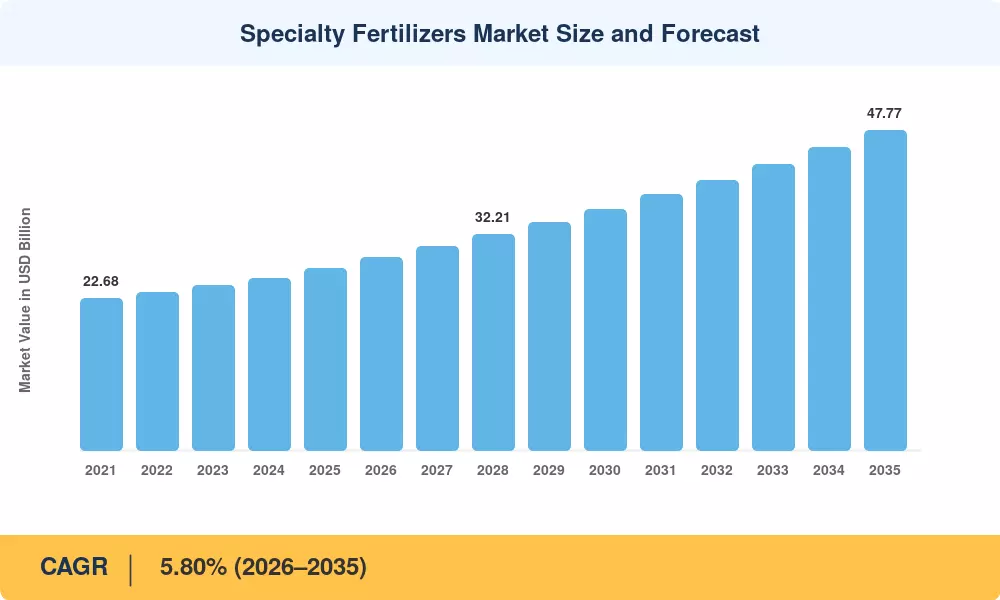
The Specialty Fertilizers Market was valued at USD 27.12 Billion in 2025, with the forecast period opening at USD 28.75 Billion in 2026 and projected to reach USD 47.77 Billion by 2035 at a CAGR of 5.80% during 2026–2035. Two catalysts anchor this trajectory: national nutrient-use-efficiency mandates — such as China's Zero-Growth Fertilizer Action Plan and India's revamped Nutrient-Based Subsidy regime — and rising private-sector investment in precision fertigation infrastructure, which exceeded USD 2.1 billion globally in 2024 [#9, #10]. Growers are no longer treating specialty grades as premium luxuries; they are treating them as operational necessities in water-scarce and carbon-conscious production systems.

A technical change is changing the way that nutrients go to the plant. Commodity granules are being displaced by sensor-guided, variable-rate fertigation systems that broadcast liquid and controlled-release nourishment zone-by-zone. BloombergNEF projects that green-ammonia capacity under construction will exceed 6 million metric tons by 2028, making low-carbon nitrogen a compliance-ready feedstock for the Specialty Fertilizers Market [12]. In lawn management, greenhouse production and high-value horticulture, polymer-coated granules are replacing split-application urea regimens.


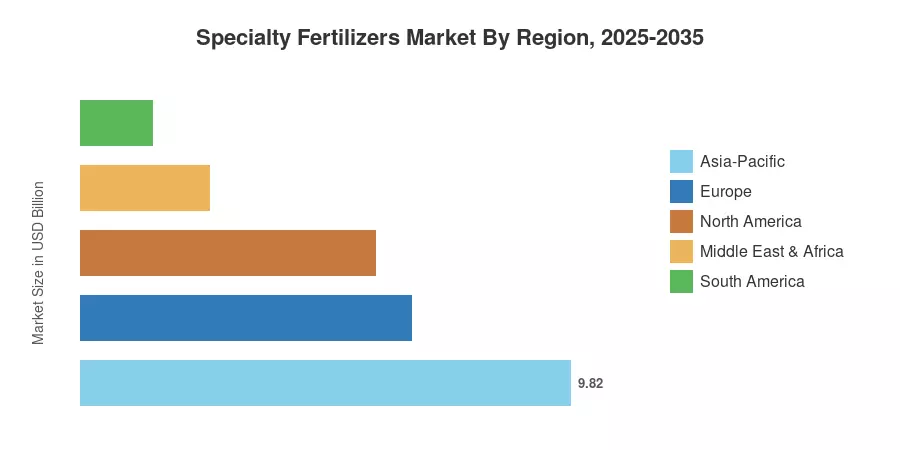
Asia-Pacific holds 36.2% of the worldwide revenue with intensive rice-vegetable rotations and increasing usage of fertigation in India and Southeast Asia. The Middle East & Africa geography is the fastest expanding, growing at a CAGR of 9.5% through 2035 as Gulf-state agri-tech projects channel investments into arid greenhouse complexes. Europe has the second-largest proportion of 24.5%, supported by the EU Fertilising Products Regulation, which reduces the cadmium limits and promotes specialist alternatives. The Specialty Fertilizers Market is at a structural inflection point, when regulatory pressure and digital agronomy are merging to expedite the mainstream adoption.


Key Report Takeaways

• By Specialty Type

  • Liquid fertilizers captured 35.8% of the Specialty Fertilizers Market in 2025, reflecting fertigation compatibility and lower labor requirements.
  • Controlled-release fertilizers are forecast as the fastest-growing specialty type, registering a CAGR of 9.5% during 2026–2035.

• By Application Mode

  • Fertigation accounted for 44.5% of global application demand in 2025, led by drip-irrigation expansions across arid and semi-arid regions.
  • Foliar application is projected to grow at a CAGR of 6.4% through 2035, driven by micronutrient-correction programs.

• By Crop Type

  • Horticultural crops represented 39.8% of the Specialty Fertilizers Market in 2025 as the largest crop segment.
  • Turf and ornamental crops are the fastest-growing crop segment, expanding at a CAGR of 8.5% during 2026–2035.

• By Geography

  • Asia-Pacific held 36.2% of global revenue in 2025, led by China, India, and ASEAN economies.
  • The Middle East & Africa are anticipated to record the fastest regional growth at a CAGR of 9.5% through 2035.


Specialty Fertilizers Market Size and Forecast (2021–2035)

Market Research Future’s (MRFR) estimations are based on primary interviews with agrochemical manufacturers, distributor channel surveys, customs trade data, and cross-validation against FAO and IFA fertilizer-use databases. Historical statistics (2021-2024) are actual trade volumes; 2025 is the base-year estimate, and 2026-2035 figures are anticipated projections with a blended CAGR of 5.80%.
Specialty Fertilizers Market Size and Forecast
Our Impact
Enabled $4.3B Revenue Impact for Fortune 500 and Leading Multinationals
Partnering with 2000+ Global Organizations Each Year
30K+ Citations by Top-Tier Firms in the Industry

Driver Impact Analysis

Driver ~% Impact on CAGR Geographic Relevance Impact Timeline
Fertigation infrastructure expansion +1.4% Asia-Pacific, Middle East Short-term (≤2 yr)
Controlled-release technology adoption +1.1% North America, Europe Medium-term (2–4 yr)
National nutrient-efficiency mandates +0.9% China, India, the EU Short-term (≤2 yr)
Digital agronomy & variable-rate prescriptions +0.7% North America, APAC Medium-term (2–4 yr)
Green-ammonia & low-carbon nitrogen +0.6% Europe, the Middle East Long-term (≥4 yr)
Carbon-credit integration +0.5% Global Long-term (≥4 yr)
Urbanization-driven turf & ornamental demand +0.4% North America, Europe Medium-term (2–4 yr)


Fertigation Infrastructure Expansion

Drip- and sprinkler-based fertigation reduces water usage by 30–50% compared to traditional flood irrigation, serving as a critical adaptation strategy for water-stressed regions, particularly in South Asia and the Gulf Cooperation Council (GCC) states. India's Pradhan Mantri Krishi Sinchayee Yojana (PMKSY) has been a primary driver of this transition, with central assistance for micro-irrigation reaching approximately USD 2.6 billion since 2015. This sustained investment continues to expand the addressable market for liquid, high-solubility specialty fertilizer formulations, as each additional hectare brought under micro-irrigation creates a new, recurring revenue stream for the specialty plant nutrition sector.


Controlled-Release Technology Adoption

Controlled-release fertilizers (CRFs), such as polymer-coated urea, allow for synchronized nutrient release with crop uptake, effectively reducing the frequency of in-season applications. Research supported by institutions like ICRISAT emphasizes that optimizing nitrogen release can significantly improve nutrient-use efficiency (NUE) in semi-arid environments. These performance gains—driven by reduced volatilization and leaching—have led to increased commercial adoption, with many professional growers proving willing to pay a 25–40% price premium for advanced coating technologies that ensure consistent yield outcomes.


National Nutrient-Efficiency Mandates

China’s regulatory environment has transitioned from its previous "Zero Growth" initiative toward a more comprehensive strategy focused on "High-Efficiency Fertilizer" adoption through 2030. Provincial procurement is increasingly favoring specialized, slow-release, and organic-enhanced blends to minimize environmental runoff. Meanwhile, in the European Union, the Fertilising Products Regulation (EU) 2019/1009 mandates strict heavy metal thresholds, establishing a maximum cadmium limit of 60 mg/kg P₂O₅. This regulation is effectively accelerating the shift away from conventional, high-cadmium phosphate sources toward purified, micronutrient-enriched alternatives that comply with the EU’s stringent "green" standards.


Digital Agronomy Platforms

Cloud-based soil-mapping and digital agronomy tools are now essential for modern precision agriculture, enabling the generation of site-specific nutrient prescriptions. These platforms pair seamlessly with variable-rate fertigation controllers to automate precise dosage based on real-time soil data. While industry estimates for specific yield gains vary, the global trend toward digital adoption—particularly in large-scale soybean and corn markets—is significantly reducing over-application and waste, marking a shift toward data-driven, sustainable crop management.


Restraints Impact Analysis

Restraint ~% Impact on CAGR Geographic Relevance Impact Timeline
Input-cost volatility (raw materials & energy) –0.8% Global Short-term (≤2 yr)
Heavy-metal contamination limits –0.5% Europe, East Asia Medium-term (2–4 yr)
Limited extension-service reach in smallholder markets –0.4% Sub-Saharan Africa, South Asia Long-term (≥4 yr)
Price premium resistance among commodity-crop growers –0.3% South America, ASEAN Medium-term (2–4 yr)
Regulatory fragmentation across national standards –0.3% Global Long-term (≥4 yr)


Input-Cost Volatility

Natural-gas prices feed directly into ammonia and urea production costs, and the 2022–2023 energy shock pushed specialty-grade price indices up by 22–28% in European markets [8]. Phosphate rock price swings add further unpredictability for producers of enriched water-soluble plant food grades. Manufacturers with integrated feedstock operations absorb these shocks more easily, but mid-sized formulators face margin compression that limits R&D reinvestment.

Heavy-Metal Contamination Limits

Stricter cadmium and arsenic thresholds are forcing phosphate-based specialty producers to either source from low-contaminant deposits — concentrated in Finland and Russia — or invest in decadmiation processing that can add USD 15–25 per metric ton to production costs [13]. Compliance creates a competitive moat for producers with access to clean ore, but it also constrains supply growth in regions dependent on North African phosphate.

Smallholder Extension-Service Gaps

Specialty fertilizers require precise application guidance that many smallholder farmers in sub-Saharan Africa and South Asia lack access to. FAO data indicate that extension-agent-to-farmer ratios exceed 1:3,000 in several East African nations, making product misuse and economic waste significant adoption barriers [1].


Specialty Fertilizers Market Opportunities

Desert Greenhouse Complexes in the Gulf States

Saudi Arabia's National Water Strategy and the UAE's Food Security Strategy 2051 are catalyzing multi-billion-dollar investments in climate-controlled greenhouse agriculture. These facilities are purpose-built for fertigation and controlled-release programs, creating a high-density demand node for the Specialty Fertilizers Market.

Data-Driven Nutrient Advisory as a Service

Agronomy platforms that bundle soil diagnostics, satellite imagery, and prescription-grade fertilizer recommendations are shifting specialty suppliers from product vendors to service partners. Subscription advisory models generate recurring revenue and deepen customer retention — a business-model pivot already visible in Yara's AtFarm and Nutrien's Digital Hub.

Low-Carbon Nitrogen Procurement

Green-ammonia production powered by renewable electricity positions specialty nitrogen products to meet emerging scope-3 procurement mandates from food retailers and CPG companies. IRENA projects green-ammonia capacity to reach 15 million metric tons per year by 2030, creating a new competitive dimension for the Specialty Fertilizers Market [#16, → Section 8].

Vertical Farming and Controlled-Environment Agriculture

Indoor farms require zero-runoff, precisely calibrated nutrient solutions that commodity fertilizers cannot deliver. The vertical-farming sector's projected build-out across North America and East Asia opens a premium-priced niche for custom liquid and chelated formulations.

Emerging-Market Fertigation Rollouts

India alone plans to bring 10 million additional hectares under micro-irrigation by 2030, while Vietnam and Thailand are subsidizing drip-system installations for high-value export crops [9]. Each new irrigated hectare converts a potential commodity-fertilizer customer into a specialty-fertilizer buyer.


Specialty Fertilizers Market Future Outlook

AI-Guided Nutrient Prescriptions

Machine-learning models trained on multi-year soil, weather, and yield datasets will move nutrient prescriptions from field-average recommendations to sub-meter precision by the late 2020s. Early adopters report 10–15% reductions in total fertilizer spend while maintaining yield targets, suggesting that AI will grow the Specialty Fertilizers Market by expanding value-per-hectare rather than volume alone [11].

Green-Ammonia Supply Chain Maturation

IRENA forecasts that electrolyzer-based green-ammonia costs will fall below USD 500 per metric ton by 2032, reaching parity with grey ammonia in regions with low-cost renewables [16]. Specialty nitrogen producers that secure off-take agreements early will gain a first-mover advantage in satisfying food-company scope-3 decarbonization pledges, reshaping competitive positioning in the Specialty Fertilizers Market.

Circular Nutrient Recovery

Phosphorus recovery from wastewater — via struvite crystallization and thermal ash treatment — is scaling in the EU under the revised Sewage Sludge Directive. Recovered phosphorus meets stringent heavy-metal thresholds by design, giving it a natural fit within specialty formulations and potentially easing dependence on mined phosphate rock [19].

Platform Economics and Subscription Models

The next decade will see specialty fertilizer companies evolve from product sellers to nutrient-outcome platforms. Bundling soil diagnostics, satellite monitoring, and guaranteed yield-uplift contracts into annual subscriptions raises customer lifetime value and smooths revenue cyclicality. Yara, Nutrien, and ICL have each announced platform-strategy roadmaps through 2030 [#3, #4, #7].


Specialty Fertilizers Market Segmentation

By Specialty Type

Segment Key Metric Primary Demand Driver
Liquid Fertilizers 35.8% share (2025) Fertigation compatibility, labor savings
Controlled-Release Fertilizers CAGR 9.5% (2026–2035) Single-application efficiency, turf demand
Slow-Release Fertilizers USD 3.92 Billion (2025) Forestry, nursery and landscape programs
Water-Soluble Fertilizers CAGR 6.2% (2026–2035) Greenhouse hydroponics, drip systems
Micronutrients 8.6% share (2025) Zinc and boron deficiency correction


Liquid fertilizers lead the Specialty Fertilizers Market because they integrate directly with automated fertigation controllers, eliminating manual spreading passes. Greenhouse operators in the Netherlands, Spain, and Japan rely almost exclusively on liquid concentrates for real-time nutrient-dosing adjustments.

Controlled-release fertilizers are capturing incremental share at the expense of split-application urea programs. Golf-course superintendents, municipal parks departments, and commercial landscapers value the labor reduction and reduced leaching risk that polymer-coated granules deliver over a 90- to 180-day release window [18].

By Application Mode

Segment Key Metric Primary Demand Driver
Fertigation 44.5% share (2025) Water-use efficiency, automation synergies
Foliar CAGR 6.4% (2026–2035) Rapid micronutrient correction
Soil USD 6.28 Billion (2025) Broadcast and banding in row crops


Fertigation dominates the Specialty Fertilizers Market in application terms because it couples nutrient delivery with irrigation scheduling, an operational efficiency that justifies infrastructure investment in arid and semi-arid zones. Foliar application is growing as a targeted intervention — growers use it for in-season zinc, manganese, and iron correction rather than as a primary feeding strategy.

By Crop Type

Segment Key Metric Primary Demand Driver
Horticultural Crops 39.8% share (2025) High-value produce, year-round production
Field Crops USD 8.14 Billion (2025) Variable-rate technology in corn, wheat and soy
Turf & Ornamental CAGR 8.5% (2026–2035) Urbanization, golf-course and landscaping demand


Horticultural crops — vegetables, fruits, and floriculture — command the largest share of the Specialty Fertilizers Market by crop type because per-hectare input budgets are two to five times those of commodity grains. Turf and ornamental demand is rising fastest as global urbanization increases spending on public green spaces, sports facilities, and commercial landscaping.


Regional Market Share Analysis

Region Key Metric Primary Investment Themes
Asia-Pacific 36.2% share (2025) Rice-vegetable fertigation, government subsidy programs
Europe 24.5% share (2025) Cadmium regulation, precision horticulture
North America USD 5.91 Billion (2025) Turf management, row-crop VRT adoption
South America CAGR 5.3% (2026–2035) Soybean-corn rotations, cerrado expansion
Middle East & Africa CAGR 9.5% (2026–2035) Desert greenhouse build-out, food-security mandates
Total USD 27.12 Billion (2025)

The Specialty Fertilizers Market exhibits distinct regional dynamics shaped by cropping patterns, water availability, and regulatory environments. Asia-Pacific dominates overall revenue, but accelerating investment in arid-zone agriculture is propelling the Middle East & Africa toward the fastest growth rates.


North America

Country Key Metric Key Driver
US 78.4% of regional share Turf & landscape services, precision ag programs
Canada CAGR 5.6% Canola and pulse fertigation expansion
Mexico USD 0.42 Billion (2025) Protected-agriculture greenhouse clusters


North American demand is anchored by the USD 120 billion U.S. lawn-care and landscaping industry, where controlled-release granules dominate professional turf programs. Variable-rate technology penetration across Corn Belt operations is also converting conventional urea acres to specialty blends, supported by USDA Conservation Stewardship Program incentives [5].

Europe

Country Key Metric Key Driver
Germany 19.8% of regional share Precision horticulture, nitrate directive compliance
UK CAGR 5.2% Post-Brexit nutrient-management regulations
France USD 1.12 Billion (2025) Wine-grape and fruit-tree fertigation
Italy 11.3% of regional share Mediterranean greenhouse clusters
Spain CAGR 5.9% Almería protected-crop expansion
Nordic Countries USD 0.38 Billion (2025) Forestry nursery and turf segments
Russia CAGR 4.8% Large-scale row-crop modernization
Rest of Europe 14.7% of regional share Eastern EU farm-modernization subsidies


The EU Fertilising Products Regulation is the single most influential policy driver in this region, pushing growers toward CE-marked specialty products with verified nutrient-release profiles. Germany's DLG-certified testing infrastructure gives locally formulated products a distribution advantage across Central Europe [6].

Asia-Pacific

Country Key Metric Key Driver
China 38.5% of regional share Zero-growth policy, greenhouse vegetable systems
India CAGR 7.1% Nutrient-Based Subsidy reform, micro-irrigation rollouts
Japan USD 0.82 Billion (2025) High-value rice and strawberry production
South Korea 5.4% of regional share Smart-farm technology subsidies
ASEAN CAGR 6.8% Palm oil, tropical fruit fertigation
Rest of Asia-Pacific USD 0.64 Billion (2025) Emerging precision-agriculture adoption


China's provincial-level demonstration programs have converted over 12 million hectares to specialty blends since 2015, establishing the country as both the largest producer and consumer in this region. India's trajectory is steeper; the shift from urea-centric subsidies toward nutrient-based pricing is unlocking latent demand for balanced specialty formulations [10].

South America

Country Key Metric Key Driver
Brazil 68.2% of regional share Soybean-corn double-cropping systems
Argentina CAGR 5.0% Wheat-soybean rotations
Rest of South America USD 0.28 Billion (2025) Coffee and cocoa specialty nutrition


Brazil's cerrado expansion and second-crop corn plantings are driving demand for sulfur-coated urea and micronutrient-enhanced MAP/DAP blends. Digital soil-mapping platforms developed by Embrapa and private agtech firms are accelerating the transition from blanket to site-specific nutrient management [11].

Middle East & Africa

Country Key Metric Key Driver
Saudi Arabia 28.4% of regional share Vision 2030 greenhouse investments
UAE CAGR 10.2% Food Security Strategy 2051, indoor farming
South Africa USD 0.36 Billion (2025) Sugar-cane and citrus fertigation
Egypt CAGR 7.8% Nile Delta drip-irrigation modernization
Rest of MEA 22.1% of regional share Smallholder micro-dosing programs


Gulf Cooperation Council states are converting sovereign-wealth capital into climate-controlled agriculture at an unprecedented pace. Saudi Arabia's NEOM food-tech zone alone plans to deploy over 1,600 hectares of hydroponic and aeroponic growing systems, all requiring precision nutrient delivery [16].


Specialty Fertilizers Market By Region, 2025-2035

Competitive Benchmarking

The Specialty Fertilizers Market is low concentrated, with the top five manufacturers expected to have 28–34% share of the global revenue. An HHI below 500 signifies a fragmented structure with regional formulators and niche-technology firms competing against international agrochemical companies. Differentiation is based on nutrient-release technology, digital-agronomy integration, and geographic reach.

Company Est. Revenue Share Range Key Offerings for Specialty Fertilizers Market Strategic Positioning
Yara International ~6–9% YaraMila compound fertilizers, AtFarm digital platform Integrated nitrogen producer with global distribution
Nutrien Ltd. ~5–8% ESN polymer-coated urea, Nutrien Digital Hub Largest retail ag-input network in North America
ICL Group ~4–7% Polysulphate, Osmocote controlled-release Specialty-focused portfolio across horticulture and turf
Haifa Group ~3–5% Multi-K potassium nitrate, NutriNet fertigation systems Fertigation-centric, strong in Mediterranean and Gulf markets
The Mosaic Company ~3–5% MicroEssentials enhanced-efficiency phosphates Integrated phosphate and potash mining operations
SQM ~3–5% Ultrasol water-soluble range, lithium-to-ag diversification Chilean nitrate and iodine vertically integrated supply
Nufarm Limited ~2–4% NuFeed foliar micronutrients, adjuvant-enhanced formulations Crop-protection crossover into specialty nutrition
Compo Expert GmbH ~2–4% Basacote Plus controlled-release, NovaTec stabilized fertilizers European formulation leader, strong R&D pipeline
K+S AG ~2–3% EPSO Top magnesium sulfates, potash specialty grades Access to European potash deposits, Kali specialty line
Kingenta Ecological Engineering ~2–3% Controlled-release urea, soil-health diagnostic services Dominant domestic position in China's specialty segment


Recent News & Developments


  • ICL Group (May 2024): ICL commenced commercial shipments of its controlled-release fertilizers featuring the eqo.x biodegradable coating, marking the first large-scale rollout of this technology. The initial launch targeted high-value European crops such as potatoes and onions, offering improved nutrient-use efficiency while addressing environmental concerns over traditional polymer coatings.


  • Coramandel International (April 2023): Coramandel International introduced Acumist Calcium, a liquid calcium fertilizer developed to address calcium deficiencies in crops efficiently.


Specialty Fertilizers Market Report Scope

Parameter Detail
Market Scope Global Specialty Fertilizers Market — production, trade, and end-use consumption
Study Period 2021–2035
CAGR (Forecast) 5.80% (2026–2035)
Market Size — 2025 (Base) USD 27.12 Billion
Market Size — 2035 (Forecast) USD 47.77 Billion
Fastest Growing Specialty Type Controlled-Release Fertilizers (CAGR 9.5%)
Fastest Growing Region Middle East & Africa (CAGR 9.5%)
Companies Profiled 10 (Yara, Nutrien, ICL, Haifa, Mosaic, SQM, Nufarm, Compo Expert, K+S, Kingenta)
Valuation Currency USD Billion


FAQs

What differentiates bio-based coatings from synthetic polymer coatings in controlled-release products?
Bio-based coatings use plant-derived polymers that decompose into organic matter, appealing to organic-certified growers. Synthetic polymer coatings provide more predictable release curves but persist longer in soil. [18]
How do large-scale procurement teams evaluate specialty fertilizer suppliers?
Buyers prioritize guaranteed nutrient-release profiles, batch consistency, and supply-chain resilience across growing seasons. Third-party field-trial data and embedded agronomist support often outweigh unit-price differences. [11]
What role do carbon credits play in Specialty Fertilizers Market purchasing decisions?
Precision-release products reduce nitrous oxide emissions per hectare, generating verified carbon offsets. Farms in voluntary carbon programs can partially offset premium fertilizer costs through credit sales. [19]
How does the Specialty Fertilizers Market address saline and sodic soil conditions?
Chelated formulations paired with calcium-amendment blends improve nutrient uptake in salt-affected soils. Drip-fertigation delivery limits salt accumulation near root zones, making reclamation economically viable. [17]
What challenges arise when retrofitting conventional systems to specialty fertilizer products?
Existing spreading equipment may clog with coated granules, requiring nozzle and hopper modifications. Calibrating variable-rate controllers to new product densities adds one-time setup costs. [7]
How does the Specialty Fertilizers Market respond to tightening heavy-metal regulations?
Stricter cadmium limits force phosphate producers to source cleaner ores or invest in purification. Compliance raises costs but creates competitive differentiation for certified low-contaminant brands. [13]
What emerging use cases exist for the Specialty Fertilizers Market beyond open-field agriculture?
Vertical farming, cannabis cultivation, and green-roof systems increasingly rely on customized nutrient solutions. These controlled environments demand precise, low-residue formulations that justify premium pricing. [1]    
Author
Author
Author Profile
Snehal Singh LinkedIn
Manager - Research
High acumen in analyzing complex macro & micro markets with more than 6 years of work experience in the field of market research. By implementing her analytical skills in forecasting and estimation into market research reports, she has expertise in Packaging, Construction, and Equipment domains. She handles a team size of 20-25 resources and ensures smooth running of the projects, associated marketing activities, and client servicing.
Co-Author
Co-Author Profile
Tejas Chaudhary
Research Analyst Level II
I have a degree in Engineering (Civil), with masters in Business Administration (Marketing). With more than 4 years of experience in market research and consulting, I am involved in end-to-end process of market research, proposals, project kickoffs and delivery. I have research knowledge and expertise in consumer goods/packaging domain. Also I have worked for various other domains like construction & equipment. Effectively managed and delivered more than 60 report studies for regional as well as global clientele.
Share::
Request Free Sample

Research Approach


Secondary Research

The secondary research process involved comprehensive analysis of agricultural databases, peer-reviewed agronomy journals, regulatory publications, and authoritative agricultural organizations. Key sources included the US Department of Agriculture (USDA) Economic Research Service, USDA National Agricultural Statistics Service (NASS), Environmental Protection Agency (EPA), Food and Agriculture Organization of the United Nations (FAO), International Fertilizer Association (IFA), The Fertilizer Institute (TFI), Fertilizers Europe (formerly EFMA), International Plant Nutrition Institute (IPNI), World Bank Commodity Markets and Agriculture Data, USDA Foreign Agricultural Service (FAS) Global Agricultural Information Network (GAIN), European Commission Directorate-General for Agriculture and Rural Development, National Institutes of Food and Agriculture (NIFA), Soil Science Society of America journals, Agronomy Journal, Elsevier's Field Crops Research, and national agricultural ministry statistics from key fertilizer-consuming markets (India, China, Brazil, EU member states).

Data on crop acreage, fertilizer application rates, regulatory compliance under REACH and EPA guidelines, market landscape analysis for controlled-release fertilizers (CRF), water-soluble fertilizers (WSF), micronutrient fertilizers, and slow-release technologies, as well as nutrient management studies, were gathered from these sources.


Primary Research

The primary research method involved conducting interviews with stakeholders from both the supply and demand sides of the specialty nutrient solution industry to get both qualitative and quantitative data. Corporate executives, agronomy and product development vice presidents, compliance officials, and commercial directors from compound fertilizer original equipment manufacturers (OEMs), coating technology providers, and specialized fertilizer manufacturers made up the supply side. Chief agronomists, crop consultants, cooperative operations managers, commercial farming business procurement leads, and agricultural retail network distributors made up the demand-side sources. Confirmation of new product registration timelines and efficacy trial results, validation of crop type and nutrient composition market segmentation, insights into precision agriculture adoption patterns, pricing premiums over conventional fertilizers, and subsidy dynamics in key agricultural economies were all gleaned from primary research.

Primary Respondent Breakdown:

By Designation: C-level Primaries (30%), Director Level (35%), Others (35%)

By Region: North America (32%), Europe (30%), Asia-Pacific (28%), Rest of World (10%)


Market Size Estimation

Global market valuation was derived through revenue mapping and consumption volume analysis across arable land and greenhouse applications. The methodology included:

Identification of 60+ key manufacturers and technology licensors across North America, Europe, Asia-Pacific, Latin America, and Middle East/Africa

Product mapping across controlled-release fertilizers (polymer/ sulfur-coated urea), water-soluble NPK formulations, micronutrient blends (chelated zinc, iron, manganese), and liquid specialty fertilizers

Analysis of reported segment revenues and modeled sales data specific to premium fertilizer portfolios excluding commodity bulk fertilizers

Coverage of manufacturers and technology providers representing 75-80% of global specialty fertilizer market share in 2024

Extrapolation using bottom-up (crop acreage × application rate × ASP by country/region) and top-down (manufacturer revenue validation adjusted for non-specialty product lines) approaches to derive segment-specific valuations for stabilized, coated, and solubilized nutrient categories

Share::
Request Free Sample
Download Free Sample

Kindly complete the form below to receive a free sample of this Report

Share::
Request Free Sample
Download PDF ×

We do not share your information with anyone. However, we may send you emails based on your report interest from time to time. You may contact us at any time to opt-out.
















