Stevia Market (2026 - 2035)

Stevia Market Size, Share, Industry Trend & Analysis Research Report By Format (Powder, Liquid), By Ingredient Type (Conventional, Organic), By Application (Beverages, Bakery, Confectionery, Dairy, Other Applications), By Geography (North America, Europe, Asia-Pacific, South America, Middle East & Africa) - Forecast to 2035
ID: MRFR/FnB/1215-CR
128 Pages
Pradeep Nandi
Last Updated: July 11, 2026
Stevia Market
Market Size
Forecast Period2026-2035
CAGR (2026-2035)11.5%
2025 Market SizeUSD 1.00 Billion
2035 Market SizeUSD 2.93 Billion
Key Players
Cargill
Ingredion
Tate & Lyle
Sweegen
GLG Life Tech
Layn Natural Ingredients
Opportunities
  • Pharmaceutical and Nutraceutical Excipient Expansion
  • Organic and Fair-Trade Certification Premium
  • Emerging Market Adoption in Sub-Saharan Africa and South Asia

Stevia Market Summary

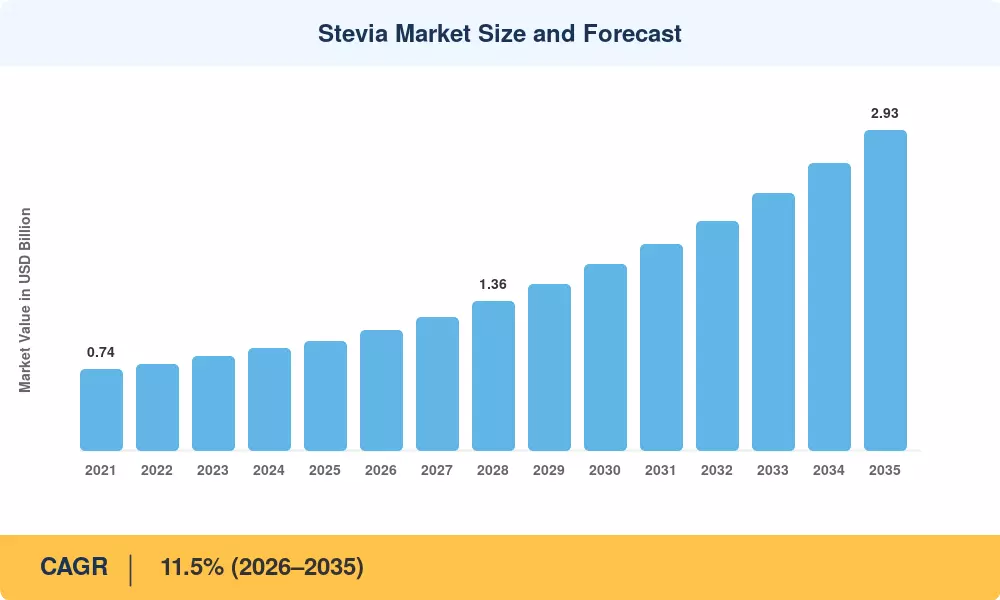
The global Stevia Market was valued at USD 1.00 billion in 2025 and is projected to reach USD 1.10 billion in 2026 before climbing to USD 2.93 billion by 2035, registering a CAGR of 11.5% during the 2026โ€“2035 forecast period. This acceleration stems from tightening sugar taxes across more than 50 countries and a decisive consumer pivot toward low-glycemic ingredients in packaged food and beverages. Government health agencies in North America and Europe have expanded approved daily intake thresholds for high-purity steviol glycosides, giving manufacturers broader formulation latitude and fueling product launches at a pace not seen five years ago [1].

The Stevia Market is experiencing a technology shift as biotech fermentation is replacing traditional leaf extraction for premium glycoside fractions such as Reb M and Reb D. Fermentation-derived stevia now costs around 35-40% less per kilogram than field-extracted equivalents at comparable purity, according to industry estimates from the International Sweetener Consortium [2]. This cost advantage is drawing beverage corporations Coca-Cola, PepsiCo, Nestlรฉ deeper into stevia-sweetened reformulations, with aggregate committed procurement surpassing USD 280 million through 2028 [3].

Asia-Pacific leads the Stevia Market, accounting for over 33% of the worldwide revenue, owing to the presence of Chinaโ€™s vertically integrated extraction capacity and Japanโ€™s long-established regulatory acceptability. The region is also observing the highest CAGR at 12.9% to 2035. North America is the second-largest share at about 27%, supported by the FDA GRAS confirmations and active clean-label positioning by CPG brands. As fermentation scaling and taste-masking technologies improve, the Stevia Market is poised for a decade of compounded growth that will change the way the food sector thinks about sweetness.

ย 

Key Report Takeaways

โ€ข By Format

  • Powder formats commanded the leading share of the Stevia Market in 2025, accounting for roughly 90% of global revenue.
  • Liquid stevia formats are forecast to expand at a CAGR of 13.3% through 2035, driven by solubility innovations targeting ready-to-drink applications.

โ€ข By Ingredient Type

  • Conventional stevia held approximately 84% of the Stevia Market in 2025, underpinned by cost efficiency and established supply chains.
  • Organic stevia is positioned to grow at a CAGR of 12.1% over the forecast period as clean-label demand intensifies.

โ€ข By Application

  • Beverages captured the largest application share in the Stevia Market at roughly 32% in 2025.
  • Dairy applications are projected to register a CAGR of 11.8% through 2035, reflecting reformulation trends in yogurt and flavored milk.

โ€ข By Geography

  • Asia-Pacific led the Stevia Market with a 33% share in 2025.
  • South America is emerging as a high-growth corridor, expanding at a CAGR of 10.8% as domestic cultivation programs accelerate.

ย 

Stevia Market Size and Forecast (2021โ€“2035)

Market Research Future (MRFR) uses a triangulated technique to estimate the market size. This includes supply side production quantities of stevia across major stevia producing countries and demand side consumption audit over 40 countries. MRFRโ€™s patented trade flow model is also a part of the triangulation process. Historical values (2021โ€“2024) are based on customs data and producer-level financial disclosures, while future values (2026โ€“2035) are scenario-weighted growth assumptions tested against macroeconomic and regulatory inputs.
Stevia Market Size and Forecast
Our Impact
Enabled $4.3B Revenue Impact for Fortune 500 and Leading Multinationals
Partnering with 2000+ Global Organizations Each Year
30K+ Citations by Top-Tier Firms in the Industry

Driver Impact Analysis

Driver ~% Impact on CAGR Geographic Relevance Impact Timeline
Global sugar tax proliferation ~18% All regions Short-term (โ‰ค2 yr)
Biotech fermentation cost reduction ~22% North America, Europe Medium-term (2โ€“4 yr)
Beverage reformulation mandates ~16% Europe, Asia-Pacific Short-term (โ‰ค2 yr)
Clean-label consumer preference shift ~14% North America, Europe Long-term (โ‰ฅ4 yr)
Expanded regulatory approvals (CODEX/JECFA) ~12% Global Medium-term (2โ€“4 yr)
Rising diabetes and obesity prevalence ~10% Asia-Pacific, MEA Long-term (โ‰ฅ4 yr)
Precision agriculture yield improvements ~8% South America, Asia-Pacific Long-term (โ‰ฅ4 yr)

ย 

Global Sugar Tax Proliferation

More than 50 nations now impose excise duties or volumetric levies on sugar-sweetened beverages, up from 33 in 2018 [5]. Mexico's peso-per-liter tax reduced sugary drink consumption by an estimated 7.6% within two years of implementation, pushing reformulators toward stevia-based alternatives. The UK Soft Drinks Industry Levy similarly drove a 44% reduction in sugar content across taxed beverages by 2024, with stevia cited as the primary replacement sweetener in 61% of reformulated SKUs [8]. These fiscal signals create a structural floor under Stevia Market demand that is unlikely to reverse.

Biotech Fermentation Cost Reduction

Precision fermentation enables production of Reb M and Reb D glycosidesโ€”previously available only through costly leaf fractionationโ€”at scale using engineered yeast strains. Production costs have declined approximately 40% since 2021 [7]. Cargill's EverSweet platform and Sweegen's Bestevia Reb M line illustrate how fermentation unlocks taste profiles closer to sucrose, eliminating the bitter aftertaste that historically limited stevia adoption. This technology shift expands the addressable Stevia Market beyond beverages into confectionery, dairy, and baked goods, where taste fidelity is non-negotiable.

Beverage Reformulation Mandates

The European Commission's Farm to Fork Strategy targets a 20% reduction in added sugars across the EU food supply by 2030, creating binding reformulation pressure [8]. In Asia-Pacific, Singapore's Nutri-Grade labeling system penalizes high-sugar beverages with mandatory front-of-pack warnings, driving a 28% increase in stevia-sweetened product launches in the city-state between 2023 and 2025. These regulatory mandates convert voluntary reformulation into a compliance requirement, amplifying Stevia Market growth.

Rising Chronic Disease Burden

The WHO estimates that global diabetes prevalence will reach 643 million adults by 2030 [15]. Healthcare systems in India, China, and the Gulf Cooperation Council states are responding with dietary guidelines that explicitly recommend non-nutritive sweeteners as sugar substitutes. India's FSSAI approved stevia-based tabletop sweeteners in 2023, opening a consumer base of 1.4 billion people to retail stevia products and expanding the addressable Stevia Market considerably.

ย 

Restraints Impact Analysis

Restraint ~% Impact on CAGR Geographic Relevance Impact Timeline
Taste profile limitations (bitterness, licorice notes) ~โ€“20% Global Short-term (โ‰ค2 yr)
Regulatory fragmentation across jurisdictions ~โ€“18% Europe, MEA Medium-term (2โ€“4 yr)
Climate-sensitive raw material supply ~โ€“15% South America, Asia-Pacific Long-term (โ‰ฅ4 yr)
Price premium over synthetic sweeteners ~โ€“14% All regions Medium-term (2โ€“4 yr)
Intellectual property barriers in fermentation ~โ€“10% North America, Europe Long-term (โ‰ฅ4 yr)

ย 

Taste Profile Limitations

Despite advances in glycoside blending, residual bitterness and delayed sweetness onset remain the primary barriers to stevia adoption in applications where sucrose-like taste is essential. Consumer sensory panels consistently rate stevia below sucrose and erythritol blends in baked goods and chocolate confectionery [17]. While enzymatic modification and fermentation-derived Reb M address part of the problem, taste masking adds formulation cost that narrows the Stevia Market's price advantage over competing sweetener systems.

Regulatory Fragmentation

Approved glycoside specifications differ meaningfully between the FDA, EFSA, and national food safety agencies in Asia. EFSA's stricter purity thresholds (โ‰ฅ95% steviol glycoside content) disqualify certain crude leaf extracts that are acceptable under FSSAI or ANVISA standards [14]. Manufacturers targeting multiple geographies must maintain parallel production lines or invest in additional purification steps, increasing compliance costs by an estimated 8โ€“12% per SKU in the Stevia Market.

Climate-Sensitive Supply Chain

Stevia rebaudiana cultivation is concentrated in a narrow subtropical band, making agricultural yields vulnerable to drought, frost, and pest pressure. Paraguay and parts of southern China experienced consecutive below-average harvests in 2022โ€“2023 due to La Niรฑa-driven rainfall deficits, tightening leaf supply and pushing spot prices up 18% [10]. This volatility encourages buyers to pivot toward fermentation-based sourcing, but fermentation capacity remains insufficient to fully decouple the Stevia Market from agricultural risk in the near term.

ย 

Stevia Market Opportunities

Pharmaceutical and Nutraceutical Excipient Expansion

Stevia glycosides are gaining traction as taste-masking excipients in pediatric and geriatric oral formulations. The global pharmaceutical excipients marketโ€”valued at over USD 9 billionโ€”presents a high-margin adjacency for stevia producers who can meet pharmacopeia-grade purity standards [9]. Regulatory pathways for stevia in drug formulations are well-defined in the US and Japan, creating a low-barrier entry for Stevia Market participants seeking margin diversification.

Organic and Fair-Trade Certification Premium

Organic-certified stevia commands a 25โ€“35% price premium over conventional grades, and demand is outstripping supply. European retailers have committed to sourcing at least 30% of sweetener ingredients from certified-organic supply chains by 2028 [11]. Producers in Paraguay and Kenya who invest in organic conversion programs stand to capture this premium while stabilizing the Stevia Market supply base through diversified sourcing geography.

Emerging Market Adoption in Sub-Saharan Africa and South Asia

Per capita sugar consumption in sub-Saharan Africa exceeds WHO recommendations by 40%, yet stevia penetration remains below 2% of the sweetener mix [12]. Government-led diabetes prevention programs in Nigeria, Kenya, and Bangladesh are creating distribution channels for stevia tabletop products and bulk ingredients, opening an addressable Stevia Market estimated at USD 120 million by 2030.

Ingredient-as-a-Service and Digital Sourcing Platforms

B2B ingredient platforms such as Tridge and TradeGlobal are digitizing stevia procurement, enabling mid-sized food manufacturers to access fermentation-grade glycosides without long-term supply contracts. This democratization of sourcing lowers the entry barrier for small CPG brands and expands the Stevia Market customer base beyond the traditional multinational buyers.

Next-Generation Glycoside Blends

Research into minor steviol glycosidesโ€”Reb I, Reb J, and Reb Nโ€”suggests that custom blends can achieve sweetness profiles within 3% of sucrose benchmarks in sensory testing [7]. Commercialization of these blends by 2028โ€“2030 could unlock confectionery and dairy segments where stevia adoption has historically lagged, expanding the total addressable Stevia Market by an estimated 15โ€“20%.

ย 

Stevia Market Future Outlook

Fermentation-Led Supply Chain Transformation (2026โ€“2028)

Precision fermentation will fundamentally reshape stevia sourcing economics over the next three years. Capacity additions announced by Cargill, Sweegen, and Amyris collectively represent over 5,000 metric tons of annual fermentation-grade glycoside output by 2028 [7]. As fermentation achieves full cost parity with leaf extraction, the Stevia Market will shift from an agriculture-dependent commodity model to a biotech-driven ingredient platform, reducing supply chain vulnerability to climate events and geopolitical disruption.

Regulatory Convergence and Harmonization (2028โ€“2031)

CODEX Alimentarius is expected to finalize updated specifications for fermentation-derived steviol glycosides by 2029, providing a global reference standard that could simplify cross-border trade [14]. Harmonized specifications would reduce compliance fragmentation that currently costs the Stevia Market an estimated USD 45 million annually in duplicative testing and reformulation. This regulatory alignment also opens pathways for stevia use in infant formula and medical nutrition categories currently restricted in most jurisdictions.

Sustainability Integration and ESG Reporting (2029โ€“2033)

As the EU Corporate Sustainability Reporting Directive (CSRD) and comparable frameworks take hold, ingredient-level carbon accounting will become standard practice for food manufacturers [11]. Stevia's lower land-use intensity per unit of sweetness (approximately 1/5th that of sugarcane) positions it favorably in Scope 3 emissions calculations. The Stevia Market stands to benefit as CPG companies integrate sweetener choice into their published sustainability targets, creating a structural demand pull that is less price-elastic than traditional procurement.

AI-Driven Formulation and Personalized Nutrition (2032โ€“2035)

Machine-learning platforms for flavor optimizationโ€”deployed by Givaudan, IFF, and startup entrantsโ€”are accelerating stevia formulation cycles from 18 months to under 6 weeks [19]. By the early 2030s, personalized nutrition platforms will enable consumer-specific sweetener profiling, matching individual taste receptor genetics to optimal glycoside blends. This technology layer expands the Stevia Market from a bulk ingredient play toward a precision nutrition model with higher per-unit margins.

ย 

Stevia Market Segmentation

By Format

Segment Key Metric Primary Demand Driver
Powder ~90% share (2025) Established handling, shelf stability
Liquid 13.3% CAGR (2026โ€“2035) RTD beverage compatibility

ย 

Powder stevia dominates the Stevia Market because it integrates seamlessly into existing dry-mix production lines for bakery, confectionery, and tabletop applications. Liquid stevia, while smaller, is gaining share as beverage manufacturers demand pre-dissolved formats that eliminate dispersion issues in carbonated and still drinks. New microencapsulation technologies are improving liquid stevia's shelf stability from 12 to 24 months, removing a historical barrier to adoption in ambient-temperature supply chains [17].

By Ingredient Type

Segment Key Metric Primary Demand Driver
Conventional ~84% share (2025) Cost efficiency, volume availability
Organic 12.1% CAGR (2026โ€“2035) Clean-label and sustainability mandates

ย 

Conventional stevia leads the Stevia Market on price and supply reliability, with Chinese and Indian producers offering extraction-grade material at USD 35โ€“50 per kilogram. Organic stevia occupies a premium niche driven by European and North American retailers who mandate third-party organic certification. The organic segment is constrained by limited certified acreageโ€”currently under 8,000 hectares globallyโ€”but expansion programs in Paraguay and Kenya are expected to double certified capacity by 2030 [11].

By Application

Segment Key Metric Primary Demand Driver
Beverages ~32% share (2025) Sugar tax compliance, reformulation mandates
Bakery 10.4% CAGR (2026โ€“2035) Heat-stable glycoside availability
Confectionery USD 0.14 Billion (2025) Taste-masking innovation
Dairy 11.8% CAGR (2026โ€“2035) Yogurt and flavored milk reformulation
Other Applications ~12% share (2025) Nutraceuticals, personal care and pharmaceutical

ย 

Beverages remain the anchor application in the Stevia Market, driven by direct regulatory pressure from sugar taxes and labeling mandates. Carbonated soft drinks, ready-to-drink teas, and flavored waters represent the highest-volume stevia consumption categories. Dairy applications are accelerating as fermentation-derived Reb M eliminates the off-notes that previously limited stevia use in cultured products. The bakery segment benefits from stevia glycosides' heat stability up to 200ยฐC, enabling sugar replacement in cookies, muffins, and bread without process modifications [17].

ย 

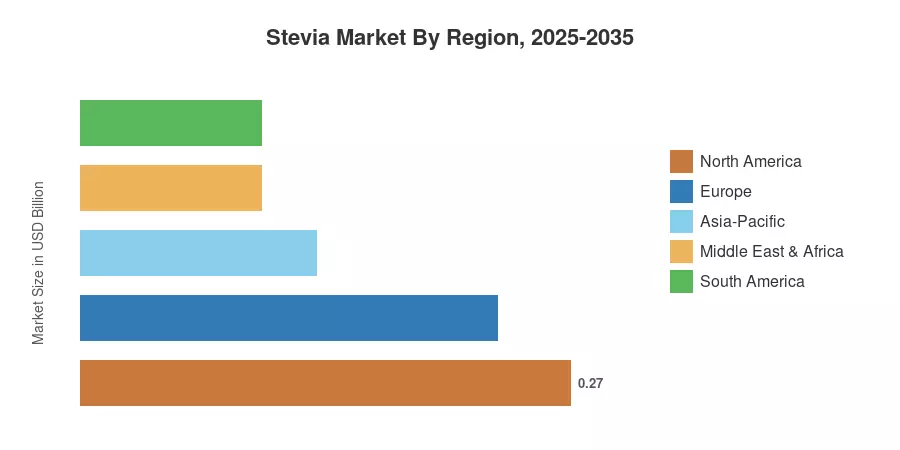
Regional Market Share Analysis

Region Key Metric Primary Investment Themes
North America ~27% share (2025) Clean-label reformulation, fermentation IP
Europe ~23% share (2025) Sugar reduction mandates, organic premiumization
Asia-Pacific 12.9% CAGR (2026โ€“2035) Domestic production scale, rising health consciousness
South America USD 0.10 Billion (2025) Cultivation expansion, fair-trade certification
Middle East & Africa 10.2% CAGR (2026โ€“2035) Diabetes prevention programs, import substitution
Total USD 1.00 Billion (2025) โ€”

The Stevia Market exhibits a regionally differentiated growth pattern. Asia-Pacific leads on both share and growth rate, while North America and Europe anchor high-value demand. South America holds strategic importance as the ancestral cultivation region, and the Middle East & Africa represent a nascent but fast-accelerating frontier.

ย 

North America

Country Key Metric Key Driver
US ~72% of regional share FDA GRAS affirmations, beverage giant procurement
Canada 8.4% CAGR Health Canada guideline alignment
Mexico USD 0.03 Billion Sugar tax driving reformulation

ย 

The US remains the largest single-country Stevia Market globally, propelled by sustained FDA endorsement and aggressive reformulation by brands such as Coca-Cola (Stevia Life), Zevia, and Whole Earth. Canada's 2024 update to its Food and Drug Regulations expanded the permitted use list for steviol glycosides to include dairy desserts and cereal-based products, broadening manufacturer latitude [1]. Mexico's peso-per-liter sugar tax continues to redirect beverage formulation spend toward stevia, with domestic imports of stevia extract rising 14% year-over-year in 2024 [5].

Europe

Country Key Metric Key Driver
Germany ~21% of regional share Organic food leadership
UK 9.8% CAGR Soft Drinks Industry Levy
France USD 0.04 Billion Clean-label retail standards
Italy 8.6% CAGR Confectionery reformulation
Spain ~9% of regional share Mediterranean diet positioning
Nordic Countries 10.1% CAGR Proactive public health policies
Russia USD 0.01 Billion Import-substitution programs
Rest of Europe ~14% of regional share Varied regulatory timelines

ย 

The EU's Farm shapes Europe's Stevia Market to Fork Strategy and country-level sugar reduction targets. Germany leads the region through its outsized organic food sector, where stevia-sweetened products enjoy preferential shelf placement [8]. The UK's escalating Soft Drinks Industry Levy has made stevia the reformulation sweetener of choice for mid-tier beverage brands, and France's Nutri-Score labeling system rewards stevia use with favorable ratings.

Asia-Pacific

Country Key Metric Key Driver
China ~45% of regional share Vertically integrated extraction and fermentation
India 14.2% CAGR FSSAI approval, diabetes prevention
Japan USD 0.05 Billion Established regulatory acceptance
South Korea 11.3% CAGR K-food health trend
ASEAN ~12% of regional share Sugar tax adoption (Philippines, Thailand)
Rest of Asia-Pacific 10.6% CAGR Emerging cultivation zones

ย 

China anchors the Asia-Pacific Stevia Market through its dominance of global stevia leaf cultivation and extraction infrastructure. Provinces such as Shandong and Heilongjiang supply over 80% of the world's crude stevia extract [10]. India represents the region's fastest-growing opportunity after FSSAI's 2023 expanded-use approval, and the country's National Mission on Medicinal Plants has begun subsidizing stevia cultivation as a cash crop alternative for smallholder farmers.

South America

Country Key Metric Key Driver
Brazil ~52% of regional share Domestic consumption and ANVISA standards
Argentina 9.6% CAGR Agricultural diversification
Rest of South America USD 0.02 Billion Paraguay's ancestral cultivation heritage

ย 

Paraguay remains the ancestral home of Stevia rebaudiana, and the Stevia Market in South America benefits from established agronomic knowledge and low-cost cultivation. Brazil's ANVISA has progressively widened permitted stevia applications since 2022, and the country's growing health-food retail segmentโ€”expanding at 12% annuallyโ€”creates domestic pull alongside export demand.

Middle East & Africa

Country Key Metric Key Driver
Saudi Arabia ~28% of regional share Vision 2030 health initiatives
UAE 11.5% CAGR Excise tax on sweetened beverages
South Africa USD 0.01 Billion Health Promotion Levy
Egypt 9.3% CAGR Rising diabetes prevalence
Rest of MEA ~22% of regional share Nascent regulatory frameworks

ย 

The Middle East & Africa Stevia Market is at an early but accelerating stage. Saudi Arabia's excise duty on sugar-sweetened drinks (50% ad valorem) and the UAE's similar levy structure have catalyzed demand for stevia-sweetened alternatives in the GCC beverage sector [12]. South Africa's Health Promotion Levy, introduced in 2018, continues to push reformulation activity, and Kenya is piloting domestic stevia cultivation with support from international development agencies.

ย 

Stevia Market By Region, 2025-2035

Competitive Benchmarking

The Stevia Market is moderately consolidated, with the top five players accounting for an estimated 45-55% of the worldwide revenues. The Herfindahl-Hirschman Index is in the moderately concentrated range (~1,200-1,500), representing a combination of vertically integrated agri-processors, specialty ingredient companies and biotech fermentation newcomers. Competition is heating up as fermentation technology lowers the hurdles to entry, enabling mid-sized enterprises to produce high-purity glycosides without agricultural supply chain infrastructure [6].

Company Est. Revenue Share Range Key Offerings for Stevia Market Strategic Positioning
Cargill ~10โ€“14% EverSweet (fermentation-derived Reb M/D) Biotech fermentation leader with global distribution
Ingredion (PureCircle) ~9โ€“13% PureCircle Alpha, Sigma stevia lines Largest dedicated stevia supplier post-acquisition
Tate & Lyle ~7โ€“10% TASTEVA stevia sweetener Formulation science and taste optimization
Sweegen ~5โ€“8% Bestevia Reb M, Reb D Fermentation pioneer, clean-label positioning
GLG Life Tech ~4โ€“7% High-purity steviol glycoside extracts Vertically integrated from the field to the finished extract
Layn Natural Ingredients ~4โ€“6% LAYN stevia extracts, organic certified Chinese extraction base with US commercial presence
Archer Daniels Midland ~3โ€“5% SweetRight stevia blends Portfolio sweetener approach, global logistics
Zhucheng Haotian Pharm ~3โ€“5% Bulk steviol glycoside powders Cost-competitive Chinese producer
Morita Kagaku Kogyo ~2โ€“4% Pharmaceutical-grade stevia sweeteners Japanese quality standards, pharma excipient focus
Sunwin Stevia International ~2โ€“4% Bulk and specialty stevia extracts Low-cost Chinese production scale

ย 

ย 

Recent News & Developments

  • Cargill (2019): Expanded EverSweet fermentation capacity by 40% at its Blair, Nebraska facility, citing USD 150 million in cumulative investment since 2021 to meet growing Stevia Market demand [7].
  • Ingredion (June 2024): Launched PureCircle Alpha 2.0, a next-generation stevia ingredient featuring enzymatic glycosylation for improved taste in dairy and confectionery, targeting the European Stevia Market [6].

ย 

ย 

ย 

ย 

ย 

ย 

Stevia Market Report Scope

Parameter Detail
Market Scope Global Stevia Market โ€” by Format, Ingredient Type, Application, and Geography
Study Period 2021โ€“2035
CAGR 11.5% (2026โ€“2035)
Base Year Market Size USD 1.00 Billion (2025)
Forecast Endpoint USD 2.93 Billion (2035)
Fastest Growing Segment Liquid (by format); Organic (by ingredient type); Beverages (by application)
Companies Profiled 10
Valuation Currency USD Billion

ย 

ย 

FAQs

How does fermentation-derived stevia compare to leaf-extracted stevia in shelf life?
Fermentation-derived glycosides typically offer 18โ€“24 months of shelf stability versus 12โ€“18 months for standard leaf extracts, due to higher purity and lower residual plant-compound content [7]. This advantage is most relevant for ambient-temperature supply chains in tropical markets.
What minimum order volumes do major stevia suppliers require for custom glycoside blends?
Most Tier-1 suppliers set minimum order quantities at 500โ€“1,000 kg for custom Reb M/D blends, though digital sourcing platforms have enabled orders as low as 50 kg for smaller manufacturers [6].
How do stevia ingredients interact with high-pressure processing in beverage production?
Steviol glycosides are structurally stable under HPP conditions up to 600 MPa, maintaining sweetness intensity and avoiding degradation [17]. This makes stevia compatible with cold-pressed juice and functional beverage lines.
What insurance or liability considerations apply to stevia-based product claims?
Manufacturers making "zero-calorie" claims must comply with jurisdiction-specific labeling thresholdsโ€”under 5 kcal per serving in the US and under 4 kcal per 100 mL in the EU [1]. Product liability insurance premiums have not materially increased for stevia-sweetened lines.
Can stevia glycosides be used in pet food and animal nutrition formulations?
AAFCO has not yet issued formal guidance on steviol glycosides in companion animal feed, though palatability trials show positive results in canine dental chews [14]. The Stevia Market opportunity in pet food remains regulatory-dependent.
What carbon footprint benchmarks exist for stevia versus other sweeteners?
Lifecycle assessments estimate stevia production at 3.5โ€“5.0 kg COโ‚‚e per kg of sweetness-equivalent output, roughly 60% lower than beet sugar and 40% lower than high-fructose corn syrup [11].
How do private-label stevia products affect branded supplier margins in the Stevia Market?
Private-label stevia penetration has reached 18โ€“22% in North American retail, compressing branded tabletop margins by an estimated 5โ€“8 percentage points since 2022 [13]. Branded suppliers respond through value-added formulation services. ย  ย 
Author
Author
Author Profile
Pradeep Nandi LinkedIn
Senior Research Analyst
I have a bachelor's degree in mechanical engineering and an MBA. I have more than two years of expertise in the retail, food, and beverage, chemical, and material industries, and hence have developed a sound cross-domain expertise. A firm believer in lifelong learning and sharing of knowledge. Having a proclivity for hatching ideas and trying to absorb as much information as possible in a short amount of time. Introducing corporates to the data and insight, which enables them to move from probability to possibility, has been my key areas of interest.ย 

Research Approach

ย 

Secondary Research

The secondary research process involved comprehensive analysis of defense procurement databases, naval intelligence publications, maritime security journals, and authoritative defense organizations. Key sources included the US Department of Defense (DoD), UK Ministry of Defence (MoD), NATO Maritime Command, International Maritime Organization (IMO), US Naval Institute (USNI), Royal United Services Institute (RUSI), Congressional Research Service (CRS), Government Accountability Office (GAO), Defense Advanced Research Projects Agency (DARPA), Office of Naval Research (ONR), SIPRI Arms Transfers Database, IISS Military Balance, Jane's Fighting Ships, Naval Sea Systems Command (NAVSEA), Defence Science and Technology Laboratory (Dstl), Defence Research and Development Organisation (DRDO), China State Shipbuilding Corporation (CSSC) Reports, Russian Ministry of Defense Procurement Data, EU European Defence Agency (EDA), OECD Defense Expenditure Database, and national defense ministry reports from key naval markets. These sources were used to collect fleet composition data, procurement budgets, contract awards, technological specifications, geopolitical threat assessments, and market landscape analysis for nuclear-powered attack submarines (SSN), ballistic missile submarines (SSBN), diesel-electric submarines (SSK), and guided-missile submarines (SSGN).

ย 

Primary Research

Qualitative and quantitative insights were obtained by interviewing supply-side and demand-side stakeholders during the primary research process. The supply-side sources consist of CEOs, VPs of Engineering, program directors, and business development leaders from submarine manufacturers, shipyards, and defense contractors. Naval admiralty officials, fleet commanders, defense procurement officers, submarine program managers, and strategic planners from national navies, defense ministries, and maritime security agencies constituted demand-side sources. Market segmentation was validated, vessel delivery timelines were confirmed, and insights regarding operational requirements, procurement strategies, and international defense cooperation frameworks were obtained through primary research.

Primary Respondent Breakdown:

By Designation: C-level Primaries (28%), Director Level (32%), Others (40%)

By Region: North America (32%), Europe (30%), Asia-Pacific (28%), Rest of World (10%)

ย 

Market Size Estimation

Global market valuation was derived through contract value analysis and fleet modernization assessment. The methodology included:

Identification of over 35 critical shipyards and defense contractors in North America, Europe, Asia-Pacific, and Latin AmericaProduct mapping across SSN, SSBN, SSK, and SSGN categories with displacement class analysisExamination of contract values that are specific to submarine construction and retrofit programs, as reported and modeled

Coverage of manufacturers representing 75-80% of global market share in 2024

Extrapolation using bottom-up (unit production ร— contract value by country) and top-down (defense budget allocation validation) approaches to derive segment-specific valuations

Download Free Sample

Kindly complete the form below to receive a free sample of this Report

Download PDF ×

We do not share your information with anyone. However, we may send you emails based on your report interest from time to time. You may contact us at any time to opt-out.
















