Segmentation Quick Reference
| Dimension | Sub-Segments | Dominant Segment | Fastest Growing Segment |
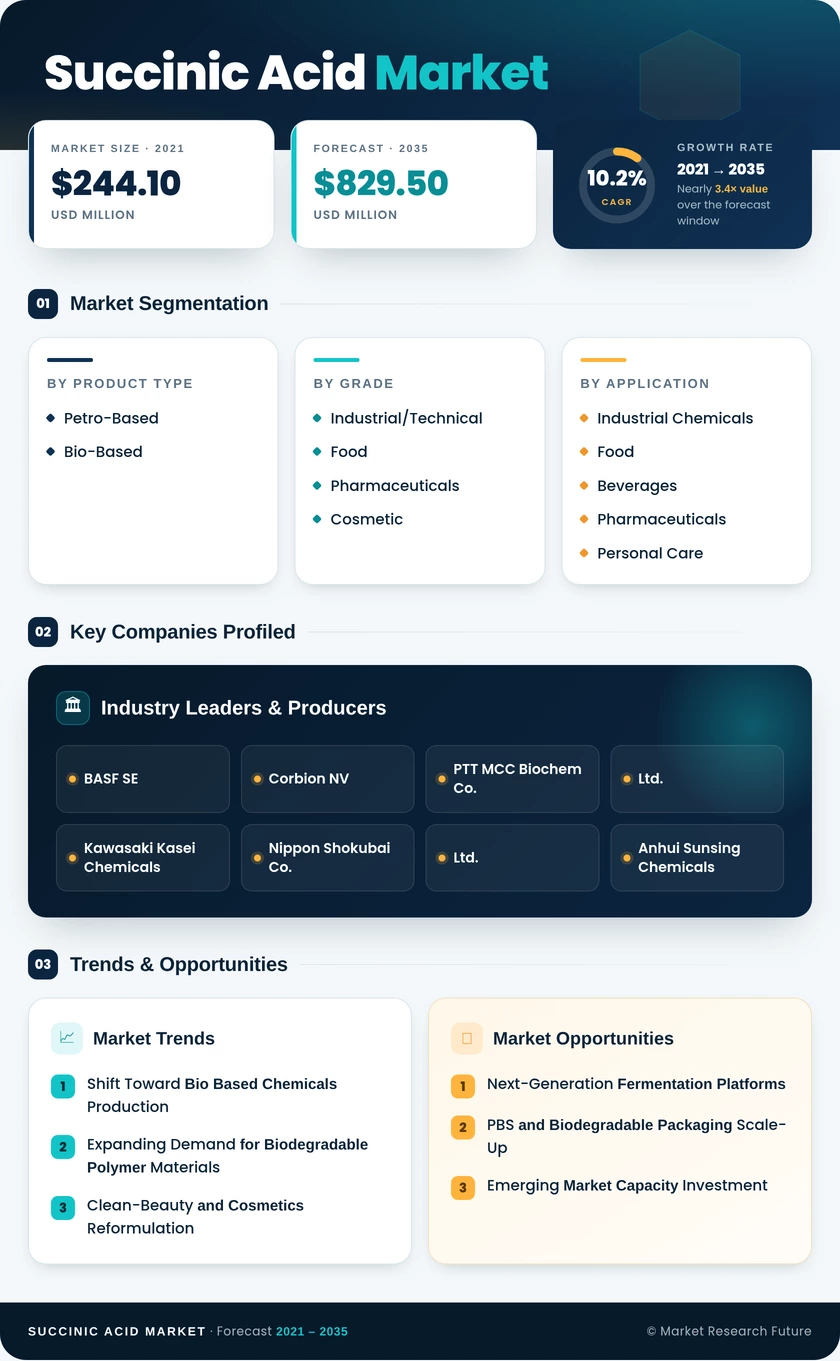
| Product Type | Petro-Based, Bio-Based | Petro-Based (~54% share, 2025) | Bio-Based (11.8% CAGR) |
| Grade | Industrial/Technical, Food, Succinic Acid Markets, Cosmetic | Industrial/Technical (~33% share, 2025) | Cosmetic (11.3% CAGR) |
| Application | Industrial Chemicals, Food and Beverages, Succinic Acid Markets, Personal Care and Cosmetics, Others | Industrial Chemicals (~27.5% share, 2025) | Personal Care and Cosmetics (10.9% CAGR) |
| Geography | North America, Europe, Asia-Pacific, South America, Middle East & Africa | Europe (~29.2% share, 2025) | Asia-Pacific (11.1% CAGR) |
Market Segmentation Overview
By Product Type
| Sub-Segment | Key Trend |
| Petro-Based | Mature segment facing regulatory pressure; cost advantage eroding in carbon-priced regions. |
| Bio-Based | Rapid capacity expansion driven by next-generation fermentation platforms and sustainability mandates |
The product type dimension captures the fundamental production pathway split, shaping the Succinic Acid Market. Petro-based production retains volume leadership through established infrastructure, while bio-based production is gaining share at nearly double the market-average CAGR as fermentation economics improve and regulatory incentives favor renewable sourcing.
By Grade
| Sub-Segment | Key Trend |
| Industrial/Technical | High-volume demand from BDO, THF, and plasticizer manufacturing |
| Food | Growing clean-label movement driving adoption as E363 acidulant. |
| Succinic Acid Markets | Expanding use as an API intermediate and excipient in controlled-release formulations |
| Cosmetic | Fastest-growing grade segment, fueled by clean-beauty reformulation trends |
Grade segmentation reflects purity requirements and end-use regulatory standards. Industrial/technical grade commands the largest share due to bulk chemical applications, while cosmetic grade is the fastest-growing, driven by premiumization in the personal care sector.
By Application
| Sub-Segment | Key Trend |
| Industrial Chemicals | Foundational demand as chemical synthesis intermediates for downstream derivatives. |
| Food and Beverages | Rising preference for bio-derived acidulants and flavor enhancers |
| Succinic Acid Markets | Growing pipeline of succinate-based drug intermediates |
| Personal Care and Cosmetics | Premium positioning for bio-based ingredients in skincare formulations |
| Others | Niche applications in de-icing fluids, lubricants, and agricultural adjuvants |
Application segmentation spans established industrial demand through emerging high-value specialty channels. The industrial chemicals segment anchors baseline demand, while personal care and cosmetics offer the strongest growth trajectory and margin premium for producers investing in high-purity bio-based capacity.
By Geography
| Sub-Segment | Key Trend |
| North America | Federal green procurement mandates and PBS packaging demand |
| Europe | Circular economy regulation and leading fermentation R&D ecosystem |
| Asia-Pacific | Rapid capacity buildout leveraging feedstock diversity and government incentives. |
| South America | Sugarcane-based biorefinery infrastructure is creating cost-competitive production |
| Middle East & Africa | Petrochemical diversification strategies and early-stage bio-based pilots |
Geographic segmentation captures the divergent regulatory, feedstock, and demand dynamics across regions. Europe leads on mature regulatory frameworks, while Asia-Pacific's combination of government incentives and low-cost feedstocks positions it as the fastest-growing region through 2035.