Supply Chain Analytics Market (2026 - 2035)

Supply Chain Analytics Market Size, Share and Research Report By Component (Software, Services), By Deployment (Cloud, On-Premise), By Analytics Type (Descriptive, Predictive, Prescriptive), By Application (Inventory Management, Transportation and Logistics, Procurement and Sourcing, Sustainability Analytics), By End-Use Industry (Retail and E-Commerce, Manufacturing, Healthcare and Life Sciences, Automotive), By Enterprise Size (Large Enterprises, Small and Medium Enterprises) and By Regional (North America, Europe, South America, Asia Pacific, Middle East and Africa) - Industry Forecast to 2035.
ID: MRFR/ICT/4065-CR
200 Pages
Ankit Gupta, Aarti Dhapte
Last Updated: July 02, 2026
Supply Chain Analytics Market
Market Size
Forecast Period2026-2035
CAGR (2026-2035)15.8%
2025 Market SizeUSD 10.02 billion
2035 Market SizeUSD 43.40 billion
Key Players
SAP SE
Oracle Corporation
Blue Yonder
Kinaxis Inc.
SAS Institute
IBM Corporation
Opportunities
  • SME Adoption via Vertical SaaS Templates
  • Sustainability Analytics and Carbon-Accounting Modules
  • Emerging-Market Logistics Networks

Supply Chain Analytics Market Summary

The Supply Chain Analytics Market was valued at USD 10.02 billion in 2025 and is projected to grow from USD 11.60 billion in 2026 to USD 43.40 billion by 2035, registering a CAGR of 15.8% during the forecast period (2026–2035). This expansion is anchored in the rapid digitization of procurement and logistics operations across industries, accelerated by government mandates such as the EU's Corporate Sustainability Reporting Directive (CSRD) and the U.S. SEC climate-disclosure rules that compel enterprises to instrument their supply chains with granular, auditable data pipelines [1].

Planning solutions tied to legacy ERP, which often only provide batch-processed, single-tier visibility, are being replaced by cloud-native, AI-enhanced platforms that can optimize many echelons in real time. It is believed that global organizations would have spent an estimated USD 18 billion on supply chain technology modernization for 2024 alone, with analytics platforms taking an increasing share of that spend [2]. Gen-AI copilots, digital-twin simulations and autonomous planning engines are shortening deployment timeframes from quarters to weeks, lowering the skill floor for mid-market adopters.


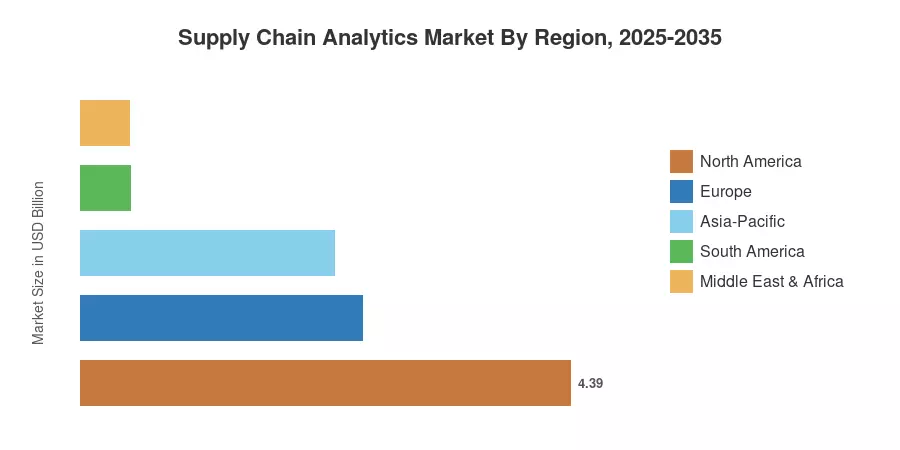
North America is anticipated to lead the Supply Chain Analytics Market with a projected share of 43.8% in 2025, fueled by established SaaS ecosystems and initial regulatory demands for Scope 3 reporting. Asia-Pacific is the fastest developing region with a projected CAGR of 22.8% through 2035, driven by manufacturing digitalization in China and India. Europe has the second greatest regional share of 25.2%, helped by CSRD compliance requirements and investment in green logistics. Analytics will go from a back-office cost center to a boardroom-grade strategic capability during the next decade.


Key Report Takeaways

• By Component

  • Software accounted for approximately 71% of the Supply Chain Analytics Market in 2025, reflecting the maturity of demand-planning and network-design platforms.
  • Services are expanding at a 22.5% CAGR through 2035, as implementation and managed analytics engagements grow alongside platform adoption.

• By Deployment

  • Cloud deployment models held a 57% share in 2025 and continue to gain ground as subscription pricing displaces capital-intensive on-premise installations.


• By Application

  • Inventory management captured a 30% share of the Supply Chain Analytics Market in 2025, anchored by safety-stock optimization and demand-sensing use cases.


• By Geography

  • North America dominated with 43.8% of global revenue in 2025.
  • Asia-Pacific is projected to register the highest CAGR at 22.8% during 2026–2035.


Market Size and Forecast (2021–2035)

Market Research Future (MRFR) employs a proprietary triangulation methodology in its market estimation and forecasting that references a number of data points for its validation purposes. Historical figures (2021-2024) are validated against publicly stated enterprise software revenues and third-party technology spending databases. The forecast forecasts incorporate industry-specific adoption curves and is stress-tested against GDP growth, volatility in trade flows and technology investment indexes.
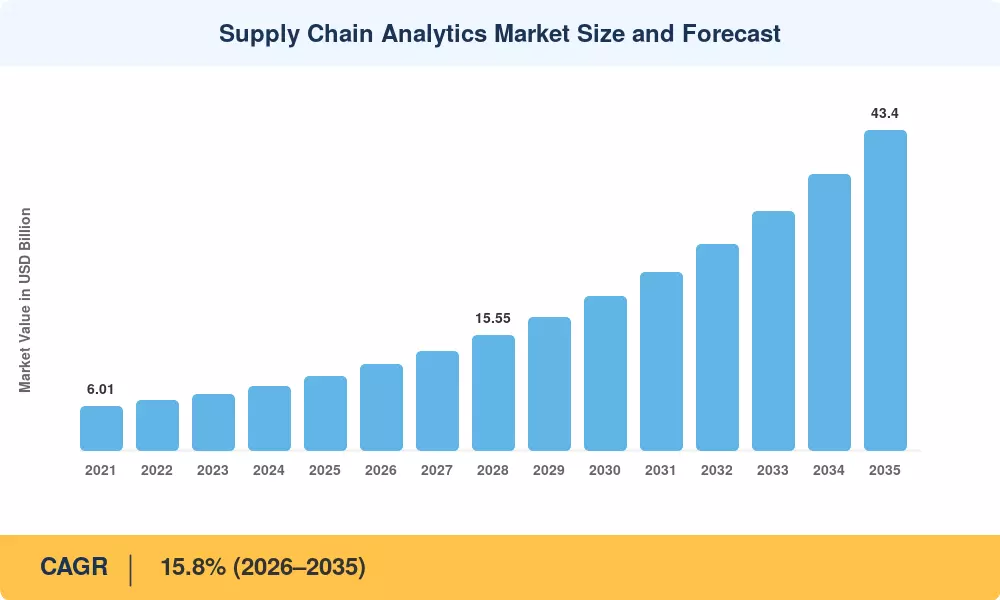
Supply Chain Analytics Market Size and Forecast
Our Impact
Enabled $4.3B Revenue Impact for Fortune 500 and Leading Multinationals
Partnering with 2000+ Global Organizations Each Year
30K+ Citations by Top-Tier Firms in the Industry

Driver Impact Analysis

Driver ~% Impact on CAGR Geographic Relevance Impact Timeline
Gen-AI copilots and autonomous planning ~22% Global Short-term (≤2 yr)
Cloud-native platform migration ~18% North America, Europe Medium-term (2–4 yr)
Scope 3 / ESG reporting mandates ~16% Europe, North America Medium-term (2–4 yr)
Manufacturing digitization in the Asia-Pacific ~14% China, India, ASEAN Long-term (≥4 yr)
Geopolitical supply chain de-risking ~12% Global Short-term (≤2 yr)
IoT/connected-asset proliferation ~10% Global Long-term (≥4 yr)
Subscription pricing and SME accessibility ~8% Global Medium-term (2–4 yr)


Gen-AI Copilots and Autonomous Planning

Large language models fine-tuned on enterprise data are reshaping how supply chain teams interact with analytics. estimated that Gen-AI could unlock USD 1.2–2.0 trillion in annual value across supply chain and manufacturing operations globally [5]. Vendor roadmaps from SAP, Oracle, and Blue Yonder already embed Copilot interfaces that translate natural-language queries into multi-constraint optimization runs, cutting scenario-planning time by up to 60%. This driver is pulling forward adoption timelines across the Supply Chain Analytics Market, especially in demand sensing and logistics route optimization.

Scope 3 and ESG Reporting Mandates

The EU's CSRD, effective from fiscal year 2024 onward, requires roughly 50,000 companies to report granular Scope 3 emissions data across their supplier networks [1]. Compliance demands automated data ingestion from tier-2 and tier-3 suppliers — a capability only modern analytics platforms can deliver at scale. Similarly, the SEC's finalized climate-disclosure rules have accelerated U.S. enterprise investments in carbon-accounting modules integrated within supply chain analytics suites. This regulatory tailwind is projected to contribute approximately 16% of the overall growth momentum in the Supply Chain Analytics Market through 2030.

Cloud-Native Platform Migration

reported that over 70% of new supply chain planning deployments in 2024 were cloud-first, up from 48% in 2021 [8]. Cloud delivery eliminates hardware provisioning cycles, reduces total cost of ownership by 25–35%, and enables real-time collaboration across geographically dispersed planning teams. Subscription-based pricing models align analytics spend with transactional volume, making the Supply Chain Analytics Market accessible to mid-market manufacturers and regional logistics operators that previously relied on spreadsheet-driven processes.

Manufacturing Digitization in Asia-Pacific

China's "Made in China 2025" initiative and India's Production-Linked Incentive (PLI) scheme have funneled over USD 45 billion into smart-factory infrastructure since 2021 [9]. As these facilities come online, they generate massive telemetry streams that require real-time analytics for yield optimization, predictive maintenance, and supplier collaboration. ASEAN nations — particularly Vietnam and Thailand — are emerging as secondary beneficiaries, as nearshoring strategies create new manufacturing nodes that demand integrated analytics platforms.


Restraints Impact Analysis

Restraint ~% Negative Impact on CAGR Geographic Relevance Impact Timeline
Data integration complexity ~−6% Global Short-term (≤2 yr)
Talent scarcity in analytics roles ~−5% North America, Europe Medium-term (2–4 yr)
Data privacy and sovereignty regulations ~−4% Europe, Asia-Pacific Long-term (≥4 yr)
Legacy system lock-in ~−4% Global Medium-term (2–4 yr)
Cybersecurity risks in interconnected networks ~−3% Global Long-term (≥4 yr)


Data Integration Complexity

Enterprises typically operate 15–25 disconnected data sources across procurement, warehousing, transportation, and finance systems [13]. Harmonizing these into a unified analytics layer requires costly ETL pipelines, master-data governance, and ongoing data-quality management. For mid-market firms, integration projects can consume 40–60% of total analytics program budgets, delaying time-to-value and dampening ROI confidence in the Supply Chain Analytics Market.

Talent Scarcity in Analytics Roles

The World Economic Forum projected a global shortfall of 3.5 million data science and analytics professionals by 2025 [14]. Supply chain analytics requires hybrid talent that combines domain expertise in logistics and procurement with advanced statistical and programming skills — a profile that remains exceptionally rare. While Gen-AI copilots are partially offsetting this gap, enterprises still struggle to staff the governance, change-management, and model-validation roles that underpin production-grade analytics deployments.

Data Privacy and Sovereignty Regulations

Cross-border data flows are essential for multi-tier supply chain visibility, yet regulations such as GDPR, China's PIPL, and India's DPDP Act 2023 impose strict localization and consent requirements [15]. These rules complicate the architecture of centralized analytics platforms, forcing vendors to deploy regional data residency zones and fragmenting model-training datasets. For the Supply Chain Analytics Market, compliance overhead can add 10–15% to platform operating costs in regulated jurisdictions.


Supply Chain Analytics Market Opportunities

SME Adoption via Vertical SaaS Templates

The supply chain analytics market is expanding beyond its traditional enterprise base. Vendors are increasingly utilizing pre-configured, industry-specific templates to simplify deployment for the mid-market. By focusing on vertical-specific requirements (e.g., cold-chain visibility in food & beverage), providers are making sophisticated analytics accessible to smaller players who were previously excluded by the complexity and cost of bespoke implementations.


Sustainability Analytics and Carbon-Accounting Modules

With sustainability analytics growing at the fastest application-level CAGR, there is a clear opportunity to embed carbon-footprint calculators, supplier ESG scorecards, and circular-economy tracking directly into planning workflows. Enterprises that can demonstrate auditable Scope 3 reductions gain preferential access to green financing instruments, creating a self-reinforcing adoption loop.

Emerging-Market Logistics Networks

Digital-twin technology is evolving into a mainstream tool for complex network stress-testing. By continuously synchronizing with real-world counterparts, digital twins allow teams to simulate port closures, demand shocks, or production delays in a virtual environment. As the technology matures, it is shifting from a specialized engineering tool to a strategic planning necessity, enabling significant reductions in inventory carrying costs and improved service levels.


Data Monetization and Analytics-as-a-Service

Leading platform operators are beginning to anonymize and aggregate network-level data — shipment volumes, lead-time benchmarks, supplier-risk indices — into sellable intelligence products. This "data-as-a-product" model creates recurring revenue streams that supplement traditional license and subscription income, expanding the addressable value pool of the Supply Chain Analytics Market.

Digital-Twin and Simulation-Driven Planning

Digital-twin technology allows enterprises to model their entire supply network in a virtual environment, stress-testing scenarios ranging from port closures to demand shocks before they materialize. estimated that by 2027, over 50% of large enterprises will use supply chain digital twins for scenario planning [19]. Early movers in this space can reduce inventory carrying costs by 15–25% while improving service levels, creating a compelling ROI case.


Supply Chain Analytics Market Future Outlook

Autonomous and Agentic Supply Chain Operations

By 2030, leading enterprises will operate supply chains where AI agents execute routine procurement, replenishment, and logistics decisions without human intervention. The Supply Chain Analytics Market will evolve from descriptive dashboards to closed-loop systems where prescriptive recommendations trigger automated actions — purchase orders, carrier bookings, production-schedule adjustments — in real time. projects that autonomous supply chains could reduce operating costs by 20–30% for early adopters [5].

Platform Consolidation and Ecosystem Economics

The vendor landscape is shifting from best-of-breed point solutions toward integrated platform ecosystems. Large ERP vendors are acquiring or building native analytics capabilities, while pure-play analytics firms are expanding into execution layers. This consolidation will concentrate the Supply Chain Analytics Market among 8–12 mega-platforms by 2032, with smaller specialists surviving as plug-in modules within those ecosystems [7].

Sustainability-Linked Analytics as a Compliance Baseline

ESG reporting is transitioning from voluntary disclosure to regulatory mandate across all major economies. By 2028, the International Sustainability Standards Board (ISSB) standards are expected to cover over 80% of global market capitalization [6]. Supply chain analytics platforms that cannot produce auditable carbon, water, and labor-practice metrics will face disqualification from enterprise procurement shortlists, making sustainability a table-stakes capability rather than a differentiator.

Resilience Engineering and Multi-Scenario Simulation

The frequency of supply chain disruptions — from geopolitical conflicts to extreme weather events — has increased threefold since 2019, according to the World Economic Forum [23]. Enterprises are responding by investing in simulation-driven resilience analytics that model thousands of disruption scenarios simultaneously. The Supply Chain Analytics Market will see growing demand for digital-twin platforms, stress-testing engines, and risk-scoring models that integrate geopolitical, climate, and financial risk data into unified decision layers.


Supply Chain Analytics Market Segmentation

By Component

Segment Key Metric Primary Demand Driver
Software 71% share (2025) Embedded AI in planning and optimization modules
Services 22.5% CAGR (2026–2035) Implementation, integration, and managed analytics


Software dominates the Supply Chain Analytics Market because enterprises increasingly purchase integrated suites rather than standalone tools. Demand-planning, network-design, and transportation-optimization modules form the core, with Gen-AI features commanding premium pricing. The services segment is growing faster as platform complexity drives demand for implementation partners, data-engineering consultancies, and managed analytics providers that can accelerate time-to-value for resource-constrained buyers.

By Deployment

Segment Key Metric Primary Demand Driver
Cloud 57% share (2025) Subscription pricing, rapid deployment, scalability
On-Premise USD 4.31 billion (2025) Regulated industries, data-sovereignty requirements


Cloud deployment continues to gain share in the Supply Chain Analytics Market as enterprises prioritize operational agility over infrastructure control. On-premise installations persist in defense, pharmaceuticals, and financial services, where data-sovereignty regulations or legacy IT policies mandate local data residency. Hybrid architectures — combining cloud-based analytics engines with on-premise data lakes — are emerging as a pragmatic middle ground.

By Analytics Type

Segment Key Metric Primary Demand Driver
Descriptive 38% share (2025) Reporting, KPI tracking, retrospective analysis
Predictive USD 2.71 billion (2025) Demand forecasting, risk anticipation
Prescriptive 25.2% CAGR (2026–2035) Autonomous decision-making, optimization


Descriptive analytics retains the largest share because organizations still require robust reporting and visualization layers as the foundation for more advanced capabilities. Prescriptive analytics is the fastest-growing type within the Supply Chain Analytics Market, fueled by breakthroughs in constraint-solving algorithms and reinforcement-learning models that can recommend optimal sourcing, routing, and inventory decisions across thousands of variables simultaneously.

By Application

Segment Key Metric Primary Demand Driver
Inventory Management 30% share (2025) Safety-stock optimization, demand sensing
Transportation and Logistics USD 2.15 billion (2025) Route optimization, carrier management
Procurement and Sourcing 19.5% CAGR (2026–2035) Supplier-risk scoring, spend analytics
Sustainability Analytics 26.5% CAGR (2026–2035) Scope 3 emissions tracking, circular-economy metrics


Inventory management anchors the application landscape of the Supply Chain Analytics Market because excess and obsolete inventory remains the single largest working-capital drain for manufacturers and retailers. Sustainability analytics is advancing at the fastest pace as CSRD and SEC mandates convert voluntary carbon tracking into compliance-critical workflows that touch every node in the supply network.

By End-Use Industry

Segment Key Metric Primary Demand Driver
Retail and E-Commerce 22.5% share (2025) Omnichannel fulfillment, last-mile visibility
Manufacturing USD 2.30 billion (2025) Production scheduling, BOM optimization
Healthcare and Life Sciences 23.7% CAGR (2026–2035) Cold-chain integrity, serialization compliance
Automotive 18.2% CAGR (2026–2035) EV battery-material traceability


Retail and e-commerce enterprises have been early and aggressive adopters within the Supply Chain Analytics Market, driven by the need to manage millions of SKUs across omnichannel networks while meeting same-day and next-day delivery expectations. Healthcare is the fastest-growing vertical as vaccine distribution, biologic therapies, and medical-device traceability requirements create compliance-driven analytics demand that extends from manufacturer to patient bedside.

By Enterprise Size

Segment Key Metric Primary Demand Driver
Large Enterprises 63% share (2025) Complex, multi-tier global supply networks
Small and Medium Enterprises 25.6% CAGR (2026–2035) Cloud SaaS templates, consumption-based pricing


Large enterprises dominate current spending in the Supply Chain Analytics Market due to the complexity and scale of their global operations. SMEs represent the high-growth frontier, propelled by vendor strategies that package pre-built industry templates, guided onboarding, and usage-based pricing to lower the adoption threshold for organizations with limited IT resources.


Regional Market Share Analysis

Region Key Metric Primary Investment Themes
North America 43.8% share (2025) AI-driven planning, Scope 3 compliance, SaaS consolidation
Europe 25.2% share (2025) CSRD compliance, green logistics, Industry 4.0
Asia-Pacific 22.8% CAGR (2026–2035) Manufacturing digitization, e-commerce logistics
South America USD 0.45 billion (2025) Agricultural supply chain modernization
Middle East & Africa USD 0.44 billion (2025) Oil & gas logistics, smart-port infrastructure
Total USD 10.02 billion (2025)

The Supply Chain Analytics Market exhibits pronounced regional variation driven by regulatory maturity, cloud infrastructure density, and manufacturing complexity. North America commands the largest share, while Asia-Pacific's rapid industrialization positions it as the growth engine for the next decade.


North America

Country Key Metric Key Driver
United States 78% of regional share Enterprise SaaS maturity, SEC climate rules
Canada 13.5% CAGR (2026–2035) Natural-resource supply chain digitization
Mexico USD 0.27 billion (2025) Nearshoring manufacturing analytics demand


The United States remains the epicenter of the Supply Chain Analytics Market in North America, with major CPG, retail, and automotive OEMs operating multi-billion-dollar analytics programs. Canada's resource-extraction sector is investing in predictive logistics for mining and forestry supply chains, while Mexico's nearshoring boom — driven by U.S.–China trade tensions — is generating fresh demand for cross-border visibility platforms [10].

Europe

Country Key Metric Key Driver
Germany 24% of regional share Automotive and Industry 4.0 analytics
United Kingdom 18.5% CAGR (2026–2035) Post-Brexit trade compliance automation
France USD 0.38 billion (2025) Aerospace and luxury-goods traceability
Italy 14.2% CAGR (2026–2035) SME manufacturing digitization
Spain USD 0.19 billion (2025) Agrifood cold-chain analytics
Nordic Countries 16.8% CAGR (2026–2035) Sustainability-first logistics
Russia USD 0.10 billion (2025) Sanctions-driven supply chain restructuring
Rest of Europe 12.5% CAGR (2026–2035) EU cohesion-fund-backed digital transformation


Europe's growth is structurally tied to CSRD implementation timelines. Germany's automotive OEMs are deploying prescriptive analytics to manage battery-material sourcing complexity, while UK-based retailers are automating customs-declaration workflows following Brexit. The European Commission's Digital Europe Programme allocated EUR 7.5 billion for AI and data infrastructure through 2027, with supply chain resilience identified as a priority vertical [20].

Asia-Pacific

Country Key Metric Key Driver
China 36% of the regional share Smart-manufacturing and e-commerce logistics
India 26.5% CAGR (2026–2035) PLI-scheme-driven factory analytics
Japan USD 0.34 billion (2025) Automotive just-in-time optimization
South Korea 19.8% CAGR (2026–2035) Semiconductor supply chain intelligence
ASEAN 24.0% CAGR (2026–2035) Nearshoring and free-trade-zone logistics
Rest of Asia-Pacific USD 0.12 billion (2025) Agricultural export digitization


Asia-Pacific represents the fastest-growing opportunity in the Supply Chain Analytics Market. China's logistics-technology spending exceeded USD 22 billion in 2024, with analytics platforms embedded in Cainiao and JD Logistics networks [9]. India's unified logistics interface platform (ULIP), backed by the Ministry of Commerce, is creating a national data backbone that analytics vendors can plug into. South Korea's semiconductor giants are investing in real-time wafer-supply analytics to mitigate geopolitical allocation risks.

South America

Country Key Metric Key Driver
Brazil 62% of regional share Agribusiness and mining logistics
Argentina 14.0% CAGR (2026–2035) Agricultural-export chain digitization
Rest of South America USD 0.07 billion (2025) Cross-border trade facilitation


Brazil's agribusiness conglomerates are deploying analytics to optimize soybean and protein cold-chain logistics from farm gate to port. While the region's overall analytics maturity lags behind North America and Europe, cloud-first platforms with Portuguese- and Spanish-language interfaces are lowering adoption barriers. IDB Invest committed USD 1.4 billion to digital-trade infrastructure in Latin America in 2024 [21].

Middle East & Africa

Country Key Metric Key Driver
Saudi Arabia 28% of the regional share Vision 2030 logistics modernization
UAE 22.5% CAGR (2026–2035) Smart-port and free-zone analytics
South Africa USD 0.06 billion (2025) Mining and retail supply chain digitization
Egypt 18.0% CAGR (2026–2035) Suez Canal logistics intelligence
Rest of MEA USD 0.08 billion (2025) Infrastructure-development-linked demand


Saudi Arabia's NEOM and Red Sea Global projects are creating greenfield logistics clusters that incorporate analytics-first design principles. The UAE's DP World has invested heavily in port analytics platforms to manage container throughput across its global terminal network. Across Sub-Saharan Africa, mobile-first analytics solutions tailored to informal supply chains are gaining traction, supported by AfDB digital-economy grants [22].


Supply Chain Analytics Market By Region, 2025-2035

Competitive Benchmarking

The Supply Chain Analytics Market is moderately concentrated, with the top five players accounting for a combined market share of 35-42%. The competitive landscape is a combination of huge enterprise software conglomerates with analytics built-in, pure-play planning platform specialists, and nascent AI-native disruptors. Fragmentation is still a big factor in the services and consulting layer as regional systems integrators compete with global players.

Company Est. Revenue Share Range Key Offerings for Supply Chain Analytics Market Strategic Positioning
SAP SE ~8–11% SAP Integrated Business Planning (IBP), SAP Business Network End-to-end ERP-embedded analytics leader
Oracle Corporation ~7–10% Oracle Fusion SCM Cloud, Oracle Demantra Cloud-native suite with broad ERP integration
Blue Yonder (Panasonic) ~5–8% Luminate Platform, Cognitive Demand Planning Pure-play AI-driven planning specialist
Kinaxis Inc. ~4–6% RapidResponse, Maestro Concurrent planning and scenario simulation
SAS Institute ~3–5% SAS Supply Chain Intelligence, SAS Viya Advanced analytics and statistical modeling
IBM Corporation ~3–5% IBM Sterling Supply Chain Suite, Watson Supply Chain Hybrid-cloud and AI integration
Coupa Software ~2–4% Coupa Supply Chain Design & Planning Spend-management-anchored analytics
Manhattan Associates ~2–4% Manhattan Active Supply Chain Warehouse and transportation optimization
o9 Solutions ~2–3% o9 Digital Brain Platform AI-native, graph-based planning engine
Infor (Koch Industries) ~2–3% Infor Nexus, Infor CloudSuite Industry-specific micro-verticals


Recent News & Developments

  • SAP SE (October 2024): Launched Joule-powered supply chain copilot within SAP IBP, enabling natural-language scenario planning across demand, supply, and inventory modules [24].


  • Kinaxis Inc. (June 2020): Acquired Rubikloud Technologies to strengthen its retail demand-planning capabilities within the Supply Chain Analytics Market [7].
  • Oracle Corporation (March 2024): Introduced Oracle Supply Chain Command Center with embedded autonomous-planning agents that auto-resolve exception alerts without human intervention [8].
  • European Commission (January 2024): Published CSRD implementation guidelines requiring Scope 3 supplier-level emissions reporting, triggering a wave of analytics-platform procurement across EU-headquartered enterprises [1].
  • o9 Solutions (July 2023): Raised USD 116 Million in Series C funding, earmarking capital for Gen-AI R&D and expansion into APAC and EMEA markets [12].


  • Coupa Software (May 2023): Launched Supply Chain Modeler with digital-twin capabilities enabling multi-tier network stress testing for Fortune 500 clients [19].


Supply Chain Analytics Market Report Scope

Parameter Detail
Market Scope Global Supply Chain Analytics Market covering software, services, cloud, on-premise, analytics types, applications, end-use industries, enterprise sizes, and 5 regions.
Study Period 2021–2035
CAGR (Forecast Period) 15.8% (2026–2035)
Base Year Market Size USD 10.02 billion (2025)
Forecast Endpoint USD 43.40 billion (2035)
Fastest Growing Segment Sustainability Analytics by Application (26.5% CAGR); SMEs by Enterprise Size (25.6% CAGR)
Companies Profiled SAP, Oracle, Blue Yonder, Kinaxis, SAS Institute, IBM, Coupa, Manhattan Associates, o9 Solutions, Infor
Valuation Currency USD billion


FAQs

How long does a typical Supply Chain Analytics Market platform implementation take for a mid-size manufacturer?
Cloud-based deployments average 12–16 weeks for core modules, while on-premise installations can extend to 6–9 months. Vendor-provided industry templates significantly compress timelines [8].
What ROI benchmarks should procurement teams expect from supply chain analytics investments?
Leading deployments report 15–25% inventory reduction and 10–20% transportation cost savings within the first 18 months. Payback periods typically range from 9 to 14 months [5].
How do prescriptive analytics platforms differ from traditional business intelligence tools in supply chain contexts?
Prescriptive platforms use optimization algorithms and constraint solvers to recommend specific actions, whereas BI tools only visualize historical data. This shift enables autonomous decision execution [8].
What data-quality prerequisites must organizations meet before deploying supply chain analytics?
Organizations need harmonized master data across SKU, supplier, and location hierarchies. Reliable transactional feeds with latency under 15 minutes are essential for real-time planning [13].
How are supply chain analytics vendors addressing multi-tenant data isolation for competitive enterprises?
Vendors employ encryption-at-rest, tenant-specific key management, and zero-knowledge architectures. SOC 2 Type II certification is the baseline for enterprise procurement [17].
What role do digital twins play in the Supply Chain Analytics Market today versus five years ago?
Digital twins have evolved from static network models to dynamic, real-time simulations fed by IoT and ERP data. They now support autonomous what-if analysis across thousands of scenarios [19].
How should organizations evaluate build-versus-buy decisions for supply chain analytics capabilities?
Build approaches suit firms with unique algorithms and deep engineering talent. Most organizations achieve faster time-to-value with commercial platforms that embed pre-trained models [16].    
Author
Author
Author Profile
Ankit Gupta LinkedIn
Team Lead - Research
Ankit Gupta is a seasoned market intelligence and strategic research professional with over six plus years of experience in the ICT and Semiconductor industries. With academic roots in Telecom, Marketing, and Electronics, he blends technical insight with business strategy. Ankit has led 200+ projects, including work for Fortune 500 clients like Microsoft and Rio Tinto, covering market sizing, tech forecasting, and go-to-market strategies. Known for bridging engineering and enterprise decision-making, his insights support growth, innovation, and investment planning across diverse technology markets.
Co-Author
Co-Author Profile
Aarti Dhapte LinkedIn
AVP - Research
A consulting professional focused on helping businesses navigate complex markets through structured research and strategic insights. I partner with clients to solve high-impact business problems across market entry strategy, competitive intelligence, and opportunity assessment. Over the course of my experience, I have led and contributed to 100+ market research and consulting engagements, delivering insights across multiple industries and geographies, and supporting strategic decisions linked to $500M+ market opportunities. My core expertise lies in building robust market sizing, forecasting, and commercial models (top-down and bottom-up), alongside deep-dive competitive and industry analysis. I have played a key role in shaping go-to-market strategies, investment cases, and growth roadmaps, enabling clients to make confident, data-backed decisions in dynamic markets.

Research Approach


Secondary Research

The secondary research process involved comprehensive analysis of technology regulatory databases, enterprise software publications, logistics industry reports, and authoritative trade statistics organizations. Key sources included the US Department of Commerce Bureau of Industry and Security, European Commission Directorate-General for Internal Market, Industry, Entrepreneurship and SMEs (DG GROW), International Trade Administration (ITA), US Census Bureau Foreign Trade Division, Eurostat International Trade Database, World Trade Organization (WTO) Trade Statistics, International Monetary Fund (IMF) World Economic Outlook, World Bank Logistics Performance Index, US Bureau of Labor Statistics Occupational Employment Data, National Institute of Standards and Technology (NIST), International Organization for Standardization (ISO) Technical Committees on Supply Chain Management, Association for Supply Chain Management (ASCM), Council of Supply Chain Management Professionals (CSCMP), Gartner Research, IDC MarketScape, and regional logistics authority reports from key markets.

Enterprise software adoption statistics, cloud infrastructure deployment data, trade flow analysis, regulatory compliance requirements, digital transformation trends, and competitive landscape mapping for supply chain analytics software, predictive analytics platforms, inventory optimization solutions, and logistics visibility technologies were gathered using these sources.


Primary Research

Qualitative and quantitative insights were obtained by interviewing supply-side and demand-side stakeholders during the primary research process. CEOs, CTOs, VPs of Product Development, leaders of Analytics Solutions, and regional sales directors from enterprise software vendors, cloud service providers, supply chain software developers, and systems integrators comprised the supply-side sources. Directors of Procurement, Chief Supply Chain Officers, Vice Presidents of Logistics, Inventory Managers from retail conglomerates, manufacturing enterprises, third-party logistics (3PL) providers, healthcare distribution networks, and e-commerce operations comprised demand-side sources. Market segmentation was validated across deployment models, product roadmap timelines were confirmed, and insights regarding SaaS adoption patterns, implementation challenges, integration with existing ERP systems, and ROI metrics for analytics investments were gathered through primary research.

Primary Respondent Breakdown:

By Designation: C-level Primaries (32%), Director Level (30%), Others (38%)

By Region: North America (40%), Europe (25%), Asia-Pacific (22%), Rest of World (13%)


Market Size Estimation

Revenue mapping and enterprise deployment volume analysis were employed to determine global market valuation. The methodology comprised the following:

Identification of over 50 significant technology vendors and service providers in North America, Europe, Asia-Pacific, Latin America, and the Middle East and Africa

Professional services (consulting, implementation, managed services), supporting hardware infrastructure, and software platforms (demand forecasting, inventory optimization, supplier risk analytics) are all utilized in the solution mapping process.

Examination of annual revenues that are reported and modeled with respect to cloud-based subscription metrics and supply chain analytics portfolios

In 2024, the coverage of vendors will account for 75-80% of the global market share.

Derive segment-specific valuations for the retail, manufacturing, logistics, and healthcare end-use sectors through extrapolation using bottom-up (enterprise deployment volumes × average contract value by industry vertical and region) and top-down (vendor revenue validation and IT spending pattern analysis) approaches.

Download Free Sample

Kindly complete the form below to receive a free sample of this Report

Download PDF ×

We do not share your information with anyone. However, we may send you emails based on your report interest from time to time. You may contact us at any time to opt-out.

















