×
  • Cat-intel
  • MedIntelliX
  • Resources
  • About Us
  • Hero Background
    English
    Chinese
    French
    Japanese
    Korean
    German
    Spanish

    Supply Chain Analytics Market Share

    ID: MRFR/ICT/4065-CR
    200 Pages
    Aarti Dhapte
    July 2025

    Supply Chain Analytics Market Research Report By Component (Software, Services, Hardware), By Deployment Type (On-Premises, Cloud), By Application (Inventory Management, Demand Forecasting, Supplier Management, Order Management), By End Use Industry (Retail, Manufacturing, Logistics, Healthcare) and By Regional (North America, Europe, South America, Asia Pacific, Middle East and Africa) - Forec...

    Share:
    Download PDF ×

    We do not share your information with anyone. However, we may send you emails based on your report interest from time to time. You may contact us at any time to opt-out.

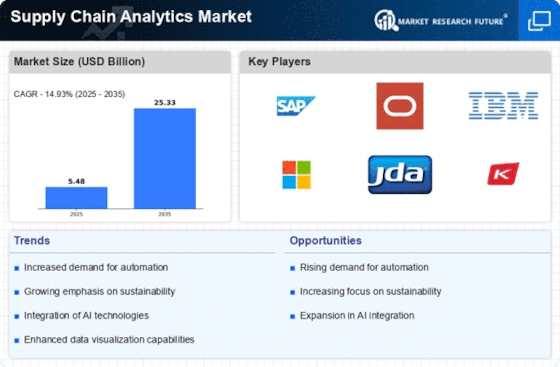
    Supply Chain Analytics Market Infographic
    Purchase Options

    Market Share

    Supply Chain Analytics Market Share Analysis

    The Supply Chain Analytics Market is a dynamic and rapidly evolving sector that plays a crucial role in enhancing the efficiency and effectiveness of supply chain operations for businesses worldwide. Several market factors contribute to the growth and development of this market, shaping its landscape and influencing its trajectory.

    One key factor driving the demand for supply chain analytics solutions is the increasing complexity of global supply chains. As businesses expand their operations globally, the need for real-time visibility, predictive analytics, and data-driven decision-making becomes paramount. Supply chain analytics provides companies with the tools to analyze vast amounts of data, identify patterns, and gain actionable insights, enabling them to optimize their supply chain processes and improve overall performance.

    Another significant market factor is the rising awareness of the importance of data-driven decision-making. Companies are recognizing the value of leveraging data to make informed strategic and operational decisions. Supply chain analytics empowers organizations to harness the potential of big data, enabling them to make data-driven predictions, mitigate risks, and capitalize on opportunities. This growing awareness is driving the adoption of supply chain analytics solutions across various industries.

    The advent of advanced technologies, such as artificial intelligence (AI) and machine learning (ML), is also contributing to the expansion of the supply chain analytics market. These technologies enable more sophisticated data analysis, allowing businesses to gain deeper insights into their supply chain processes. AI and ML algorithms can identify trends, anomalies, and correlations within large datasets, facilitating better decision-making and optimizing supply chain operations.

    Furthermore, the increasing emphasis on cost reduction and operational efficiency is a critical market factor. Businesses are under constant pressure to streamline their supply chain processes, reduce costs, and improve overall efficiency. Supply chain analytics provides the necessary tools to identify inefficiencies, optimize inventory levels, and enhance demand forecasting, leading to cost savings and improved operational performance.

    The demand for real-time analytics is another driving force in the supply chain analytics market. In today's fast-paced business environment, companies require instant access to relevant and accurate information to make timely decisions. Real-time analytics capabilities offered by supply chain analytics solutions enable organizations to monitor and respond to changes in the supply chain promptly, ensuring agility and responsiveness.

    Moreover, the increasing focus on sustainability and environmental considerations is influencing the supply chain analytics market. Companies are recognizing the importance of incorporating sustainable practices into their supply chain processes. Analytics tools enable organizations to track and analyze the environmental impact of their supply chain activities, identify areas for improvement, and implement eco-friendly initiatives.

    In conclusion, the Supply Chain Analytics Market is shaped by a combination of factors that reflect the evolving needs and challenges of today's business landscape. The increasing complexity of global supply chains, the growing awareness of data-driven decision-making, advancements in technology, the emphasis on cost reduction and efficiency, the demand for real-time analytics, and the focus on sustainability collectively drive the adoption of supply chain analytics solutions. As businesses continue to navigate a rapidly changing environment, the role of supply chain analytics in providing actionable insights and driving operational excellence is set to become even more critical in the years to come.

    Author
    Aarti Dhapte
    Team Lead - Research

    She holds an experience of about 6+ years in Market Research and Business Consulting, working under the spectrum of Information Communication Technology, Telecommunications and Semiconductor domains. Aarti conceptualizes and implements a scalable business strategy and provides strategic leadership to the clients. Her expertise lies in market estimation, competitive intelligence, pipeline analysis, customer assessment, etc.

    Leave a Comment

    FAQs

    What is the current valuation of the Supply Chain Analytics Market?

    The Supply Chain Analytics Market was valued at 5.48 USD Billion in 2024.

    What is the projected market size for the Supply Chain Analytics Market by 2035?

    The market is projected to reach 25.33 USD Billion by 2035.

    What is the expected CAGR for the Supply Chain Analytics Market during the forecast period?

    The expected CAGR for the Supply Chain Analytics Market from 2025 to 2035 is 14.93%.

    Which companies are considered key players in the Supply Chain Analytics Market?

    Key players include SAP, Oracle, IBM, Microsoft, JDA Software, Kinaxis, Manhattan Associates, Infor, and Blue Yonder.

    What are the main components of the Supply Chain Analytics Market?

    The main components include Software, Services, and Hardware, with Software projected to grow from 2.19 to 10.88 USD Billion.

    How is the Supply Chain Analytics Market segmented by deployment type?

    The market is segmented into On-Premises and Cloud, with Cloud expected to grow from 3.29 to 14.66 USD Billion.

    What applications are driving growth in the Supply Chain Analytics Market?

    Key applications include Inventory Management, Demand Forecasting, Supplier Management, and Order Management, with Order Management projected to grow from 2.0 to 9.63 USD Billion.

    Which end-use industries are most prominent in the Supply Chain Analytics Market?

    Prominent end-use industries include Retail, Manufacturing, Logistics, and Healthcare, with Retail expected to grow from 1.64 to 7.45 USD Billion.

    What was the valuation of the Services segment in 2024?

    The Services segment was valued at 2.09 USD Billion in 2024.

    What is the projected growth for the Hardware segment by 2035?

    The Hardware segment is projected to grow from 1.2 to 4.2 USD Billion by 2035.

    Market Summary

    As per MRFR analysis, the Supply Chain Analytics Market Size was estimated at 5.48 USD Billion in 2024. The Supply Chain Analytics industry is projected to grow from 6.298 USD Billion in 2025 to 25.33 USD Billion by 2035, exhibiting a compound annual growth rate (CAGR) of 14.93 during the forecast period 2025 - 2035.

    Key Market Trends & Highlights

    The Supply Chain Analytics Market is poised for substantial growth driven by technological advancements and evolving consumer demands.

    • North America remains the largest market for supply chain analytics, driven by its advanced technological infrastructure.
    • Asia-Pacific is emerging as the fastest-growing region, reflecting a surge in digital transformation initiatives.
    • The software segment dominates the market, while the services segment is experiencing rapid growth due to increasing demand for tailored solutions.
    • Rising demand for efficiency and a heightened focus on data-driven decision making are key drivers propelling market expansion.

    Market Size & Forecast

    2024 Market Size 5.48 (USD Billion)
    2035 Market Size 25.33 (USD Billion)
    CAGR (2025 - 2035) 14.93%
    Largest Regional Market Share in 2024 North America

    Major Players

    <p>SAP (DE), Oracle (US), IBM (US), Microsoft (US), JDA Software (US), Kinaxis (CA), Manhattan Associates (US), Infor (US), Blue Yonder (US)</p>

    Market Trends

    The Supply Chain Analytics Market is currently experiencing a transformative phase, driven by advancements in technology and the increasing complexity of global supply chains. Organizations are increasingly recognizing the value of data-driven decision-making, which enhances operational efficiency and responsiveness. As businesses strive to optimize their supply chain processes, the integration of analytics tools has become essential. This trend is further fueled by the growing demand for real-time insights, enabling companies to adapt swiftly to market fluctuations and consumer preferences. Moreover, the emphasis on sustainability and ethical sourcing is prompting firms to leverage analytics for better resource management and reduced environmental impact. In addition, the Supply Chain Analytics Market is witnessing a surge in the adoption of artificial intelligence and machine learning technologies. These innovations facilitate predictive analytics, allowing organizations to forecast demand more accurately and manage inventory levels effectively. Furthermore, the rise of cloud-based solutions is enhancing accessibility and collaboration among supply chain partners, fostering a more interconnected ecosystem. As the market evolves, it appears poised for continued growth, with businesses increasingly investing in analytics capabilities to gain a competitive edge and drive long-term success.

    Integration of Advanced Technologies

    The Supply Chain Analytics Market is seeing a notable integration of advanced technologies such as artificial intelligence and machine learning. These tools enable organizations to analyze vast amounts of data, leading to improved forecasting and decision-making capabilities. As firms adopt these technologies, they can enhance their operational efficiency and responsiveness to market changes.

    Focus on Real-Time Data

    There is a growing emphasis on real-time data analytics within the Supply Chain Analytics Market. Companies are increasingly seeking tools that provide immediate insights into their supply chain operations. This trend allows businesses to react promptly to disruptions and optimize their processes, ultimately improving customer satisfaction.

    Sustainability and Ethical Sourcing

    Sustainability has emerged as a critical focus in the Supply Chain Analytics Market. Organizations are leveraging analytics to ensure ethical sourcing and reduce their environmental footprint. This trend reflects a broader commitment to corporate social responsibility, as companies strive to align their supply chain practices with sustainable principles.

    Supply Chain Analytics Market Market Drivers

    Rising Demand for Efficiency

    The Supply Chain Analytics Market is experiencing a notable surge in demand for enhanced operational efficiency. Organizations are increasingly recognizing the necessity of optimizing their supply chain processes to reduce costs and improve service levels. According to recent data, companies that implement advanced analytics can achieve up to a 20% reduction in operational costs. This trend is driven by the need to streamline logistics, inventory management, and demand forecasting. As businesses strive to remain competitive, the adoption of analytics tools that provide actionable insights is becoming paramount. The Supply Chain Analytics Market is thus poised for growth as firms seek to leverage data-driven strategies to enhance their overall performance.

    Regulatory Compliance and Standards

    The Supply Chain Analytics Market is also influenced by the growing need for regulatory compliance and adherence to industry standards. As governments and regulatory bodies implement stricter guidelines regarding supply chain transparency and sustainability, organizations are compelled to adopt analytics solutions that ensure compliance. This trend is particularly evident in industries such as food and pharmaceuticals, where traceability is paramount. Companies that leverage analytics to monitor compliance can enhance their operational integrity and avoid potential penalties. The increasing complexity of regulations is likely to drive investment in supply chain analytics, thereby propelling growth within the Supply Chain Analytics Market.

    Growing Importance of Risk Management

    Risk management has become a critical focus within the Supply Chain Analytics Market. Organizations are increasingly aware of the vulnerabilities within their supply chains and are seeking analytics solutions to identify and mitigate risks. The ability to predict potential disruptions, such as supplier failures or geopolitical issues, is essential for maintaining operational continuity. Data indicates that companies that proactively manage supply chain risks can reduce their exposure to disruptions by up to 50%. This heightened emphasis on risk management is driving the demand for sophisticated analytics tools that provide real-time insights and scenario planning capabilities, thereby fostering growth in the Supply Chain Analytics Market.

    Increased Focus on Data-Driven Decision Making

    In the Supply Chain Analytics Market, there is a marked shift towards data-driven decision making. Organizations are increasingly utilizing analytics to inform their strategic choices, which is evident in the growing investment in data analytics technologies. Reports indicate that companies employing data analytics in their supply chain operations can improve their forecasting accuracy by as much as 30%. This trend underscores the importance of harnessing data to gain insights into consumer behavior, market trends, and operational efficiencies. As businesses continue to prioritize data-driven strategies, the Supply Chain Analytics Market is likely to expand, driven by the need for informed decision-making processes.

    Emergence of Artificial Intelligence and Machine Learning

    The integration of artificial intelligence (AI) and machine learning (ML) technologies is transforming the Supply Chain Analytics Market. These advanced technologies enable organizations to analyze vast amounts of data quickly and accurately, leading to improved predictive analytics capabilities. The implementation of AI and ML can enhance supply chain visibility and responsiveness, allowing companies to anticipate disruptions and optimize their operations. Current estimates suggest that the adoption of AI in supply chain management could lead to a potential increase in productivity by 40%. As these technologies continue to evolve, the Supply Chain Analytics Market is expected to witness significant advancements and innovations.

    Market Segment Insights

    By Component: Software (Largest) vs. Services (Fastest-Growing)

    <p>The Supply Chain Analytics Market reveals a significant distribution of market share among the component segments, with Software leading the charge. It commands the largest share, driven by its essential role in data analysis and decision-making processes. Following closely, Services have emerged as a dynamic segment, capturing attention for their ability to enhance software utilization and streamline supply chain operations. The Hardware component, although important, plays a supporting role in the overall ecosystem, providing the necessary infrastructure for software and services to thrive. Growth trends in the Supply Chain Analytics Market are increasingly influenced by the need for more agile and efficient supply chain processes. As global competition intensifies, organizations are recognizing the value of real-time insights provided by analytics. Software continues to evolve, integrating AI and machine learning to further refine data analysis capabilities. Meanwhile, the Services segment is experiencing rapid growth due to a rising demand for expert consultancy and implementation support, positioning it as a crucial area for investment and development in the coming years.</p>

    <p>Software (Dominant) vs. Services (Emerging)</p>

    <p>Software in the Supply Chain Analytics Market is a dominant force, acting as the backbone of modern logistics management. It offers powerful data visualization, predictive analytics, and reporting functions, enabling businesses to make informed decisions swiftly. The key characteristics of this component include its ability to integrate seamlessly with existing systems, making it vital for operational efficiency. As companies strive for digital transformation, Software solutions continue to evolve, incorporating advanced technologies like AI and machine learning. On the other hand, the Services segment is emerging as an essential companion to Software, focusing on consultancy, implementation, and ongoing support. This growing focus on Services benefits companies by ensuring they fully leverage their software investments, driving both innovation and competitive advantage.</p>

    By Deployment Type: Cloud (Largest) vs. On-Premises (Fastest-Growing)

    <p>In the Supply Chain Analytics Market, the deployment type is notably polarized between cloud and on-premises solutions. Cloud deployment holds the majority share, driven by its scalability, ease of access, and lower initial investment. As more companies adopt cloud technology, this segment is expected to remain dominant, appealing particularly to smaller enterprises looking for affordable analytics solutions. On the other hand, on-premises solutions, while currently holding a smaller market share, are experiencing rapid adoption due to businesses’ need for enhanced data security and control over their analytics processes.</p>

    <p>Deployment Type: Cloud (Dominant) vs. On-Premises (Emerging)</p>

    <p>The cloud deployment model in the Supply Chain Analytics Market is characterized by its flexibility and broad accessibility, allowing companies to easily scale their analytics capabilities according to demand. This model benefits from lower upfront costs and reduced maintenance overheads, making it attractive for companies across various sizes. Conversely, on-premises solutions are positioned as an emerging choice for businesses prioritizing data security and compliance. These solutions provide organizations with full control over their analytics infrastructure, despite requiring more significant initial investments. As cybersecurity concerns heighten, the on-premises segment is witnessing a swift growth trajectory, catering to industries where data sensitivity is a critical factor.</p>

    By Application: Inventory Management (Largest) vs. Demand Forecasting (Fastest-Growing)

    <p>The application segment of the Supply Chain Analytics Market showcases distinct values that cater to varying needs. Inventory Management holds the largest share, allowing organizations to optimize stock levels and reduce holding costs. On the other hand, Demand Forecasting emerges rapidly, employing data analytics to predict consumer demand accurately. This balance between the two applications demonstrates a robust interest in both managing current assets and anticipating future requirements.</p>

    <p>Inventory Management (Dominant) vs. Demand Forecasting (Emerging)</p>

    <p>Inventory Management has established itself as the dominant application in supply chain analytics, facilitating real-time tracking and management of stock levels, thus ensuring operational efficiency. It focuses on minimizing excess inventory while meeting customer demands seamlessly. In contrast, Demand Forecasting is gaining traction as an emerging application, leveraging advanced predictive analytics to estimate future market behavior. This growing application helps businesses prepare for fluctuations in demand, allowing them to align production and supply chain strategies accordingly. Together, these applications signify a comprehensive approach to managing inventory effectively while forecasting demand levels.</p>

    By End Use Industry: Retail (Largest) vs. Logistics (Fastest-Growing)

    <p>In the Supply Chain Analytics Market, the distribution of market share among the end-use industries reveals that the retail sector holds the largest share, primarily due to the increased demand for data-driven decisions and enhanced customer experiences. Retailers are leveraging advanced analytics to optimize inventory, streamline operations, and improve their supply chain efficiency, enabling them to respond swiftly to market changes and consumer trends. Conversely, the logistics industry is noted as the fastest-growing segment within the market. This growth is driven by the rise in e-commerce, demand for real-time tracking, and the necessity for efficient delivery systems. Companies are increasingly adopting supply chain analytics solutions to enhance operational visibility and optimize their logistics processes, thereby fueling this rapid expansion.</p>

    <p>Retail: Dominant vs. Logistics: Emerging</p>

    <p>In the realm of Supply Chain Analytics, the retail sector exemplifies dominance through its widespread application of analytics to boost efficiency and customer satisfaction. Retail companies are utilizing sophisticated predictive analytics, which aids in demand forecasting and inventory management, enabling them to enhance their competitiveness in a saturated market. On the other hand, logistics is emerging as a critical segment, driven by innovations such as IoT and big data analytics, allowing for improved shipment tracking and dynamic routing capabilities. As e-commerce flourishes, logistics analytics is expected to evolve significantly, unlocking new efficiencies and creating opportunities for growth, positioning it favorably in the market.</p>

    Get more detailed insights about Supply Chain Analytics Market Research Report - Global Forecast till 2035

    Regional Insights

    North America : Innovation and Leadership Hub

    North America is the largest market for supply chain analytics, holding approximately 45% of the global share. The region's growth is driven by advanced technology adoption, increasing demand for real-time data analytics, and stringent regulatory frameworks that promote transparency and efficiency. The U.S. and Canada are the leading countries, with significant investments in AI and machine learning technologies enhancing supply chain operations. The competitive landscape is robust, featuring key players like SAP, Oracle, and IBM, which are continuously innovating to meet market demands. The presence of major tech firms and a strong startup ecosystem further fuels growth. Additionally, government initiatives aimed at digital transformation in logistics and supply chain management are expected to bolster market expansion in the coming years.

    Europe : Emerging Market with Regulations

    Europe is witnessing significant growth in the supply chain analytics market, accounting for about 30% of the global share. The region's expansion is driven by increasing regulatory requirements for data management and sustainability, alongside a growing emphasis on digital transformation across industries. Countries like Germany and the UK are at the forefront, leveraging advanced analytics to enhance operational efficiency and compliance with EU regulations. The competitive landscape is characterized by a mix of established players and innovative startups. Key companies such as SAP and Oracle are prominent, but local firms are also gaining traction by offering tailored solutions. The European market is increasingly focused on sustainability and ethical supply chain practices, which are becoming essential for compliance and competitive advantage.

    Asia-Pacific : Rapid Growth and Adoption

    Asia-Pacific is rapidly emerging as a significant player in the supply chain analytics market, holding approximately 20% of the global share. The region's growth is fueled by increasing urbanization, a booming e-commerce sector, and the adoption of advanced technologies like IoT and AI. Countries such as China and India are leading this growth, driven by their vast manufacturing capabilities and a growing focus on optimizing supply chain processes. The competitive landscape is diverse, with both The Supply Chain Analytics share. Companies like IBM and Microsoft are expanding their presence, while regional firms are innovating to cater to local needs. Government initiatives aimed at enhancing logistics infrastructure and digital capabilities are expected to further accelerate market growth in the coming years.

    Middle East and Africa : Resource-Rich and Developing

    The Middle East and Africa region is gradually developing its supply chain analytics market, currently holding about 5% of the global share. The growth is driven by increasing investments in infrastructure, a rising focus on digital transformation, and the need for efficient supply chain management in various sectors. Countries like South Africa and the UAE are leading the charge, with government initiatives aimed at enhancing logistics and trade efficiency. The competitive landscape is still emerging, with a mix of international players and local firms. Key players are beginning to establish a foothold, but the market remains fragmented. As governments prioritize economic diversification and technological advancement, the demand for supply chain analytics solutions is expected to grow significantly in the coming years.

    Key Players and Competitive Insights

    The Supply Chain Analytics Market is currently characterized by a dynamic competitive landscape, driven by the increasing demand for data-driven decision-making and operational efficiency. Key players such as SAP (DE), Oracle (US), and IBM (US) are at the forefront, leveraging their technological prowess to enhance supply chain visibility and responsiveness. SAP (DE) focuses on integrating advanced analytics with its existing ERP solutions, thereby enabling businesses to optimize their supply chains holistically. Oracle (US), on the other hand, emphasizes cloud-based solutions that facilitate real-time data access and predictive analytics, positioning itself as a leader in digital transformation. IBM (US) is investing heavily in AI and machine learning capabilities to provide actionable insights, which collectively shapes a competitive environment that is increasingly reliant on technological innovation and strategic partnerships.

    The market structure appears moderately fragmented, with a mix of established players and emerging startups. Key business tactics include localizing manufacturing and optimizing supply chains to enhance resilience and responsiveness. The collective influence of these major players fosters a competitive atmosphere where agility and adaptability are paramount. Companies are increasingly focusing on supply chain optimization strategies that not only reduce costs but also improve service levels, thereby enhancing customer satisfaction.

    In August 2025, SAP (DE) announced a strategic partnership with a leading logistics provider to enhance its supply chain analytics capabilities. This collaboration aims to integrate real-time logistics data into SAP's analytics platform, allowing clients to gain deeper insights into their supply chain operations. The strategic importance of this partnership lies in its potential to provide customers with a more comprehensive view of their supply chains, thereby enabling better decision-making and improved operational efficiency.

    In September 2025, Oracle (US) launched a new suite of AI-driven analytics tools designed specifically for supply chain management. This initiative reflects Oracle's commitment to innovation and its focus on providing clients with advanced predictive capabilities. The introduction of these tools is likely to enhance Oracle's competitive positioning by offering clients the ability to anticipate disruptions and optimize inventory levels, thus driving greater supply chain resilience.

    In July 2025, IBM (US) expanded its AI-driven supply chain solutions by acquiring a startup specializing in blockchain technology. This acquisition is expected to enhance IBM's offerings by integrating blockchain's transparency and security features into its supply chain analytics. The strategic significance of this move lies in its potential to provide clients with a more secure and efficient way to track and manage their supply chains, thereby addressing growing concerns around data integrity and security.

    As of October 2025, the competitive trends in the Supply Chain Analytics Market are increasingly defined by digitalization, sustainability, and the integration of AI technologies. Strategic alliances are becoming more prevalent, as companies recognize the need to collaborate to enhance their technological capabilities and market reach. Looking ahead, competitive differentiation is likely to evolve from traditional price-based competition to a focus on innovation, technology integration, and supply chain reliability. This shift underscores the importance of leveraging advanced analytics and technology to create more resilient and responsive supply chains.

    Key Companies in the Supply Chain Analytics Market market include

    Industry Developments

    • Q2 2024: SAP launches new AI-powered supply chain analytics suite SAP announced the launch of an advanced AI-driven analytics platform designed to enhance real-time visibility and predictive capabilities for global supply chains, targeting large enterprise customers.
    • Q2 2024: Blue Yonder acquires One Network Enterprises to expand supply chain analytics portfolio Blue Yonder completed the acquisition of One Network Enterprises, aiming to integrate advanced multi-enterprise analytics and real-time data sharing into its supply chain solutions.
    • Q3 2024: FourKites raises $80 million to accelerate AI-driven supply chain analytics development Supply chain visibility platform FourKites secured $80 million in new funding to expand its AI analytics capabilities and support global expansion.
    • Q2 2024: Oracle unveils new supply chain analytics features in Oracle Fusion Cloud Oracle introduced enhanced analytics modules for its Fusion Cloud Supply Chain platform, offering predictive insights and automated anomaly detection for logistics and inventory management.
    • Q1 2024: Kinaxis announces partnership with Google Cloud to deliver next-gen supply chain analytics Kinaxis and Google Cloud entered a strategic partnership to co-develop advanced analytics solutions for supply chain planning and risk management, leveraging Google’s AI infrastructure.
    • Q2 2024: Infor launches new supply chain analytics application for manufacturing sector Infor released a specialized analytics application aimed at manufacturers, providing real-time supply chain performance dashboards and predictive demand planning tools.
    • Q3 2024: Project44 acquires ClearMetal to boost supply chain analytics and AI capabilities Project44 acquired ClearMetal, a supply chain AI and analytics startup, to enhance its predictive analytics and real-time shipment visibility offerings.
    • Q2 2024: IBM and Maersk expand partnership to deliver blockchain-enabled supply chain analytics IBM and Maersk announced an expanded partnership to integrate blockchain-based analytics into global shipping operations, aiming to improve transparency and efficiency.
    • Q1 2024: Coupa Software launches AI-powered supply chain risk analytics tool Coupa Software introduced a new AI-driven analytics tool designed to help enterprises identify and mitigate supply chain risks in real time.
    • Q2 2025: o9 Solutions secures $120 million funding to expand supply chain analytics platform o9 Solutions raised $120 million in a new funding round to accelerate the development of its AI-powered supply chain analytics and planning platform.
    • Q1 2025: Manhattan Associates launches cloud-native supply chain analytics suite Manhattan Associates released a new cloud-native analytics suite for supply chain management, featuring real-time dashboards and advanced scenario modeling.
    • Q2 2025: Siemens Digital Industries Software acquires supply chain analytics startup Llamasoft Siemens Digital Industries Software acquired Llamasoft to integrate advanced supply chain analytics and AI-driven optimization into its digital manufacturing solutions.

    Future Outlook

    Supply Chain Analytics Market Future Outlook

    <p>The Supply Chain Analytics Market is projected to grow at a 14.93% CAGR from 2024 to 2035, driven by advancements in AI, big data, and demand for operational efficiency.</p>

    New opportunities lie in:

    • <p>Integration of AI-driven predictive analytics tools</p>
    • <p>Development of real-time supply chain visibility platforms</p>
    • <p>Expansion of blockchain technology for enhanced traceability</p>

    <p>By 2035, the market is expected to be robust, driven by innovative solutions and increased demand.</p>

    Market Segmentation

    Supply Chain Analytics Market Component Outlook

    • Software
    • Services
    • Hardware

    Supply Chain Analytics Market Application Outlook

    • Inventory Management
    • Demand Forecasting
    • Supplier Management
    • Order Management

    Supply Chain Analytics Market Deployment Type Outlook

    • On-Premises
    • Cloud

    Supply Chain Analytics Market End Use Industry Outlook

    • Retail
    • Manufacturing
    • Logistics
    • Healthcare

    Report Scope

    MARKET SIZE 20245.48(USD Billion)
    MARKET SIZE 20256.298(USD Billion)
    MARKET SIZE 203525.33(USD Billion)
    COMPOUND ANNUAL GROWTH RATE (CAGR)14.93% (2024 - 2035)
    REPORT COVERAGERevenue Forecast, Competitive Landscape, Growth Factors, and Trends
    BASE YEAR2024
    Market Forecast Period2025 - 2035
    Historical Data2019 - 2024
    Market Forecast UnitsUSD Billion
    Key Companies ProfiledMarket analysis in progress
    Segments CoveredMarket segmentation analysis in progress
    Key Market OpportunitiesIntegration of artificial intelligence and machine learning enhances predictive capabilities in the Supply Chain Analytics Market.
    Key Market DynamicsRising demand for real-time data analytics drives innovation and competition in the Supply Chain Analytics Market.
    Countries CoveredNorth America, Europe, APAC, South America, MEA

    FAQs

    What is the current valuation of the Supply Chain Analytics Market?

    The Supply Chain Analytics Market was valued at 5.48 USD Billion in 2024.

    What is the projected market size for the Supply Chain Analytics Market by 2035?

    The market is projected to reach 25.33 USD Billion by 2035.

    What is the expected CAGR for the Supply Chain Analytics Market during the forecast period?

    The expected CAGR for the Supply Chain Analytics Market from 2025 to 2035 is 14.93%.

    Which companies are considered key players in the Supply Chain Analytics Market?

    Key players include SAP, Oracle, IBM, Microsoft, JDA Software, Kinaxis, Manhattan Associates, Infor, and Blue Yonder.

    What are the main components of the Supply Chain Analytics Market?

    The main components include Software, Services, and Hardware, with Software projected to grow from 2.19 to 10.88 USD Billion.

    How is the Supply Chain Analytics Market segmented by deployment type?

    The market is segmented into On-Premises and Cloud, with Cloud expected to grow from 3.29 to 14.66 USD Billion.

    What applications are driving growth in the Supply Chain Analytics Market?

    Key applications include Inventory Management, Demand Forecasting, Supplier Management, and Order Management, with Order Management projected to grow from 2.0 to 9.63 USD Billion.

    Which end-use industries are most prominent in the Supply Chain Analytics Market?

    Prominent end-use industries include Retail, Manufacturing, Logistics, and Healthcare, with Retail expected to grow from 1.64 to 7.45 USD Billion.

    What was the valuation of the Services segment in 2024?

    The Services segment was valued at 2.09 USD Billion in 2024.

    What is the projected growth for the Hardware segment by 2035?

    The Hardware segment is projected to grow from 1.2 to 4.2 USD Billion by 2035.

    1. SECTION I: EXECUTIVE SUMMARY AND KEY HIGHLIGHTS
      1. | 1.1 EXECUTIVE SUMMARY
      2. | | 1.1.1 Market Overview
      3. | | 1.1.2 Key Findings
      4. | | 1.1.3 Market Segmentation
      5. | | 1.1.4 Competitive Landscape
      6. | | 1.1.5 Challenges and Opportunities
      7. | | 1.1.6 Future Outlook
    2. SECTION II: SCOPING, METHODOLOGY AND MARKET STRUCTURE
      1. | 2.1 MARKET INTRODUCTION
      2. | | 2.1.1 Definition
      3. | | 2.1.2 Scope of the study
      4. | | | 2.1.2.1 Research Objective
      5. | | | 2.1.2.2 Assumption
      6. | | | 2.1.2.3 Limitations
      7. | 2.2 RESEARCH METHODOLOGY
      8. | | 2.2.1 Overview
      9. | | 2.2.2 Data Mining
      10. | | 2.2.3 Secondary Research
      11. | | 2.2.4 Primary Research
      12. | | | 2.2.4.1 Primary Interviews and Information Gathering Process
      13. | | | 2.2.4.2 Breakdown of Primary Respondents
      14. | | 2.2.5 Forecasting Model
      15. | | 2.2.6 Market Size Estimation
      16. | | | 2.2.6.1 Bottom-Up Approach
      17. | | | 2.2.6.2 Top-Down Approach
      18. | | 2.2.7 Data Triangulation
      19. | | 2.2.8 Validation
    3. SECTION III: QUALITATIVE ANALYSIS
      1. | 3.1 MARKET DYNAMICS
      2. | | 3.1.1 Overview
      3. | | 3.1.2 Drivers
      4. | | 3.1.3 Restraints
      5. | | 3.1.4 Opportunities
      6. | 3.2 MARKET FACTOR ANALYSIS
      7. | | 3.2.1 Value chain Analysis
      8. | | 3.2.2 Porter's Five Forces Analysis
      9. | | | 3.2.2.1 Bargaining Power of Suppliers
      10. | | | 3.2.2.2 Bargaining Power of Buyers
      11. | | | 3.2.2.3 Threat of New Entrants
      12. | | | 3.2.2.4 Threat of Substitutes
      13. | | | 3.2.2.5 Intensity of Rivalry
      14. | | 3.2.3 COVID-19 Impact Analysis
      15. | | | 3.2.3.1 Market Impact Analysis
      16. | | | 3.2.3.2 Regional Impact
      17. | | | 3.2.3.3 Opportunity and Threat Analysis
    4. SECTION IV: QUANTITATIVE ANALYSIS
      1. | 4.1 Information and Communications Technology, BY Component (USD Billion)
      2. | | 4.1.1 Software
      3. | | 4.1.2 Services
      4. | | 4.1.3 Hardware
      5. | 4.2 Information and Communications Technology, BY Deployment Type (USD Billion)
      6. | | 4.2.1 On-Premises
      7. | | 4.2.2 Cloud
      8. | 4.3 Information and Communications Technology, BY Application (USD Billion)
      9. | | 4.3.1 Inventory Management
      10. | | 4.3.2 Demand Forecasting
      11. | | 4.3.3 Supplier Management
      12. | | 4.3.4 Order Management
      13. | 4.4 Information and Communications Technology, BY End Use Industry (USD Billion)
      14. | | 4.4.1 Retail
      15. | | 4.4.2 Manufacturing
      16. | | 4.4.3 Logistics
      17. | | 4.4.4 Healthcare
      18. | 4.5 Information and Communications Technology, BY Region (USD Billion)
      19. | | 4.5.1 North America
      20. | | | 4.5.1.1 US
      21. | | | 4.5.1.2 Canada
      22. | | 4.5.2 Europe
      23. | | | 4.5.2.1 Germany
      24. | | | 4.5.2.2 UK
      25. | | | 4.5.2.3 France
      26. | | | 4.5.2.4 Russia
      27. | | | 4.5.2.5 Italy
      28. | | | 4.5.2.6 Spain
      29. | | | 4.5.2.7 Rest of Europe
      30. | | 4.5.3 APAC
      31. | | | 4.5.3.1 China
      32. | | | 4.5.3.2 India
      33. | | | 4.5.3.3 Japan
      34. | | | 4.5.3.4 South Korea
      35. | | | 4.5.3.5 Malaysia
      36. | | | 4.5.3.6 Thailand
      37. | | | 4.5.3.7 Indonesia
      38. | | | 4.5.3.8 Rest of APAC
      39. | | 4.5.4 South America
      40. | | | 4.5.4.1 Brazil
      41. | | | 4.5.4.2 Mexico
      42. | | | 4.5.4.3 Argentina
      43. | | | 4.5.4.4 Rest of South America
      44. | | 4.5.5 MEA
      45. | | | 4.5.5.1 GCC Countries
      46. | | | 4.5.5.2 South Africa
      47. | | | 4.5.5.3 Rest of MEA
    5. SECTION V: COMPETITIVE ANALYSIS
      1. | 5.1 Competitive Landscape
      2. | | 5.1.1 Overview
      3. | | 5.1.2 Competitive Analysis
      4. | | 5.1.3 Market share Analysis
      5. | | 5.1.4 Major Growth Strategy in the Information and Communications Technology
      6. | | 5.1.5 Competitive Benchmarking
      7. | | 5.1.6 Leading Players in Terms of Number of Developments in the Information and Communications Technology
      8. | | 5.1.7 Key developments and growth strategies
      9. | | | 5.1.7.1 New Product Launch/Service Deployment
      10. | | | 5.1.7.2 Merger & Acquisitions
      11. | | | 5.1.7.3 Joint Ventures
      12. | | 5.1.8 Major Players Financial Matrix
      13. | | | 5.1.8.1 Sales and Operating Income
      14. | | | 5.1.8.2 Major Players R&D Expenditure. 2023
      15. | 5.2 Company Profiles
      16. | | 5.2.1 SAP (DE)
      17. | | | 5.2.1.1 Financial Overview
      18. | | | 5.2.1.2 Products Offered
      19. | | | 5.2.1.3 Key Developments
      20. | | | 5.2.1.4 SWOT Analysis
      21. | | | 5.2.1.5 Key Strategies
      22. | | 5.2.2 Oracle (US)
      23. | | | 5.2.2.1 Financial Overview
      24. | | | 5.2.2.2 Products Offered
      25. | | | 5.2.2.3 Key Developments
      26. | | | 5.2.2.4 SWOT Analysis
      27. | | | 5.2.2.5 Key Strategies
      28. | | 5.2.3 IBM (US)
      29. | | | 5.2.3.1 Financial Overview
      30. | | | 5.2.3.2 Products Offered
      31. | | | 5.2.3.3 Key Developments
      32. | | | 5.2.3.4 SWOT Analysis
      33. | | | 5.2.3.5 Key Strategies
      34. | | 5.2.4 Microsoft (US)
      35. | | | 5.2.4.1 Financial Overview
      36. | | | 5.2.4.2 Products Offered
      37. | | | 5.2.4.3 Key Developments
      38. | | | 5.2.4.4 SWOT Analysis
      39. | | | 5.2.4.5 Key Strategies
      40. | | 5.2.5 JDA Software (US)
      41. | | | 5.2.5.1 Financial Overview
      42. | | | 5.2.5.2 Products Offered
      43. | | | 5.2.5.3 Key Developments
      44. | | | 5.2.5.4 SWOT Analysis
      45. | | | 5.2.5.5 Key Strategies
      46. | | 5.2.6 Kinaxis (CA)
      47. | | | 5.2.6.1 Financial Overview
      48. | | | 5.2.6.2 Products Offered
      49. | | | 5.2.6.3 Key Developments
      50. | | | 5.2.6.4 SWOT Analysis
      51. | | | 5.2.6.5 Key Strategies
      52. | | 5.2.7 Manhattan Associates (US)
      53. | | | 5.2.7.1 Financial Overview
      54. | | | 5.2.7.2 Products Offered
      55. | | | 5.2.7.3 Key Developments
      56. | | | 5.2.7.4 SWOT Analysis
      57. | | | 5.2.7.5 Key Strategies
      58. | | 5.2.8 Infor (US)
      59. | | | 5.2.8.1 Financial Overview
      60. | | | 5.2.8.2 Products Offered
      61. | | | 5.2.8.3 Key Developments
      62. | | | 5.2.8.4 SWOT Analysis
      63. | | | 5.2.8.5 Key Strategies
      64. | | 5.2.9 Blue Yonder (US)
      65. | | | 5.2.9.1 Financial Overview
      66. | | | 5.2.9.2 Products Offered
      67. | | | 5.2.9.3 Key Developments
      68. | | | 5.2.9.4 SWOT Analysis
      69. | | | 5.2.9.5 Key Strategies
      70. | 5.3 Appendix
      71. | | 5.3.1 References
      72. | | 5.3.2 Related Reports
    6. LIST OF FIGURES
      1. | 6.1 MARKET SYNOPSIS
      2. | 6.2 NORTH AMERICA MARKET ANALYSIS
      3. | 6.3 US MARKET ANALYSIS BY COMPONENT
      4. | 6.4 US MARKET ANALYSIS BY DEPLOYMENT TYPE
      5. | 6.5 US MARKET ANALYSIS BY APPLICATION
      6. | 6.6 US MARKET ANALYSIS BY END USE INDUSTRY
      7. | 6.7 CANADA MARKET ANALYSIS BY COMPONENT
      8. | 6.8 CANADA MARKET ANALYSIS BY DEPLOYMENT TYPE
      9. | 6.9 CANADA MARKET ANALYSIS BY APPLICATION
      10. | 6.10 CANADA MARKET ANALYSIS BY END USE INDUSTRY
      11. | 6.11 EUROPE MARKET ANALYSIS
      12. | 6.12 GERMANY MARKET ANALYSIS BY COMPONENT
      13. | 6.13 GERMANY MARKET ANALYSIS BY DEPLOYMENT TYPE
      14. | 6.14 GERMANY MARKET ANALYSIS BY APPLICATION
      15. | 6.15 GERMANY MARKET ANALYSIS BY END USE INDUSTRY
      16. | 6.16 UK MARKET ANALYSIS BY COMPONENT
      17. | 6.17 UK MARKET ANALYSIS BY DEPLOYMENT TYPE
      18. | 6.18 UK MARKET ANALYSIS BY APPLICATION
      19. | 6.19 UK MARKET ANALYSIS BY END USE INDUSTRY
      20. | 6.20 FRANCE MARKET ANALYSIS BY COMPONENT
      21. | 6.21 FRANCE MARKET ANALYSIS BY DEPLOYMENT TYPE
      22. | 6.22 FRANCE MARKET ANALYSIS BY APPLICATION
      23. | 6.23 FRANCE MARKET ANALYSIS BY END USE INDUSTRY
      24. | 6.24 RUSSIA MARKET ANALYSIS BY COMPONENT
      25. | 6.25 RUSSIA MARKET ANALYSIS BY DEPLOYMENT TYPE
      26. | 6.26 RUSSIA MARKET ANALYSIS BY APPLICATION
      27. | 6.27 RUSSIA MARKET ANALYSIS BY END USE INDUSTRY
      28. | 6.28 ITALY MARKET ANALYSIS BY COMPONENT
      29. | 6.29 ITALY MARKET ANALYSIS BY DEPLOYMENT TYPE
      30. | 6.30 ITALY MARKET ANALYSIS BY APPLICATION
      31. | 6.31 ITALY MARKET ANALYSIS BY END USE INDUSTRY
      32. | 6.32 SPAIN MARKET ANALYSIS BY COMPONENT
      33. | 6.33 SPAIN MARKET ANALYSIS BY DEPLOYMENT TYPE
      34. | 6.34 SPAIN MARKET ANALYSIS BY APPLICATION
      35. | 6.35 SPAIN MARKET ANALYSIS BY END USE INDUSTRY
      36. | 6.36 REST OF EUROPE MARKET ANALYSIS BY COMPONENT
      37. | 6.37 REST OF EUROPE MARKET ANALYSIS BY DEPLOYMENT TYPE
      38. | 6.38 REST OF EUROPE MARKET ANALYSIS BY APPLICATION
      39. | 6.39 REST OF EUROPE MARKET ANALYSIS BY END USE INDUSTRY
      40. | 6.40 APAC MARKET ANALYSIS
      41. | 6.41 CHINA MARKET ANALYSIS BY COMPONENT
      42. | 6.42 CHINA MARKET ANALYSIS BY DEPLOYMENT TYPE
      43. | 6.43 CHINA MARKET ANALYSIS BY APPLICATION
      44. | 6.44 CHINA MARKET ANALYSIS BY END USE INDUSTRY
      45. | 6.45 INDIA MARKET ANALYSIS BY COMPONENT
      46. | 6.46 INDIA MARKET ANALYSIS BY DEPLOYMENT TYPE
      47. | 6.47 INDIA MARKET ANALYSIS BY APPLICATION
      48. | 6.48 INDIA MARKET ANALYSIS BY END USE INDUSTRY
      49. | 6.49 JAPAN MARKET ANALYSIS BY COMPONENT
      50. | 6.50 JAPAN MARKET ANALYSIS BY DEPLOYMENT TYPE
      51. | 6.51 JAPAN MARKET ANALYSIS BY APPLICATION
      52. | 6.52 JAPAN MARKET ANALYSIS BY END USE INDUSTRY
      53. | 6.53 SOUTH KOREA MARKET ANALYSIS BY COMPONENT
      54. | 6.54 SOUTH KOREA MARKET ANALYSIS BY DEPLOYMENT TYPE
      55. | 6.55 SOUTH KOREA MARKET ANALYSIS BY APPLICATION
      56. | 6.56 SOUTH KOREA MARKET ANALYSIS BY END USE INDUSTRY
      57. | 6.57 MALAYSIA MARKET ANALYSIS BY COMPONENT
      58. | 6.58 MALAYSIA MARKET ANALYSIS BY DEPLOYMENT TYPE
      59. | 6.59 MALAYSIA MARKET ANALYSIS BY APPLICATION
      60. | 6.60 MALAYSIA MARKET ANALYSIS BY END USE INDUSTRY
      61. | 6.61 THAILAND MARKET ANALYSIS BY COMPONENT
      62. | 6.62 THAILAND MARKET ANALYSIS BY DEPLOYMENT TYPE
      63. | 6.63 THAILAND MARKET ANALYSIS BY APPLICATION
      64. | 6.64 THAILAND MARKET ANALYSIS BY END USE INDUSTRY
      65. | 6.65 INDONESIA MARKET ANALYSIS BY COMPONENT
      66. | 6.66 INDONESIA MARKET ANALYSIS BY DEPLOYMENT TYPE
      67. | 6.67 INDONESIA MARKET ANALYSIS BY APPLICATION
      68. | 6.68 INDONESIA MARKET ANALYSIS BY END USE INDUSTRY
      69. | 6.69 REST OF APAC MARKET ANALYSIS BY COMPONENT
      70. | 6.70 REST OF APAC MARKET ANALYSIS BY DEPLOYMENT TYPE
      71. | 6.71 REST OF APAC MARKET ANALYSIS BY APPLICATION
      72. | 6.72 REST OF APAC MARKET ANALYSIS BY END USE INDUSTRY
      73. | 6.73 SOUTH AMERICA MARKET ANALYSIS
      74. | 6.74 BRAZIL MARKET ANALYSIS BY COMPONENT
      75. | 6.75 BRAZIL MARKET ANALYSIS BY DEPLOYMENT TYPE
      76. | 6.76 BRAZIL MARKET ANALYSIS BY APPLICATION
      77. | 6.77 BRAZIL MARKET ANALYSIS BY END USE INDUSTRY
      78. | 6.78 MEXICO MARKET ANALYSIS BY COMPONENT
      79. | 6.79 MEXICO MARKET ANALYSIS BY DEPLOYMENT TYPE
      80. | 6.80 MEXICO MARKET ANALYSIS BY APPLICATION
      81. | 6.81 MEXICO MARKET ANALYSIS BY END USE INDUSTRY
      82. | 6.82 ARGENTINA MARKET ANALYSIS BY COMPONENT
      83. | 6.83 ARGENTINA MARKET ANALYSIS BY DEPLOYMENT TYPE
      84. | 6.84 ARGENTINA MARKET ANALYSIS BY APPLICATION
      85. | 6.85 ARGENTINA MARKET ANALYSIS BY END USE INDUSTRY
      86. | 6.86 REST OF SOUTH AMERICA MARKET ANALYSIS BY COMPONENT
      87. | 6.87 REST OF SOUTH AMERICA MARKET ANALYSIS BY DEPLOYMENT TYPE
      88. | 6.88 REST OF SOUTH AMERICA MARKET ANALYSIS BY APPLICATION
      89. | 6.89 REST OF SOUTH AMERICA MARKET ANALYSIS BY END USE INDUSTRY
      90. | 6.90 MEA MARKET ANALYSIS
      91. | 6.91 GCC COUNTRIES MARKET ANALYSIS BY COMPONENT
      92. | 6.92 GCC COUNTRIES MARKET ANALYSIS BY DEPLOYMENT TYPE
      93. | 6.93 GCC COUNTRIES MARKET ANALYSIS BY APPLICATION
      94. | 6.94 GCC COUNTRIES MARKET ANALYSIS BY END USE INDUSTRY
      95. | 6.95 SOUTH AFRICA MARKET ANALYSIS BY COMPONENT
      96. | 6.96 SOUTH AFRICA MARKET ANALYSIS BY DEPLOYMENT TYPE
      97. | 6.97 SOUTH AFRICA MARKET ANALYSIS BY APPLICATION
      98. | 6.98 SOUTH AFRICA MARKET ANALYSIS BY END USE INDUSTRY
      99. | 6.99 REST OF MEA MARKET ANALYSIS BY COMPONENT
      100. | 6.100 REST OF MEA MARKET ANALYSIS BY DEPLOYMENT TYPE
      101. | 6.101 REST OF MEA MARKET ANALYSIS BY APPLICATION
      102. | 6.102 REST OF MEA MARKET ANALYSIS BY END USE INDUSTRY
      103. | 6.103 KEY BUYING CRITERIA OF INFORMATION AND COMMUNICATIONS TECHNOLOGY
      104. | 6.104 RESEARCH PROCESS OF MRFR
      105. | 6.105 DRO ANALYSIS OF INFORMATION AND COMMUNICATIONS TECHNOLOGY
      106. | 6.106 DRIVERS IMPACT ANALYSIS: INFORMATION AND COMMUNICATIONS TECHNOLOGY
      107. | 6.107 RESTRAINTS IMPACT ANALYSIS: INFORMATION AND COMMUNICATIONS TECHNOLOGY
      108. | 6.108 SUPPLY / VALUE CHAIN: INFORMATION AND COMMUNICATIONS TECHNOLOGY
      109. | 6.109 INFORMATION AND COMMUNICATIONS TECHNOLOGY, BY COMPONENT, 2024 (% SHARE)
      110. | 6.110 INFORMATION AND COMMUNICATIONS TECHNOLOGY, BY COMPONENT, 2024 TO 2035 (USD Billion)
      111. | 6.111 INFORMATION AND COMMUNICATIONS TECHNOLOGY, BY DEPLOYMENT TYPE, 2024 (% SHARE)
      112. | 6.112 INFORMATION AND COMMUNICATIONS TECHNOLOGY, BY DEPLOYMENT TYPE, 2024 TO 2035 (USD Billion)
      113. | 6.113 INFORMATION AND COMMUNICATIONS TECHNOLOGY, BY APPLICATION, 2024 (% SHARE)
      114. | 6.114 INFORMATION AND COMMUNICATIONS TECHNOLOGY, BY APPLICATION, 2024 TO 2035 (USD Billion)
      115. | 6.115 INFORMATION AND COMMUNICATIONS TECHNOLOGY, BY END USE INDUSTRY, 2024 (% SHARE)
      116. | 6.116 INFORMATION AND COMMUNICATIONS TECHNOLOGY, BY END USE INDUSTRY, 2024 TO 2035 (USD Billion)
      117. | 6.117 BENCHMARKING OF MAJOR COMPETITORS
    7. LIST OF TABLES
      1. | 7.1 LIST OF ASSUMPTIONS
      2. | | 7.1.1
      3. | 7.2 North America MARKET SIZE ESTIMATES; FORECAST
      4. | | 7.2.1 BY COMPONENT, 2025-2035 (USD Billion)
      5. | | 7.2.2 BY DEPLOYMENT TYPE, 2025-2035 (USD Billion)
      6. | | 7.2.3 BY APPLICATION, 2025-2035 (USD Billion)
      7. | | 7.2.4 BY END USE INDUSTRY, 2025-2035 (USD Billion)
      8. | 7.3 US MARKET SIZE ESTIMATES; FORECAST
      9. | | 7.3.1 BY COMPONENT, 2025-2035 (USD Billion)
      10. | | 7.3.2 BY DEPLOYMENT TYPE, 2025-2035 (USD Billion)
      11. | | 7.3.3 BY APPLICATION, 2025-2035 (USD Billion)
      12. | | 7.3.4 BY END USE INDUSTRY, 2025-2035 (USD Billion)
      13. | 7.4 Canada MARKET SIZE ESTIMATES; FORECAST
      14. | | 7.4.1 BY COMPONENT, 2025-2035 (USD Billion)
      15. | | 7.4.2 BY DEPLOYMENT TYPE, 2025-2035 (USD Billion)
      16. | | 7.4.3 BY APPLICATION, 2025-2035 (USD Billion)
      17. | | 7.4.4 BY END USE INDUSTRY, 2025-2035 (USD Billion)
      18. | 7.5 Europe MARKET SIZE ESTIMATES; FORECAST
      19. | | 7.5.1 BY COMPONENT, 2025-2035 (USD Billion)
      20. | | 7.5.2 BY DEPLOYMENT TYPE, 2025-2035 (USD Billion)
      21. | | 7.5.3 BY APPLICATION, 2025-2035 (USD Billion)
      22. | | 7.5.4 BY END USE INDUSTRY, 2025-2035 (USD Billion)
      23. | 7.6 Germany MARKET SIZE ESTIMATES; FORECAST
      24. | | 7.6.1 BY COMPONENT, 2025-2035 (USD Billion)
      25. | | 7.6.2 BY DEPLOYMENT TYPE, 2025-2035 (USD Billion)
      26. | | 7.6.3 BY APPLICATION, 2025-2035 (USD Billion)
      27. | | 7.6.4 BY END USE INDUSTRY, 2025-2035 (USD Billion)
      28. | 7.7 UK MARKET SIZE ESTIMATES; FORECAST
      29. | | 7.7.1 BY COMPONENT, 2025-2035 (USD Billion)
      30. | | 7.7.2 BY DEPLOYMENT TYPE, 2025-2035 (USD Billion)
      31. | | 7.7.3 BY APPLICATION, 2025-2035 (USD Billion)
      32. | | 7.7.4 BY END USE INDUSTRY, 2025-2035 (USD Billion)
      33. | 7.8 France MARKET SIZE ESTIMATES; FORECAST
      34. | | 7.8.1 BY COMPONENT, 2025-2035 (USD Billion)
      35. | | 7.8.2 BY DEPLOYMENT TYPE, 2025-2035 (USD Billion)
      36. | | 7.8.3 BY APPLICATION, 2025-2035 (USD Billion)
      37. | | 7.8.4 BY END USE INDUSTRY, 2025-2035 (USD Billion)
      38. | 7.9 Russia MARKET SIZE ESTIMATES; FORECAST
      39. | | 7.9.1 BY COMPONENT, 2025-2035 (USD Billion)
      40. | | 7.9.2 BY DEPLOYMENT TYPE, 2025-2035 (USD Billion)
      41. | | 7.9.3 BY APPLICATION, 2025-2035 (USD Billion)
      42. | | 7.9.4 BY END USE INDUSTRY, 2025-2035 (USD Billion)
      43. | 7.10 Italy MARKET SIZE ESTIMATES; FORECAST
      44. | | 7.10.1 BY COMPONENT, 2025-2035 (USD Billion)
      45. | | 7.10.2 BY DEPLOYMENT TYPE, 2025-2035 (USD Billion)
      46. | | 7.10.3 BY APPLICATION, 2025-2035 (USD Billion)
      47. | | 7.10.4 BY END USE INDUSTRY, 2025-2035 (USD Billion)
      48. | 7.11 Spain MARKET SIZE ESTIMATES; FORECAST
      49. | | 7.11.1 BY COMPONENT, 2025-2035 (USD Billion)
      50. | | 7.11.2 BY DEPLOYMENT TYPE, 2025-2035 (USD Billion)
      51. | | 7.11.3 BY APPLICATION, 2025-2035 (USD Billion)
      52. | | 7.11.4 BY END USE INDUSTRY, 2025-2035 (USD Billion)
      53. | 7.12 Rest of Europe MARKET SIZE ESTIMATES; FORECAST
      54. | | 7.12.1 BY COMPONENT, 2025-2035 (USD Billion)
      55. | | 7.12.2 BY DEPLOYMENT TYPE, 2025-2035 (USD Billion)
      56. | | 7.12.3 BY APPLICATION, 2025-2035 (USD Billion)
      57. | | 7.12.4 BY END USE INDUSTRY, 2025-2035 (USD Billion)
      58. | 7.13 APAC MARKET SIZE ESTIMATES; FORECAST
      59. | | 7.13.1 BY COMPONENT, 2025-2035 (USD Billion)
      60. | | 7.13.2 BY DEPLOYMENT TYPE, 2025-2035 (USD Billion)
      61. | | 7.13.3 BY APPLICATION, 2025-2035 (USD Billion)
      62. | | 7.13.4 BY END USE INDUSTRY, 2025-2035 (USD Billion)
      63. | 7.14 China MARKET SIZE ESTIMATES; FORECAST
      64. | | 7.14.1 BY COMPONENT, 2025-2035 (USD Billion)
      65. | | 7.14.2 BY DEPLOYMENT TYPE, 2025-2035 (USD Billion)
      66. | | 7.14.3 BY APPLICATION, 2025-2035 (USD Billion)
      67. | | 7.14.4 BY END USE INDUSTRY, 2025-2035 (USD Billion)
      68. | 7.15 India MARKET SIZE ESTIMATES; FORECAST
      69. | | 7.15.1 BY COMPONENT, 2025-2035 (USD Billion)
      70. | | 7.15.2 BY DEPLOYMENT TYPE, 2025-2035 (USD Billion)
      71. | | 7.15.3 BY APPLICATION, 2025-2035 (USD Billion)
      72. | | 7.15.4 BY END USE INDUSTRY, 2025-2035 (USD Billion)
      73. | 7.16 Japan MARKET SIZE ESTIMATES; FORECAST
      74. | | 7.16.1 BY COMPONENT, 2025-2035 (USD Billion)
      75. | | 7.16.2 BY DEPLOYMENT TYPE, 2025-2035 (USD Billion)
      76. | | 7.16.3 BY APPLICATION, 2025-2035 (USD Billion)
      77. | | 7.16.4 BY END USE INDUSTRY, 2025-2035 (USD Billion)
      78. | 7.17 South Korea MARKET SIZE ESTIMATES; FORECAST
      79. | | 7.17.1 BY COMPONENT, 2025-2035 (USD Billion)
      80. | | 7.17.2 BY DEPLOYMENT TYPE, 2025-2035 (USD Billion)
      81. | | 7.17.3 BY APPLICATION, 2025-2035 (USD Billion)
      82. | | 7.17.4 BY END USE INDUSTRY, 2025-2035 (USD Billion)
      83. | 7.18 Malaysia MARKET SIZE ESTIMATES; FORECAST
      84. | | 7.18.1 BY COMPONENT, 2025-2035 (USD Billion)
      85. | | 7.18.2 BY DEPLOYMENT TYPE, 2025-2035 (USD Billion)
      86. | | 7.18.3 BY APPLICATION, 2025-2035 (USD Billion)
      87. | | 7.18.4 BY END USE INDUSTRY, 2025-2035 (USD Billion)
      88. | 7.19 Thailand MARKET SIZE ESTIMATES; FORECAST
      89. | | 7.19.1 BY COMPONENT, 2025-2035 (USD Billion)
      90. | | 7.19.2 BY DEPLOYMENT TYPE, 2025-2035 (USD Billion)
      91. | | 7.19.3 BY APPLICATION, 2025-2035 (USD Billion)
      92. | | 7.19.4 BY END USE INDUSTRY, 2025-2035 (USD Billion)
      93. | 7.20 Indonesia MARKET SIZE ESTIMATES; FORECAST
      94. | | 7.20.1 BY COMPONENT, 2025-2035 (USD Billion)
      95. | | 7.20.2 BY DEPLOYMENT TYPE, 2025-2035 (USD Billion)
      96. | | 7.20.3 BY APPLICATION, 2025-2035 (USD Billion)
      97. | | 7.20.4 BY END USE INDUSTRY, 2025-2035 (USD Billion)
      98. | 7.21 Rest of APAC MARKET SIZE ESTIMATES; FORECAST
      99. | | 7.21.1 BY COMPONENT, 2025-2035 (USD Billion)
      100. | | 7.21.2 BY DEPLOYMENT TYPE, 2025-2035 (USD Billion)
      101. | | 7.21.3 BY APPLICATION, 2025-2035 (USD Billion)
      102. | | 7.21.4 BY END USE INDUSTRY, 2025-2035 (USD Billion)
      103. | 7.22 South America MARKET SIZE ESTIMATES; FORECAST
      104. | | 7.22.1 BY COMPONENT, 2025-2035 (USD Billion)
      105. | | 7.22.2 BY DEPLOYMENT TYPE, 2025-2035 (USD Billion)
      106. | | 7.22.3 BY APPLICATION, 2025-2035 (USD Billion)
      107. | | 7.22.4 BY END USE INDUSTRY, 2025-2035 (USD Billion)
      108. | 7.23 Brazil MARKET SIZE ESTIMATES; FORECAST
      109. | | 7.23.1 BY COMPONENT, 2025-2035 (USD Billion)
      110. | | 7.23.2 BY DEPLOYMENT TYPE, 2025-2035 (USD Billion)
      111. | | 7.23.3 BY APPLICATION, 2025-2035 (USD Billion)
      112. | | 7.23.4 BY END USE INDUSTRY, 2025-2035 (USD Billion)
      113. | 7.24 Mexico MARKET SIZE ESTIMATES; FORECAST
      114. | | 7.24.1 BY COMPONENT, 2025-2035 (USD Billion)
      115. | | 7.24.2 BY DEPLOYMENT TYPE, 2025-2035 (USD Billion)
      116. | | 7.24.3 BY APPLICATION, 2025-2035 (USD Billion)
      117. | | 7.24.4 BY END USE INDUSTRY, 2025-2035 (USD Billion)
      118. | 7.25 Argentina MARKET SIZE ESTIMATES; FORECAST
      119. | | 7.25.1 BY COMPONENT, 2025-2035 (USD Billion)
      120. | | 7.25.2 BY DEPLOYMENT TYPE, 2025-2035 (USD Billion)
      121. | | 7.25.3 BY APPLICATION, 2025-2035 (USD Billion)
      122. | | 7.25.4 BY END USE INDUSTRY, 2025-2035 (USD Billion)
      123. | 7.26 Rest of South America MARKET SIZE ESTIMATES; FORECAST
      124. | | 7.26.1 BY COMPONENT, 2025-2035 (USD Billion)
      125. | | 7.26.2 BY DEPLOYMENT TYPE, 2025-2035 (USD Billion)
      126. | | 7.26.3 BY APPLICATION, 2025-2035 (USD Billion)
      127. | | 7.26.4 BY END USE INDUSTRY, 2025-2035 (USD Billion)
      128. | 7.27 MEA MARKET SIZE ESTIMATES; FORECAST
      129. | | 7.27.1 BY COMPONENT, 2025-2035 (USD Billion)
      130. | | 7.27.2 BY DEPLOYMENT TYPE, 2025-2035 (USD Billion)
      131. | | 7.27.3 BY APPLICATION, 2025-2035 (USD Billion)
      132. | | 7.27.4 BY END USE INDUSTRY, 2025-2035 (USD Billion)
      133. | 7.28 GCC Countries MARKET SIZE ESTIMATES; FORECAST
      134. | | 7.28.1 BY COMPONENT, 2025-2035 (USD Billion)
      135. | | 7.28.2 BY DEPLOYMENT TYPE, 2025-2035 (USD Billion)
      136. | | 7.28.3 BY APPLICATION, 2025-2035 (USD Billion)
      137. | | 7.28.4 BY END USE INDUSTRY, 2025-2035 (USD Billion)
      138. | 7.29 South Africa MARKET SIZE ESTIMATES; FORECAST
      139. | | 7.29.1 BY COMPONENT, 2025-2035 (USD Billion)
      140. | | 7.29.2 BY DEPLOYMENT TYPE, 2025-2035 (USD Billion)
      141. | | 7.29.3 BY APPLICATION, 2025-2035 (USD Billion)
      142. | | 7.29.4 BY END USE INDUSTRY, 2025-2035 (USD Billion)
      143. | 7.30 Rest of MEA MARKET SIZE ESTIMATES; FORECAST
      144. | | 7.30.1 BY COMPONENT, 2025-2035 (USD Billion)
      145. | | 7.30.2 BY DEPLOYMENT TYPE, 2025-2035 (USD Billion)
      146. | | 7.30.3 BY APPLICATION, 2025-2035 (USD Billion)
      147. | | 7.30.4 BY END USE INDUSTRY, 2025-2035 (USD Billion)
      148. | 7.31 PRODUCT LAUNCH/PRODUCT DEVELOPMENT/APPROVAL
      149. | | 7.31.1
      150. | 7.32 ACQUISITION/PARTNERSHIP
      151. | | 7.32.1

    Supply Chain Analytics Market Segmentation

    • Supply Chain Analytics Market By Component (USD Billion, 2019-2035)

      • Software
      • Services
      • Hardware


    • Supply Chain Analytics Market By Deployment Type (USD Billion, 2019-2035)

      • On-Premises
      • Cloud


    • Supply Chain Analytics Market By Application (USD Billion, 2019-2035)

      • Inventory Management
      • Demand Forecasting
      • Supplier Management
      • Order Management


    • Supply Chain Analytics Market By End Use Industry (USD Billion, 2019-2035)

      • Retail
      • Manufacturing
      • Logistics
      • Healthcare


    • Supply Chain Analytics Market By Regional (USD Billion, 2019-2035)

      • North America
      • Europe
      • South America
      • Asia Pacific
      • Middle East and Africa


    Supply Chain Analytics Market Regional Outlook (USD Billion, 2019-2035)


    • North America Outlook (USD Billion, 2019-2035)

      • North America Supply Chain Analytics Market by Component Type

        • Software
        • Services
        • Hardware
      • North America Supply Chain Analytics Market by Deployment Type

        • On-Premises
        • Cloud
      • North America Supply Chain Analytics Market by Application Type

        • Inventory Management
        • Demand Forecasting
        • Supplier Management
        • Order Management
      • North America Supply Chain Analytics Market by End Use Industry Type

        • Retail
        • Manufacturing
        • Logistics
        • Healthcare
      • North America Supply Chain Analytics Market by Regional Type

        • US
        • Canada
      • US Outlook (USD Billion, 2019-2035)
      • US Supply Chain Analytics Market by Component Type

        • Software
        • Services
        • Hardware
      • US Supply Chain Analytics Market by Deployment Type

        • On-Premises
        • Cloud
      • US Supply Chain Analytics Market by Application Type

        • Inventory Management
        • Demand Forecasting
        • Supplier Management
        • Order Management
      • US Supply Chain Analytics Market by End Use Industry Type

        • Retail
        • Manufacturing
        • Logistics
        • Healthcare
      • CANADA Outlook (USD Billion, 2019-2035)
      • CANADA Supply Chain Analytics Market by Component Type

        • Software
        • Services
        • Hardware
      • CANADA Supply Chain Analytics Market by Deployment Type

        • On-Premises
        • Cloud
      • CANADA Supply Chain Analytics Market by Application Type

        • Inventory Management
        • Demand Forecasting
        • Supplier Management
        • Order Management
      • CANADA Supply Chain Analytics Market by End Use Industry Type

        • Retail
        • Manufacturing
        • Logistics
        • Healthcare
    • Europe Outlook (USD Billion, 2019-2035)

      • Europe Supply Chain Analytics Market by Component Type

        • Software
        • Services
        • Hardware
      • Europe Supply Chain Analytics Market by Deployment Type

        • On-Premises
        • Cloud
      • Europe Supply Chain Analytics Market by Application Type

        • Inventory Management
        • Demand Forecasting
        • Supplier Management
        • Order Management
      • Europe Supply Chain Analytics Market by End Use Industry Type

        • Retail
        • Manufacturing
        • Logistics
        • Healthcare
      • Europe Supply Chain Analytics Market by Regional Type

        • Germany
        • UK
        • France
        • Russia
        • Italy
        • Spain
        • Rest of Europe
      • GERMANY Outlook (USD Billion, 2019-2035)
      • GERMANY Supply Chain Analytics Market by Component Type

        • Software
        • Services
        • Hardware
      • GERMANY Supply Chain Analytics Market by Deployment Type

        • On-Premises
        • Cloud
      • GERMANY Supply Chain Analytics Market by Application Type

        • Inventory Management
        • Demand Forecasting
        • Supplier Management
        • Order Management
      • GERMANY Supply Chain Analytics Market by End Use Industry Type

        • Retail
        • Manufacturing
        • Logistics
        • Healthcare
      • UK Outlook (USD Billion, 2019-2035)
      • UK Supply Chain Analytics Market by Component Type

        • Software
        • Services
        • Hardware
      • UK Supply Chain Analytics Market by Deployment Type

        • On-Premises
        • Cloud
      • UK Supply Chain Analytics Market by Application Type

        • Inventory Management
        • Demand Forecasting
        • Supplier Management
        • Order Management
      • UK Supply Chain Analytics Market by End Use Industry Type

        • Retail
        • Manufacturing
        • Logistics
        • Healthcare
      • FRANCE Outlook (USD Billion, 2019-2035)
      • FRANCE Supply Chain Analytics Market by Component Type

        • Software
        • Services
        • Hardware
      • FRANCE Supply Chain Analytics Market by Deployment Type

        • On-Premises
        • Cloud
      • FRANCE Supply Chain Analytics Market by Application Type

        • Inventory Management
        • Demand Forecasting
        • Supplier Management
        • Order Management
      • FRANCE Supply Chain Analytics Market by End Use Industry Type

        • Retail
        • Manufacturing
        • Logistics
        • Healthcare
      • RUSSIA Outlook (USD Billion, 2019-2035)
      • RUSSIA Supply Chain Analytics Market by Component Type

        • Software
        • Services
        • Hardware
      • RUSSIA Supply Chain Analytics Market by Deployment Type

        • On-Premises
        • Cloud
      • RUSSIA Supply Chain Analytics Market by Application Type

        • Inventory Management
        • Demand Forecasting
        • Supplier Management
        • Order Management
      • RUSSIA Supply Chain Analytics Market by End Use Industry Type

        • Retail
        • Manufacturing
        • Logistics
        • Healthcare
      • ITALY Outlook (USD Billion, 2019-2035)
      • ITALY Supply Chain Analytics Market by Component Type

        • Software
        • Services
        • Hardware
      • ITALY Supply Chain Analytics Market by Deployment Type

        • On-Premises
        • Cloud
      • ITALY Supply Chain Analytics Market by Application Type

        • Inventory Management
        • Demand Forecasting
        • Supplier Management
        • Order Management
      • ITALY Supply Chain Analytics Market by End Use Industry Type

        • Retail
        • Manufacturing
        • Logistics
        • Healthcare
      • SPAIN Outlook (USD Billion, 2019-2035)
      • SPAIN Supply Chain Analytics Market by Component Type

        • Software
        • Services
        • Hardware
      • SPAIN Supply Chain Analytics Market by Deployment Type

        • On-Premises
        • Cloud
      • SPAIN Supply Chain Analytics Market by Application Type

        • Inventory Management
        • Demand Forecasting
        • Supplier Management
        • Order Management
      • SPAIN Supply Chain Analytics Market by End Use Industry Type

        • Retail
        • Manufacturing
        • Logistics
        • Healthcare
      • REST OF EUROPE Outlook (USD Billion, 2019-2035)
      • REST OF EUROPE Supply Chain Analytics Market by Component Type

        • Software
        • Services
        • Hardware
      • REST OF EUROPE Supply Chain Analytics Market by Deployment Type

        • On-Premises
        • Cloud
      • REST OF EUROPE Supply Chain Analytics Market by Application Type

        • Inventory Management
        • Demand Forecasting
        • Supplier Management
        • Order Management
      • REST OF EUROPE Supply Chain Analytics Market by End Use Industry Type

        • Retail
        • Manufacturing
        • Logistics
        • Healthcare
    • APAC Outlook (USD Billion, 2019-2035)

      • APAC Supply Chain Analytics Market by Component Type

        • Software
        • Services
        • Hardware
      • APAC Supply Chain Analytics Market by Deployment Type

        • On-Premises
        • Cloud
      • APAC Supply Chain Analytics Market by Application Type

        • Inventory Management
        • Demand Forecasting
        • Supplier Management
        • Order Management
      • APAC Supply Chain Analytics Market by End Use Industry Type

        • Retail
        • Manufacturing
        • Logistics
        • Healthcare
      • APAC Supply Chain Analytics Market by Regional Type

        • China
        • India
        • Japan
        • South Korea
        • Malaysia
        • Thailand
        • Indonesia
        • Rest of APAC
      • CHINA Outlook (USD Billion, 2019-2035)
      • CHINA Supply Chain Analytics Market by Component Type

        • Software
        • Services
        • Hardware
      • CHINA Supply Chain Analytics Market by Deployment Type

        • On-Premises
        • Cloud
      • CHINA Supply Chain Analytics Market by Application Type

        • Inventory Management
        • Demand Forecasting
        • Supplier Management
        • Order Management
      • CHINA Supply Chain Analytics Market by End Use Industry Type

        • Retail
        • Manufacturing
        • Logistics
        • Healthcare
      • INDIA Outlook (USD Billion, 2019-2035)
      • INDIA Supply Chain Analytics Market by Component Type

        • Software
        • Services
        • Hardware
      • INDIA Supply Chain Analytics Market by Deployment Type

        • On-Premises
        • Cloud
      • INDIA Supply Chain Analytics Market by Application Type

        • Inventory Management
        • Demand Forecasting
        • Supplier Management
        • Order Management
      • INDIA Supply Chain Analytics Market by End Use Industry Type

        • Retail
        • Manufacturing
        • Logistics
        • Healthcare
      • JAPAN Outlook (USD Billion, 2019-2035)
      • JAPAN Supply Chain Analytics Market by Component Type

        • Software
        • Services
        • Hardware
      • JAPAN Supply Chain Analytics Market by Deployment Type

        • On-Premises
        • Cloud
      • JAPAN Supply Chain Analytics Market by Application Type

        • Inventory Management
        • Demand Forecasting
        • Supplier Management
        • Order Management
      • JAPAN Supply Chain Analytics Market by End Use Industry Type

        • Retail
        • Manufacturing
        • Logistics
        • Healthcare
      • SOUTH KOREA Outlook (USD Billion, 2019-2035)
      • SOUTH KOREA Supply Chain Analytics Market by Component Type

        • Software
        • Services
        • Hardware
      • SOUTH KOREA Supply Chain Analytics Market by Deployment Type

        • On-Premises
        • Cloud
      • SOUTH KOREA Supply Chain Analytics Market by Application Type

        • Inventory Management
        • Demand Forecasting
        • Supplier Management
        • Order Management
      • SOUTH KOREA Supply Chain Analytics Market by End Use Industry Type

        • Retail
        • Manufacturing
        • Logistics
        • Healthcare
      • MALAYSIA Outlook (USD Billion, 2019-2035)
      • MALAYSIA Supply Chain Analytics Market by Component Type

        • Software
        • Services
        • Hardware
      • MALAYSIA Supply Chain Analytics Market by Deployment Type

        • On-Premises
        • Cloud
      • MALAYSIA Supply Chain Analytics Market by Application Type

        • Inventory Management
        • Demand Forecasting
        • Supplier Management
        • Order Management
      • MALAYSIA Supply Chain Analytics Market by End Use Industry Type

        • Retail
        • Manufacturing
        • Logistics
        • Healthcare
      • THAILAND Outlook (USD Billion, 2019-2035)
      • THAILAND Supply Chain Analytics Market by Component Type

        • Software
        • Services
        • Hardware
      • THAILAND Supply Chain Analytics Market by Deployment Type

        • On-Premises
        • Cloud
      • THAILAND Supply Chain Analytics Market by Application Type

        • Inventory Management
        • Demand Forecasting
        • Supplier Management
        • Order Management
      • THAILAND Supply Chain Analytics Market by End Use Industry Type

        • Retail
        • Manufacturing
        • Logistics
        • Healthcare
      • INDONESIA Outlook (USD Billion, 2019-2035)
      • INDONESIA Supply Chain Analytics Market by Component Type

        • Software
        • Services
        • Hardware
      • INDONESIA Supply Chain Analytics Market by Deployment Type

        • On-Premises
        • Cloud
      • INDONESIA Supply Chain Analytics Market by Application Type

        • Inventory Management
        • Demand Forecasting
        • Supplier Management
        • Order Management
      • INDONESIA Supply Chain Analytics Market by End Use Industry Type

        • Retail
        • Manufacturing
        • Logistics
        • Healthcare
      • REST OF APAC Outlook (USD Billion, 2019-2035)
      • REST OF APAC Supply Chain Analytics Market by Component Type

        • Software
        • Services
        • Hardware
      • REST OF APAC Supply Chain Analytics Market by Deployment Type

        • On-Premises
        • Cloud
      • REST OF APAC Supply Chain Analytics Market by Application Type

        • Inventory Management
        • Demand Forecasting
        • Supplier Management
        • Order Management
      • REST OF APAC Supply Chain Analytics Market by End Use Industry Type

        • Retail
        • Manufacturing
        • Logistics
        • Healthcare
    • South America Outlook (USD Billion, 2019-2035)

      • South America Supply Chain Analytics Market by Component Type

        • Software
        • Services
        • Hardware
      • South America Supply Chain Analytics Market by Deployment Type

        • On-Premises
        • Cloud
      • South America Supply Chain Analytics Market by Application Type

        • Inventory Management
        • Demand Forecasting
        • Supplier Management
        • Order Management
      • South America Supply Chain Analytics Market by End Use Industry Type

        • Retail
        • Manufacturing
        • Logistics
        • Healthcare
      • South America Supply Chain Analytics Market by Regional Type

        • Brazil
        • Mexico
        • Argentina
        • Rest of South America
      • BRAZIL Outlook (USD Billion, 2019-2035)
      • BRAZIL Supply Chain Analytics Market by Component Type

        • Software
        • Services
        • Hardware
      • BRAZIL Supply Chain Analytics Market by Deployment Type

        • On-Premises
        • Cloud
      • BRAZIL Supply Chain Analytics Market by Application Type

        • Inventory Management
        • Demand Forecasting
        • Supplier Management
        • Order Management
      • BRAZIL Supply Chain Analytics Market by End Use Industry Type

        • Retail
        • Manufacturing
        • Logistics
        • Healthcare
      • MEXICO Outlook (USD Billion, 2019-2035)
      • MEXICO Supply Chain Analytics Market by Component Type

        • Software
        • Services
        • Hardware
      • MEXICO Supply Chain Analytics Market by Deployment Type

        • On-Premises
        • Cloud
      • MEXICO Supply Chain Analytics Market by Application Type

        • Inventory Management
        • Demand Forecasting
        • Supplier Management
        • Order Management
      • MEXICO Supply Chain Analytics Market by End Use Industry Type

        • Retail
        • Manufacturing
        • Logistics
        • Healthcare
      • ARGENTINA Outlook (USD Billion, 2019-2035)
      • ARGENTINA Supply Chain Analytics Market by Component Type

        • Software
        • Services
        • Hardware
      • ARGENTINA Supply Chain Analytics Market by Deployment Type

        • On-Premises
        • Cloud
      • ARGENTINA Supply Chain Analytics Market by Application Type

        • Inventory Management
        • Demand Forecasting
        • Supplier Management
        • Order Management
      • ARGENTINA Supply Chain Analytics Market by End Use Industry Type

        • Retail
        • Manufacturing
        • Logistics
        • Healthcare
      • REST OF SOUTH AMERICA Outlook (USD Billion, 2019-2035)
      • REST OF SOUTH AMERICA Supply Chain Analytics Market by Component Type

        • Software
        • Services
        • Hardware
      • REST OF SOUTH AMERICA Supply Chain Analytics Market by Deployment Type

        • On-Premises
        • Cloud
      • REST OF SOUTH AMERICA Supply Chain Analytics Market by Application Type

        • Inventory Management
        • Demand Forecasting
        • Supplier Management
        • Order Management
      • REST OF SOUTH AMERICA Supply Chain Analytics Market by End Use Industry Type

        • Retail
        • Manufacturing
        • Logistics
        • Healthcare
    • MEA Outlook (USD Billion, 2019-2035)

      • MEA Supply Chain Analytics Market by Component Type

        • Software
        • Services
        • Hardware
      • MEA Supply Chain Analytics Market by Deployment Type

        • On-Premises
        • Cloud
      • MEA Supply Chain Analytics Market by Application Type

        • Inventory Management
        • Demand Forecasting
        • Supplier Management
        • Order Management
      • MEA Supply Chain Analytics Market by End Use Industry Type

        • Retail
        • Manufacturing
        • Logistics
        • Healthcare
      • MEA Supply Chain Analytics Market by Regional Type

        • GCC Countries
        • South Africa
        • Rest of MEA
      • GCC COUNTRIES Outlook (USD Billion, 2019-2035)
      • GCC COUNTRIES Supply Chain Analytics Market by Component Type

        • Software
        • Services
        • Hardware
      • GCC COUNTRIES Supply Chain Analytics Market by Deployment Type

        • On-Premises
        • Cloud
      • GCC COUNTRIES Supply Chain Analytics Market by Application Type

        • Inventory Management
        • Demand Forecasting
        • Supplier Management
        • Order Management
      • GCC COUNTRIES Supply Chain Analytics Market by End Use Industry Type

        • Retail
        • Manufacturing
        • Logistics
        • Healthcare
      • SOUTH AFRICA Outlook (USD Billion, 2019-2035)
      • SOUTH AFRICA Supply Chain Analytics Market by Component Type

        • Software
        • Services
        • Hardware
      • SOUTH AFRICA Supply Chain Analytics Market by Deployment Type

        • On-Premises
        • Cloud
      • SOUTH AFRICA Supply Chain Analytics Market by Application Type

        • Inventory Management
        • Demand Forecasting
        • Supplier Management
        • Order Management
      • SOUTH AFRICA Supply Chain Analytics Market by End Use Industry Type

        • Retail
        • Manufacturing
        • Logistics
        • Healthcare
      • REST OF MEA Outlook (USD Billion, 2019-2035)
      • REST OF MEA Supply Chain Analytics Market by Component Type

        • Software
        • Services
        • Hardware
      • REST OF MEA Supply Chain Analytics Market by Deployment Type

        • On-Premises
        • Cloud
      • REST OF MEA Supply Chain Analytics Market by Application Type

        • Inventory Management
        • Demand Forecasting
        • Supplier Management
        • Order Management
      • REST OF MEA Supply Chain Analytics Market by End Use Industry Type

        • Retail
        • Manufacturing
        • Logistics
        • Healthcare


    Infographic

    Free Sample Request

    Kindly complete the form below to receive a free sample of this Report

    Get Free Sample

    Customer Strories

    “I am very pleased with how market segments have been defined in a relevant way for my purposes (such as "Portable Freezers & refrigerators" and "last-mile"). In general the report is well structured. Thanks very much for your efforts.”

    Victoria Milne

    Founder
    Case Study
    Chemicals and Materials

    Compare Licence

    ×
    Features License Type
    Single User Multiuser License Enterprise User
    Price $4,950 $5,950 $7,250
    Maximum User Access Limit 1 User Upto 10 Users Unrestricted Access Throughout the Organization
    Free Customization
    Direct Access to Analyst
    Deliverable Format
    Platform Access
    Discount on Next Purchase 10% 15% 15%
    Printable Versions