Segmentation Quick Reference
| Dimension | Sub-Segments | Dominant Segment | Fastest Growing Segment |
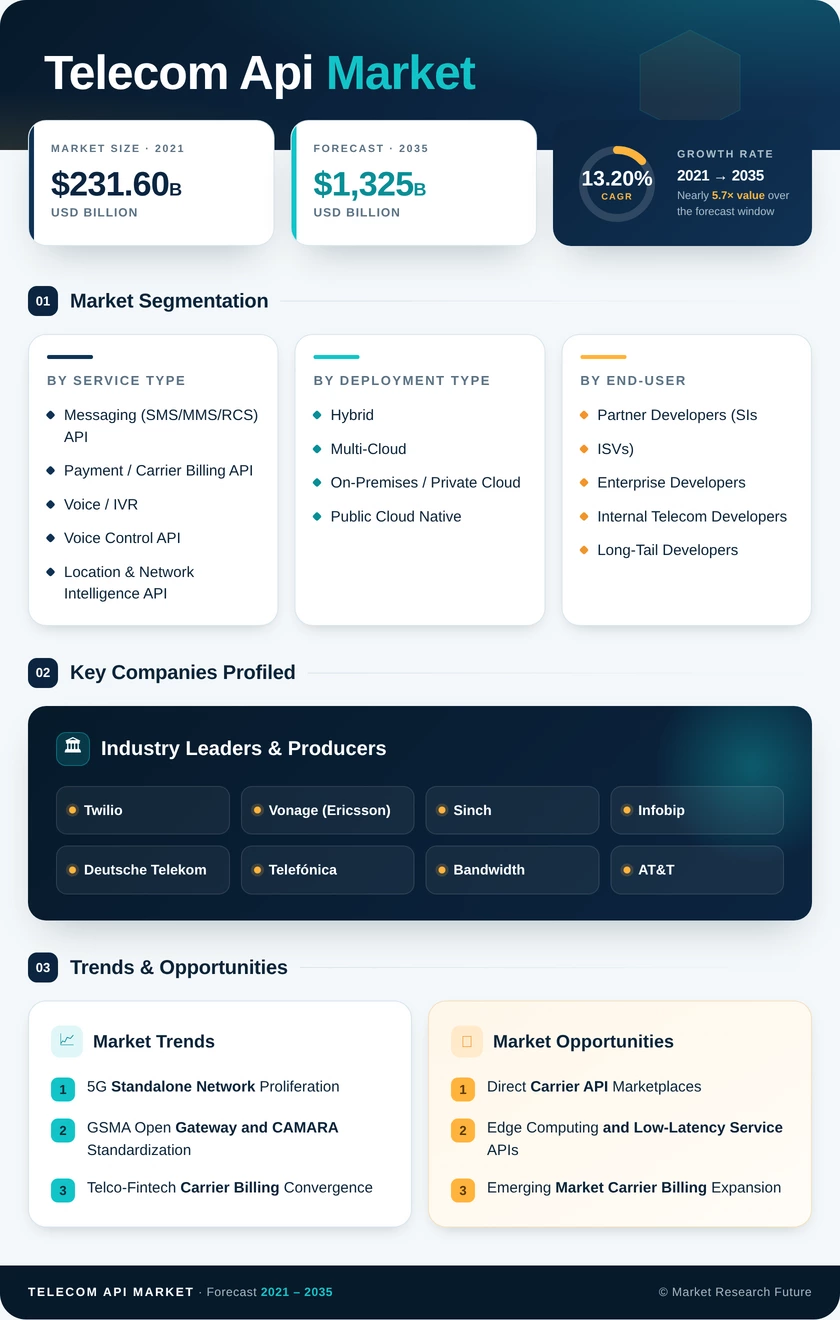
| Telecom API Market Type | Messaging (SMS/MMS/RCS) API, Payment / Carrier Billing API, Voice / IVR and Voice Control API, Location & Network Intelligence API, Identity & Number Verification API, Quality-of-Telecom API Market / Network Slicing API | Messaging (SMS/MMS/RCS) API | Quality-of-Telecom API Market / Network Slicing API |
| Deployment Type | Hybrid, Multi-Cloud, On-Premises / Private Cloud, Public Cloud Native | Hybrid | Multi-Cloud |
| End-User | Partner Developers (SIs, ISVs), Enterprise Developers, Internal Telecom Developers, Long-Tail Developers | Partner Developers (SIs, ISVs) | Long-Tail Developers |
| Business Model | Aggregator-Led CPaaS, Direct Carrier Exposure, API Marketplace / Exchange, Embedded / White-Label | Aggregator-Led CPaaS | API Marketplace / Exchange |
Market Segmentation Overview
By Telecom API Market Type
| Sub-Segment | Key Trend |
| Messaging (SMS/MMS/RCS) API | RCS business messaging migration from legacy SMS; Apple interoperability catalyst |
| Payment / Carrier Billing API | Telco-fintech convergence; unbanked population payment gateway |
| Voice / IVR and Voice Control API | CCaaS modernization; AI-powered interactive voice response |
| Location & Network Intelligence API | Fraud prevention geofencing; logistics fleet optimization |
| Identity & Number Verification API | SIM-swap detection; silent authentication for financial services |
| Quality-of-Telecom API Market / Network Slicing API | Enterprise SLA guarantees, gaming, and XR low-latency tiers |
Messaging APIs retain the largest revenue share due to the massive A2P authentication and customer engagement market. RCS adoption on iOS has accelerated the migration from legacy SMS toward higher-margin interactive messaging channels with rich media, verified sender profiles, and embedded payment capabilities.
By Deployment Type
| Sub-Segment | Key Trend |
| Hybrid | Data sovereignty balances with cloud scalability; predominant architecture for tier-one carriers |
| Multi-Cloud | Vendor-neutral orchestration gaining traction; resilience-first enterprise strategy |
| On-Premises / Private Cloud | Regulatory compliance for sensitive network data; declining share |
| Public Cloud Native | Rapid scaling for self-service developer portals; long-tail segment enabler |
Hybrid architectures dominate because operators balance edge-latency requirements against the scalability benefits of public cloud. Multi-cloud adoption is accelerating as carriers seek to avoid hyperscaler lock-in while maintaining fault tolerance across geographic deployments.
By End-User
| Sub-Segment | Key Trend |
| Partner Developers (SIs, ISVs) | Vertical-solution embedding; enterprise multiplier channel |
| Enterprise Developers | Direct API consumption for internal automation and customer experience |
| Internal Telecom Developers | BSS/OSS modernization; internal process automation |
| Long-Tail Developers | Self-service sandbox adoption; lowest onboarding friction |
Partner developers serve as ecosystem multipliers by embedding network APIs into vertical solutions distributed across thousands of downstream enterprises. Long-tail developers represent the fastest-growing segment, benefiting from democratized API access and free-tier sandbox environments.
By Business Model
| Sub-Segment | Key Trend |
| Aggregator-Led CPaaS | Broadest developer reach through multi-carrier abstraction layers |
| Direct Carrier Exposure | Margin recapture strategy; premium SLA differentiation |
| API Marketplace / Exchange | Federated discovery across operator boundaries; GSMA Open Gateway aligned |
| Embedded / White-Label | OEM integration for invisible connectivity in vertical SaaS platforms |
Aggregator-led models command the largest share but face margin pressure as operators pursue direct API marketplace strategies. The API marketplace and exchange model is growing fastest, enabled by GSMA Open Gateway's federated architecture that eliminates per-operator integration overhead.