Thyristor Market (2026 - 2035)

ID: MRFR/SEM/15655-HCR
128 Pages
Ankit Gupta
Last Updated: July 28, 2026
Thyristor Market Size, Share and Research Report By Power Rating (500 MV, 500 MV-1000 MV, and 1000 MV), By End Use (Consumer Electronics, Telecommunication & Networking, Industrial, Automotive, Aerospace & Defense and Others) And By Region (North America, Europe, Asia-Pacific, And Rest Of The World) –Industry Forecast Till 2035
Thyristor Market
Market Size
Forecast Period2026-2035
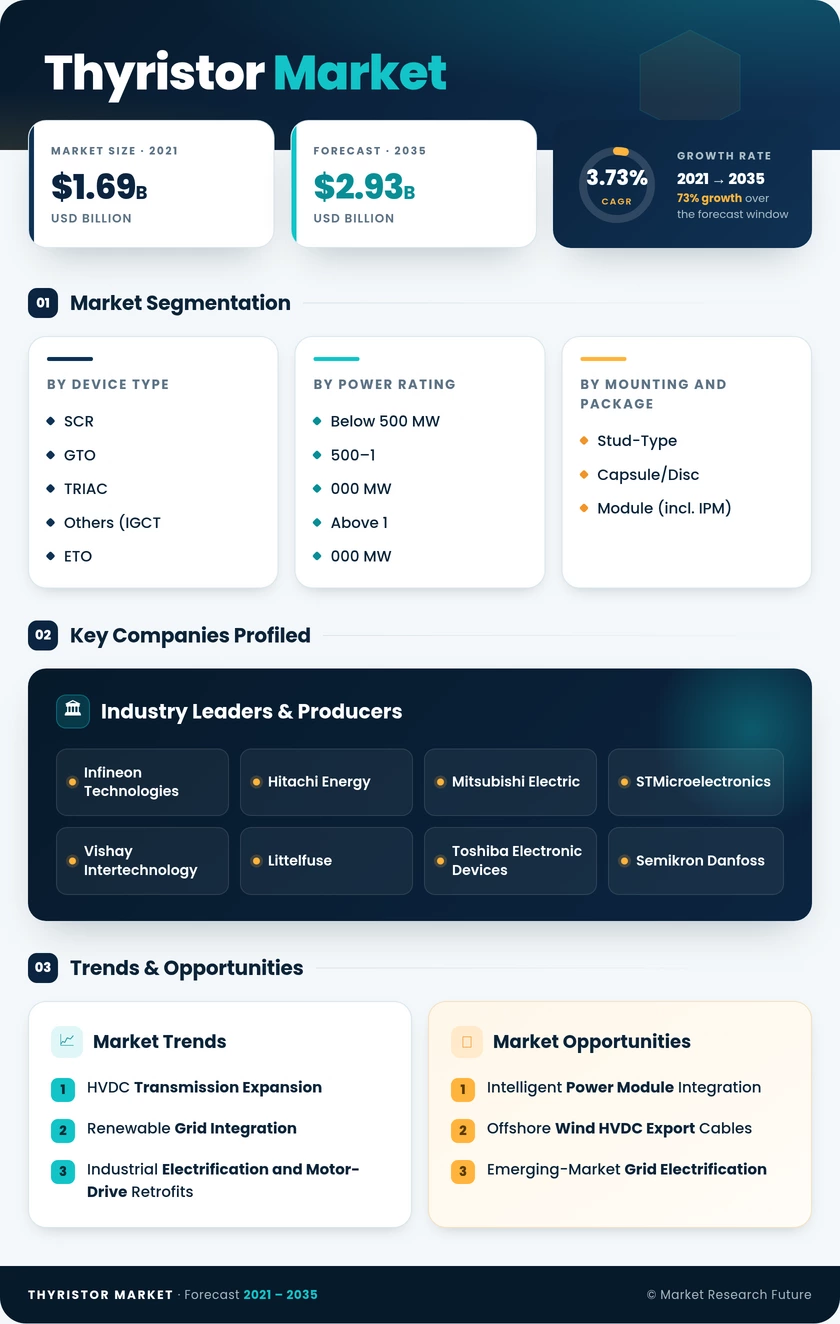
CAGR (2026-2035)3.73%
2025 Market SizeUSD 1.93 Billion
2035 Market SizeUSD 2.93 Billion
Key Players
Infineon Technologies
Hitachi Energy
Mitsubishi Electric
STMicroelectronics
Vishay Intertechnology
Littelfuse
Opportunities
  • Intelligent Power Module Integration
  • Offshore Wind HVDC Export Cables
  • Emerging-Market Grid Electrification
  1. 1 Market Overview |
    1. 1.1 Study Assumptions & Market Definition |
    2. 1.2 Scope of the Study |
    3. 1.3 Research Methodology
  2. 2 Market Summary & Key Takeaways
  3. 3 Market Dynamics |
    1. 3.1 Market Drivers Analysis | |
      1. 3.1.1 HVDC Transmission Expansion | |
      2. 3.1.2 Renewable Grid Integration | |
      3. 3.1.3 Industrial Electrification and Motor-Drive Retrofits | |
      4. 3.1.4 Green-Hydrogen Electrolyser Deployment | |
      5. 3.1.5 Rail Electrification Programs | |
      6. 3.1.6 Data-Center UPS and Power-Conditioning Upgrades | |
      7. 3.1.7 Replacement Cycle for Aging HVDC Converter Stations |
    2. 3.2 Market Restraints Analysis | |
      1. 3.2.1 Wide-Bandgap Semiconductor Substitution | |
      2. 3.2.2 Price Pressure from Chinese Discrete Suppliers | |
      3. 3.2.3 Counterfeit Device Risk and Certification Delays | |
      4. 3.2.4 Long Qualification Cycles for New Grid Projects | |
      5. 3.2.5 Declining Legacy Industrial Load in Mature Economies |
    3. 3.3 Market Opportunity Analysis | |
      1. 3.3.1 Intelligent Power Module Integration | |
      2. 3.3.2 Offshore Wind HVDC Export Cables | |
      3. 3.3.3 Emerging-Market Grid Electrification | |
      4. 3.3.4 Electrolyser Rectification for Green Hydrogen | |
      5. 3.3.5 Data Monetization Through Digital-Twin Valve Monitoring |
    4. 3.4 Industry Value Chain Analysis |
    5. 3.5 Porter's Five Forces Analysis
  4. 4 Global Thyristor Market Size & Forecast (2021–2035) |
    1. 4.1 Historical Market Size (2021–2025) |
    2. 4.2 Current & Forecast Market Size (2026–2035) |
    3. 4.3 Market Size by Revenue (USD Billion) |
    4. 4.4 Year-over-Year Growth Analysis
  5. 5 Segmentation Analysis |
    1. 5.1 By Device Type | |
      1. 5.1.1 Silicon-Controlled Rectifier (SCR) | |
      2. 5.1.2 Gate Turn-Off Thyristor (GTO) | |
      3. 5.1.3 TRIAC | |
      4. 5.1.4 Others (IGCT, ETO, MTO) |
    2. 5.2 By Power Rating | |
      1. 5.2.1 Below 500 MW | |
      2. 5.2.2 500–1,000 MW | |
      3. 5.2.3 Above 1,000 MW |
    3. 5.3 By Mounting and Package | |
      1. 5.3.1 Stud-Type | |
      2. 5.3.2 Capsule / Disc | |
      3. 5.3.3 Module (incl. Intelligent Power Modules) |
    4. 5.4 By Triggering Method | |
      1. 5.4.1 Electrical Gate Triggering | |
      2. 5.4.2 Light Triggering | |
      3. 5.4.3 Pulse Transformer | |
      4. 5.4.4 Others |
    5. 5.5 By End-Use Industry | |
      1. 5.5.1 Industrial Drives and Motor Control | |
      2. 5.5.2 Power Transmission and Distribution | |
      3. 5.5.3 Renewable Power Conversion | |
      4. 5.5.4 Transportation and Traction | |
      5. 5.5.5 Consumer and Commercial
  6. 6 Regional Analysis |
    1. 6.1 North America | |
      1. 6.1.1 United States | |
      2. 6.1.2 Canada | |
      3. 6.1.3 Mexico |
    2. 6.2 Europe | |
      1. 6.2.1 Germany | |
      2. 6.2.2 United Kingdom | |
      3. 6.2.3 France | |
      4. 6.2.4 Italy | |
      5. 6.2.5 Spain | |
      6. 6.2.6 Nordic Countries | |
      7. 6.2.7 Russia | |
      8. 6.2.8 Rest of Europe |
    3. 6.3 Asia-Pacific | |
      1. 6.3.1 China | |
      2. 6.3.2 India | |
      3. 6.3.3 Japan | |
      4. 6.3.4 South Korea | |
      5. 6.3.5 ASEAN | |
      6. 6.3.6 Rest of Asia-Pacific |
    4. 6.4 South America | |
      1. 6.4.1 Brazil | |
      2. 6.4.2 Argentina | |
      3. 6.4.3 Rest of South America |
    5. 6.5 Middle East & Africa | |
      1. 6.5.1 Saudi Arabia | |
      2. 6.5.2 UAE | |
      3. 6.5.3 South Africa | |
      4. 6.5.4 Egypt | |
      5. 6.5.5 Rest of MEA
  7. 7 Competitive Landscape |
    1. 7.1 Market Share Analysis (2025) |
    2. 7.2 Competitive Benchmarking Matrix |
    3. 7.3 Company Profiles | |
      1. 7.3.1 Infineon Technologies | |
      2. 7.3.2 Hitachi Energy | |
      3. 7.3.3 Mitsubishi Electric | |
      4. 7.3.4 STMicroelectronics | |
      5. 7.3.5 Vishay Intertechnology | |
      6. 7.3.6 Littelfuse | |
      7. 7.3.7 Toshiba Electronic Devices | |
      8. 7.3.8 Semikron Danfoss | |
      9. 7.3.9 WeEn Semiconductors | |
      10. 7.3.10 SanRex Corporation
  8. 8 Future Outlook & Strategic Recommendations (2026–2035) |
    1. 8.1 Grid Digitalization and AI-Optimized Power Flow |
    2. 8.2 Electrification Supercycle and Sector Coupling |
    3. 8.3 ESG Compliance and Supply-Chain Traceability |
    4. 8.4 Modular HVDC and Standardized Converter Platforms
  9. 9 Recent Developments & News
  10. 10 Frequently Asked Questions (FAQs)
  11. 11 Report Scope & Methodology |
    1. 11.1 Study Period & Base Year |
    2. 11.2 Data Sources & Citations |
    3. 11.3 Abbreviations
  12. 12 LIST OF TABLES |
  13. TABLE 1 Global Thyristor Market Size & Forecast, by Revenue (USD Billion), 2021–2035 |
  14. TABLE 2 Global Thyristor Market — Year-over-Year Growth Analysis, 2021–2035 |
  15. TABLE 3 Global Thyristor Market — Driver Impact Analysis |
  16. TABLE 4 Global Thyristor Market — Restraints Impact Analysis |
  17. TABLE 5 Global Thyristor Market Size, by Device Type, 2021–2035 (USD Billion) |
  18. TABLE 6 Global Thyristor Market Size, by Power Rating, 2021–2035 (USD Billion) |
  19. TABLE 7 Global Thyristor Market Size, by Mounting and Package, 2021–2035 (USD Billion) |
  20. TABLE 8 Global Thyristor Market Size, by Triggering Method, 2021–2035 (USD Billion) |
  21. TABLE 9 Global Thyristor Market Size, by End-Use Industry, 2021–2035 (USD Billion) |
  22. TABLE 10 Global Thyristor Market Size, by Region, 2021–2035 (USD Billion) |
  23. TABLE 11 North America Thyristor Market Size, by Country, 2021–2035 (USD Billion) |
  24. TABLE 12 Europe Thyristor Market Size, by Country, 2021–2035 (USD Billion) |
  25. TABLE 13 Asia-Pacific Thyristor Market Size, by Country, 2021–2035 (USD Billion) |
  26. TABLE 14 South America Thyristor Market Size, by Country, 2021–2035 (USD Billion) |
  27. TABLE 15 Middle East & Africa Thyristor Market Size, by Country, 2021–2035 (USD Billion) |
  28. TABLE 16 Competitive Benchmarking Matrix — Global Thyristor Market, 2025 |
  29. TABLE 17 Company Profiles — Key Players, Global Thyristor Market |
  30. TABLE 18 Recent Developments & Strategic Announcements, 2023–2025 |
  31. TABLE 19 Report Scope and Methodology |
  32. TABLE 20 Detailed Sources and Citations
  33. 13 LIST OF FIGURES |
  34. FIGURE 1 Global Thyristor Market Dynamics — Drivers, Restraints, and Opportunities |
  35. FIGURE 2 Industry Value Chain Analysis — Thyristor Market |
  36. FIGURE 3 Porter's Five Forces Analysis — Thyristor Market |
  37. FIGURE 4 Global Thyristor Market Size Trend (USD Billion), 2021–2035 |
  38. FIGURE 5 Thyristor Market Share, by Device Type (2025) |
  39. FIGURE 6 Thyristor Market Share, by Power Rating (2025) |
  40. FIGURE 7 Thyristor Market Share, by Mounting and Package (2025) |
  41. FIGURE 8 Thyristor Market Share, by Triggering Method (2025) |
  42. FIGURE 9 Thyristor Market Share, by End-Use Industry (2025) |
  43. FIGURE 10 Thyristor Market Share, by Region (2025) |
  44. FIGURE 11 North America Thyristor Market — Country-Level Share (2025) |
  45. FIGURE 12 Europe Thyristor Market — Country-Level Share (2025) |
  46. FIGURE 13 Asia-Pacific Thyristor Market — Country-Level Share (2025) |
  47. FIGURE 14 South America Thyristor Market — Country-Level Share (2025) |
  48. FIGURE 15 Middle East & Africa Thyristor Market — Country-Level Share (2025) |
  49. FIGURE 16 Competitive Landscape — Market Share Analysis (2025) |
  50. FIGURE 17 Competitive Positioning Matrix — Top 10 Players

Segmentation Quick Reference

DimensionSub-SegmentsDominant SegmentFastest Growing Segment
Device TypeSCR, GTO, TRIAC, Others (IGCT, ETO, MTO)Silicon-Controlled Rectifier (SCR)Gate Turn-Off Thyristor (GTO)
Power RatingBelow 500 MW, 500–1,000 MW, Above 1,000 MWBelow 500 MWAbove 1,000 MW
Mounting and PackageStud-Type, Capsule/Disc, Module (incl. IPM)Stud-TypeModule (Intelligent Power Modules)
Triggering MethodElectrical, Light, Pulse Transformer, OthersElectrical Gate TriggeringLight Triggering
End-Use IndustryIndustrial Drives & Motor Control, Power T&D, Renewable Power Conversion, Transportation & Traction, Consumer & CommercialIndustrial Drives and Motor ControlRenewable Power Conversion


Market Segmentation Overview

By Device Type

Sub-SegmentKey Trend
Silicon-Controlled Rectifier (SCR)Continued dominance in HVDC valve stacks and high-current industrial rectification
Gate Turn-Off Thyristor (GTO)Growing adoption in metro traction inverters and utility FACTS installations
TRIACStable demand from consumer appliance controls and residential light dimmers
Others (IGCT, ETO, MTO)Niche growth in medium-voltage STATCOM and high-frequency industrial drives


SCR devices remain the structural backbone of the thyristor industry, accounting for the majority of revenue from utility-scale HVDC converters and electrochemical processing. GTO devices are gaining traction in applications requiring controlled turn-off capability without external commutation circuits, particularly in rail traction and flexible AC transmission systems.

By Power Rating

Sub-SegmentKey Trend
Below 500 MWHigh-volume demand from industrial soft starters, motor drives, and UPS systems
500–1,000 MWGrowing deployment in regional HVDC interconnectors and offshore wind export links
Above 1,000 MWFastest growth driven by ultra-high-voltage DC backbone corridors in China and India


The below-500 MW tier serves the broadest range of applications across manufacturing, mining, and commercial buildings. Above-1,000 MW installations represent the highest-value procurement opportunities, with individual UHVDC projects commanding thyristor valve orders exceeding USD 200 million.

By Mounting and Package

Sub-SegmentKey Trend
Stud-TypeCost-efficient standard for panel-mount industrial integration
Capsule / DiscPreferred for press-pack HVDC valves requiring bidirectional cooling and high surge ratings
Module (incl. Intelligent Power Modules)Fastest innovation tier integrating gate drivers, sensors, and thermal management


Stud-type packages dominate on unit volume due to their compatibility with standard heatsink assemblies. Intelligent power modules represent the fastest-growing format as end users demand reduced system complexity and built-in diagnostics.

By Triggering Method

Sub-SegmentKey Trend
Electrical Gate TriggeringStandard method for industrial and motor-control applications
Light TriggeringGaining share in UHVDC where electromagnetic isolation is critical
Pulse TransformerLegacy installations and retrofit applications
OthersSpecialty defense and research applications


Electrical triggering remains the default for general-purpose thyristor deployment. Light-triggered devices are expanding rapidly in UHVDC converter stations, where fiber-optic gate firing eliminates ground-potential isolation challenges at extreme voltages.

By End-Use Industry

Sub-SegmentKey Trend
Industrial Drives and Motor ControlLargest revenue segment driven by metals, cement, and mining sectors
Power Transmission and DistributionHVDC and FACTS deployments anchor grid-segment demand
Renewable Power ConversionFastest growth as solar and wind mandate grid-tie reactive compensation
Transportation and TractionElectrified rail and metro traction substations sustain steady demand
Consumer and CommercialStable but mature segment centered on HVAC controls and lighting


Industrial drives continue to account for the largest share of thyristor consumption, while renewable power conversion is climbing as grid codes mandate thyristor-based reactive compensation at large-scale interconnection points.




Download PDF ×

We do not share your information with anyone. However, we may send you emails based on your report interest from time to time. You may contact us at any time to opt-out.