Titanium Dioxide Market

ID: MRFR/CnM/0575-HCR
185 Pages
Chitranshi Jaiswal
Last Updated: June 18, 2026
Titanium Dioxide Market Research Report Information -By Application (Paints, Coatings Plastics, Photo-electrode, Pigment, Paper, Cosmetics, Food Additives, and Others), By End User (Automotive, Personal Care, Pharmaceutical, Food & Beverages, Construction Industry, and Others), And By Region (North America, Europe, Asia-Pacific, And Rest Of The World) – Market Forecast Till 2035.
Download PDF ×

We do not share your information with anyone. However, we may send you emails based on your report interest from time to time. You may contact us at any time to opt-out.

  1. 1 Market Overview |
    1. 1.1 Study Assumptions & Market Definition |
    2. 1.2 Scope of the Study |
    3. 1.3 Research Methodology
  2. 2 Market Summary & Key Takeaways
  3. 3 Market Dynamics |
    1. 3.1 Market Drivers Analysis | |
      1. 3.1.1 Global Construction Spending Surge | |
      2. 3.1.2 Chloride-Route Process Optimization | |
      3. 3.1.3 EV and Automotive Lightweighting | |
      4. 3.1.4 Cool-Roof and Energy-Efficient Coatings | |
      5. 3.1.5 Packaging Industry Food-Safety Mandates | |
      6. 3.1.6 Cosmetics and Personal-Care Premiumization | |
      7. 3.1.7 Vertical Integration and Feedstock Security |
    2. 3.2 Market Restraints Analysis | |
      1. 3.2.1 EU Category 2 Carcinogen Classification | |
      2. 3.2.2 Volatile Ilmenite and Rutile Ore Pricing | |
      3. 3.2.3 Anti-Dumping Duties on Chinese TiO₂ | |
      4. 3.2.4 Environmental Compliance Costs for Sulfate Plants | |
      5. 3.2.5 Substitution by Alternative Fillers |
    3. 3.3 Market Opportunity Analysis | |
      1. 3.3.1 Next-Generation Cool-Roof and Reflective Coatings | |
      2. 3.3.2 Food-Grade Packaging and Barrier Applications | |
      3. 3.3.3 India's Manufacturing Localization | |
      4. 3.3.4 Cosmetics and Sunscreen Premiumization | |
      5. 3.3.5 Digital Supply-Chain Platforms and Pricing Transparency |
    4. 3.4 Industry Value Chain Analysis |
    5. 3.5 Porter's Five Forces Analysis
  4. 4 Global Titanium Dioxide Market Size & Forecast (2021–2035) |
    1. 4.1 Historical Market Size (2021–2025) |
    2. 4.2 Current & Forecast Market Size (2026–2035) |
    3. 4.3 Market Size by Revenue (USD Billion) |
    4. 4.4 Year-over-Year Growth Analysis
  5. 5 Segmentation Analysis |
    1. 5.1 By Grade | |
      1. 5.1.1 Rutile | |
      2. 5.1.2 Anatase |
    2. 5.2 By Process | |
      1. 5.2.1 Chloride | |
      2. 5.2.2 Sulfate |
    3. 5.3 By Application | |
      1. 5.3.1 Paints and Coatings | |
      2. 5.3.2 Plastics | |
      3. 5.3.3 Paper and Pulp | |
      4. 5.3.4 Cosmetics | |
      5. 5.3.5 Other Applications |
    4. 5.4 By End-User Industry | |
      1. 5.4.1 Construction | |
      2. 5.4.2 Automotive and Transportation | |
      3. 5.4.3 Packaging | |
      4. 5.4.4 Other Industries
  6. 6 Regional Analysis |
    1. 6.1 North America | |
      1. 6.1.1 United States | |
      2. 6.1.2 Canada | |
      3. 6.1.3 Mexico |
    2. 6.2 Europe | |
      1. 6.2.1 Germany | |
      2. 6.2.2 United Kingdom | |
      3. 6.2.3 France | |
      4. 6.2.4 Italy | |
      5. 6.2.5 Spain | |
      6. 6.2.6 Nordic Countries | |
      7. 6.2.7 Russia | |
      8. 6.2.8 Rest of Europe |
    3. 6.3 Asia-Pacific | |
      1. 6.3.1 China | |
      2. 6.3.2 India | |
      3. 6.3.3 Japan | |
      4. 6.3.4 South Korea | |
      5. 6.3.5 ASEAN | |
      6. 6.3.6 Rest of Asia-Pacific |
    4. 6.4 South America | |
      1. 6.4.1 Brazil | |
      2. 6.4.2 Argentina | |
      3. 6.4.3 Rest of South America |
    5. 6.5 Middle East & Africa | |
      1. 6.5.1 Saudi Arabia | |
      2. 6.5.2 UAE | |
      3. 6.5.3 South Africa | |
      4. 6.5.4 Egypt | |
      5. 6.5.5 Rest of MEA
  7. 7 Competitive Landscape |
    1. 7.1 Market Share Analysis (2025) |
    2. 7.2 Competitive Benchmarking Matrix |
    3. 7.3 Company Profiles | |
      1. 7.3.1 Chemours Company | |
      2. 7.3.2 Tronox Holdings | |
      3. 7.3.3 Kronos Worldwide | |
      4. 7.3.4 Venator Materials | |
      5. 7.3.5 Lomon Billions Group | |
      6. 7.3.6 Ishihara Sangyo Kaisha (ISK) | |
      7. 7.3.7 Huntsman Corporation | |
      8. 7.3.8 Grupa Azoty | |
      9. 7.3.9 CNNC Hua Yuan Titanium Dioxide | |
      10. 7.3.10 Tayca Corporation
  8. 8 Future Outlook & Strategic Recommendations (2026–2035) |
    1. 8.1 Sustainability-Driven Product Reformulation |
    2. 8.2 Electrification and Automotive Transformation |
    3. 8.3 Circular Economy and Recycled-Content Integration |
    4. 8.4 Digital Manufacturing and Predictive Quality Control
  9. 9 Recent Developments & News
  10. 10 Frequently Asked Questions (FAQs)
  11. 11 Report Scope & Methodology |
    1. 11.1 Study Period & Base Year |
    2. 11.2 Data Sources & Citations |
    3. 11.3 Abbreviations
  12. 12 LIST OF TABLES |
  13. TABLE 1 Global Titanium Dioxide Market Size & Forecast, by Revenue (USD Billion), 2021–2035 |
  14. TABLE 2 Global Titanium Dioxide Market — Year-over-Year Growth Analysis, 2021–2035 |
  15. TABLE 3 Global Titanium Dioxide Market — Driver Impact Analysis |
  16. TABLE 4 Global Titanium Dioxide Market — Restraints Impact Analysis |
  17. TABLE 5 Global Titanium Dioxide Market Size, by Grade, 2021–2035 (USD Billion) |
  18. TABLE 6 Global Titanium Dioxide Market Size, by Process, 2021–2035 (USD Billion) |
  19. TABLE 7 Global Titanium Dioxide Market Size, by Application, 2021–2035 (USD Billion) |
  20. TABLE 8 Global Titanium Dioxide Market Size, by End-User Industry, 2021–2035 (USD Billion) |
  21. TABLE 9 Global Titanium Dioxide Market Size, by Region, 2021–2035 (USD Billion) |
  22. TABLE 10 North America Titanium Dioxide Market Size, by Country, 2021–2035 (USD Billion) |
  23. TABLE 11 Europe Titanium Dioxide Market Size, by Country, 2021–2035 (USD Billion) |
  24. TABLE 12 Asia-Pacific Titanium Dioxide Market Size, by Country, 2021–2035 (USD Billion) |
  25. TABLE 13 South America Titanium Dioxide Market Size, by Country, 2021–2035 (USD Billion) |
  26. TABLE 14 Middle East & Africa Titanium Dioxide Market Size, by Country, 2021–2035 (USD Billion) |
  27. TABLE 15 Competitive Benchmarking Matrix — Global Titanium Dioxide Market, 2025 |
  28. TABLE 16 Company Profiles — Key Players, Global Titanium Dioxide Market |
  29. TABLE 17 Recent Developments & Strategic Announcements, 2023–2025 |
  30. TABLE 18 North America Titanium Dioxide Market Size, by Grade, 2021–2035 (USD Billion) |
  31. TABLE 19 North America Titanium Dioxide Market Size, by Process, 2021–2035 (USD Billion) |
  32. TABLE 20 North America Titanium Dioxide Market Size, by Application, 2021–2035 (USD Billion) |
  33. TABLE 21 North America Titanium Dioxide Market Size, by End-User Industry, 2021–2035 (USD Billion) |
  34. TABLE 22 Europe Titanium Dioxide Market Size, by Grade, 2021–2035 (USD Billion) |
  35. TABLE 23 Europe Titanium Dioxide Market Size, by Process, 2021–2035 (USD Billion) |
  36. TABLE 24 Europe Titanium Dioxide Market Size, by Application, 2021–2035 (USD Billion) |
  37. TABLE 25 Europe Titanium Dioxide Market Size, by End-User Industry, 2021–2035 (USD Billion) |
  38. TABLE 26 Asia-Pacific Titanium Dioxide Market Size, by Grade, 2021–2035 (USD Billion) |
  39. TABLE 27 Asia-Pacific Titanium Dioxide Market Size, by Process, 2021–2035 (USD Billion) |
  40. TABLE 28 Asia-Pacific Titanium Dioxide Market Size, by Application, 2021–2035 (USD Billion) |
  41. TABLE 29 Asia-Pacific Titanium Dioxide Market Size, by End-User Industry, 2021–2035 (USD Billion) |
  42. TABLE 30 South America Titanium Dioxide Market Size, by Grade, 2021–2035 (USD Billion) |
  43. TABLE 31 South America Titanium Dioxide Market Size, by Process, 2021–2035 (USD Billion) |
  44. TABLE 32 South America Titanium Dioxide Market Size, by Application, 2021–2035 (USD Billion) |
  45. TABLE 33 South America Titanium Dioxide Market Size, by End-User Industry, 2021–2035 (USD Billion) |
  46. TABLE 34 Middle East & Africa Titanium Dioxide Market Size, by Grade, 2021–2035 (USD Billion) |
  47. TABLE 35 Middle East & Africa Titanium Dioxide Market Size, by Process, 2021–2035 (USD Billion) |
  48. TABLE 36 Middle East & Africa Titanium Dioxide Market Size, by Application, 2021–2035 (USD Billion) |
  49. TABLE 37 Middle East & Africa Titanium Dioxide Market Size, by End-User Industry, 2021–2035 (USD Billion) |
  50. TABLE 38 United States Titanium Dioxide Market Size, by Grade, 2021–2035 (USD Billion) |
  51. TABLE 39 United States Titanium Dioxide Market Size, by Process, 2021–2035 (USD Billion) |
  52. TABLE 40 United States Titanium Dioxide Market Size, by Application, 2021–2035 (USD Billion) |
  53. TABLE 41 United States Titanium Dioxide Market Size, by End-User Industry, 2021–2035 (USD Billion) |
  54. TABLE 42 Canada Titanium Dioxide Market Size, by Grade, 2021–2035 (USD Billion) |
  55. TABLE 43 Canada Titanium Dioxide Market Size, by Process, 2021–2035 (USD Billion) |
  56. TABLE 44 Canada Titanium Dioxide Market Size, by Application, 2021–2035 (USD Billion) |
  57. TABLE 45 Canada Titanium Dioxide Market Size, by End-User Industry, 2021–2035 (USD Billion) |
  58. TABLE 46 Mexico Titanium Dioxide Market Size, by Grade, 2021–2035 (USD Billion) |
  59. TABLE 47 Mexico Titanium Dioxide Market Size, by Process, 2021–2035 (USD Billion) |
  60. TABLE 48 Mexico Titanium Dioxide Market Size, by Application, 2021–2035 (USD Billion) |
  61. TABLE 49 Mexico Titanium Dioxide Market Size, by End-User Industry, 2021–2035 (USD Billion) |
  62. TABLE 50 China Titanium Dioxide Market Size, by Grade, 2021–2035 (USD Billion) |
  63. TABLE 51 China Titanium Dioxide Market Size, by Process, 2021–2035 (USD Billion) |
  64. TABLE 52 China Titanium Dioxide Market Size, by Application, 2021–2035 (USD Billion) |
  65. TABLE 53 China Titanium Dioxide Market Size, by End-User Industry, 2021–2035 (USD Billion) |
  66. TABLE 54 India Titanium Dioxide Market Size, by Grade, 2021–2035 (USD Billion) |
  67. TABLE 55 India Titanium Dioxide Market Size, by Process, 2021–2035 (USD Billion) |
  68. TABLE 56 India Titanium Dioxide Market Size, by Application, 2021–2035 (USD Billion) |
  69. TABLE 57 India Titanium Dioxide Market Size, by End-User Industry, 2021–2035 (USD Billion) |
  70. TABLE 58 Japan Titanium Dioxide Market Size, by Grade, 2021–2035 (USD Billion) |
  71. TABLE 59 Japan Titanium Dioxide Market Size, by Process, 2021–2035 (USD Billion) |
  72. TABLE 60 Japan Titanium Dioxide Market Size, by Application, 2021–2035 (USD Billion) |
  73. TABLE 61 Japan Titanium Dioxide Market Size, by End-User Industry, 2021–2035 (USD Billion) |
  74. TABLE 62 South Korea Titanium Dioxide Market Size, by Grade, 2021–2035 (USD Billion) |
  75. TABLE 63 South Korea Titanium Dioxide Market Size, by Process, 2021–2035 (USD Billion) |
  76. TABLE 64 South Korea Titanium Dioxide Market Size, by Application, 2021–2035 (USD Billion) |
  77. TABLE 65 South Korea Titanium Dioxide Market Size, by End-User Industry, 2021–2035 (USD Billion) |
  78. TABLE 66 Germany Titanium Dioxide Market Size, by Grade, 2021–2035 (USD Billion) |
  79. TABLE 67 Germany Titanium Dioxide Market Size, by Process, 2021–2035 (USD Billion) |
  80. TABLE 68 Germany Titanium Dioxide Market Size, by Application, 2021–2035 (USD Billion) |
  81. TABLE 69 Germany Titanium Dioxide Market Size, by End-User Industry, 2021–2035 (USD Billion) |
  82. TABLE 70 United Kingdom Titanium Dioxide Market Size, by Grade, 2021–2035 (USD Billion) |
  83. TABLE 71 United Kingdom Titanium Dioxide Market Size, by Process, 2021–2035 (USD Billion) |
  84. TABLE 72 United Kingdom Titanium Dioxide Market Size, by Application, 2021–2035 (USD Billion) |
  85. TABLE 73 United Kingdom Titanium Dioxide Market Size, by End-User Industry, 2021–2035 (USD Billion) |
  86. TABLE 74 France Titanium Dioxide Market Size, by Grade, 2021–2035 (USD Billion) |
  87. TABLE 75 France Titanium Dioxide Market Size, by Process, 2021–2035 (USD Billion) |
  88. TABLE 76 France Titanium Dioxide Market Size, by Application, 2021–2035 (USD Billion) |
  89. TABLE 77 France Titanium Dioxide Market Size, by End-User Industry, 2021–2035 (USD Billion) |
  90. TABLE 78 Brazil Titanium Dioxide Market Size, by Grade, 2021–2035 (USD Billion) |
  91. TABLE 79 Brazil Titanium Dioxide Market Size, by Process, 2021–2035 (USD Billion) |
  92. TABLE 80 Brazil Titanium Dioxide Market Size, by Application, 2021–2035 (USD Billion) |
  93. TABLE 81 Brazil Titanium Dioxide Market Size, by End-User Industry, 2021–2035 (USD Billion) |
  94. TABLE 82 Saudi Arabia Titanium Dioxide Market Size, by Grade, 2021–2035 (USD Billion) |
  95. TABLE 83 Saudi Arabia Titanium Dioxide Market Size, by Process, 2021–2035 (USD Billion) |
  96. TABLE 84 Saudi Arabia Titanium Dioxide Market Size, by Application, 2021–2035 (USD Billion) |
  97. TABLE 85 Saudi Arabia Titanium Dioxide Market Size, by End-User Industry, 2021–2035 (USD Billion) |
  98. TABLE 86 Report Scope & Methodology Summary |
  99. TABLE 87 Full Citation Reference Table (23 Sources)
  100. 13 LIST OF FIGURES |
  101. FIGURE 1 Global Titanium Dioxide Market Dynamics — Drivers, Restraints, and Opportunities |
  102. FIGURE 2 Titanium Dioxide Industry Value Chain Analysis |
  103. FIGURE 3 Porter's Five Forces Analysis — Global Titanium Dioxide Market |
  104. FIGURE 4 Global Titanium Dioxide Market Size Trend & Forecast (USD Billion), 2021–2035 |
  105. FIGURE 5 Global Titanium Dioxide Market Share, by Grade, 2025 (%) |
  106. FIGURE 6 Global Titanium Dioxide Market Share, by Process, 2025 (%) |
  107. FIGURE 7 Global Titanium Dioxide Market Share, by Application, 2025 (%) |
  108. FIGURE 8 Global Titanium Dioxide Market Share, by End-User Industry, 2025 (%) |
  109. FIGURE 9 Global Titanium Dioxide Market Share, by Region, 2025 (%) |
  110. FIGURE 10 North America Titanium Dioxide Market Size & Forecast (USD Billion), 2021–2035 |
  111. FIGURE 11 Europe Titanium Dioxide Market Size & Forecast (USD Billion), 2021–2035 |
  112. FIGURE 12 Asia-Pacific Titanium Dioxide Market Size & Forecast (USD Billion), 2021–2035 |
  113. FIGURE 13 South America Titanium Dioxide Market Size & Forecast (USD Billion), 2021–2035 |
  114. FIGURE 14 Middle East & Africa Titanium Dioxide Market Size & Forecast (USD Billion), 2021–2035 |
  115. FIGURE 15 Competitive Landscape — Market Share Analysis, 2025 |
  116. FIGURE 16 Competitive Benchmarking Radar Chart — Top 10 Players

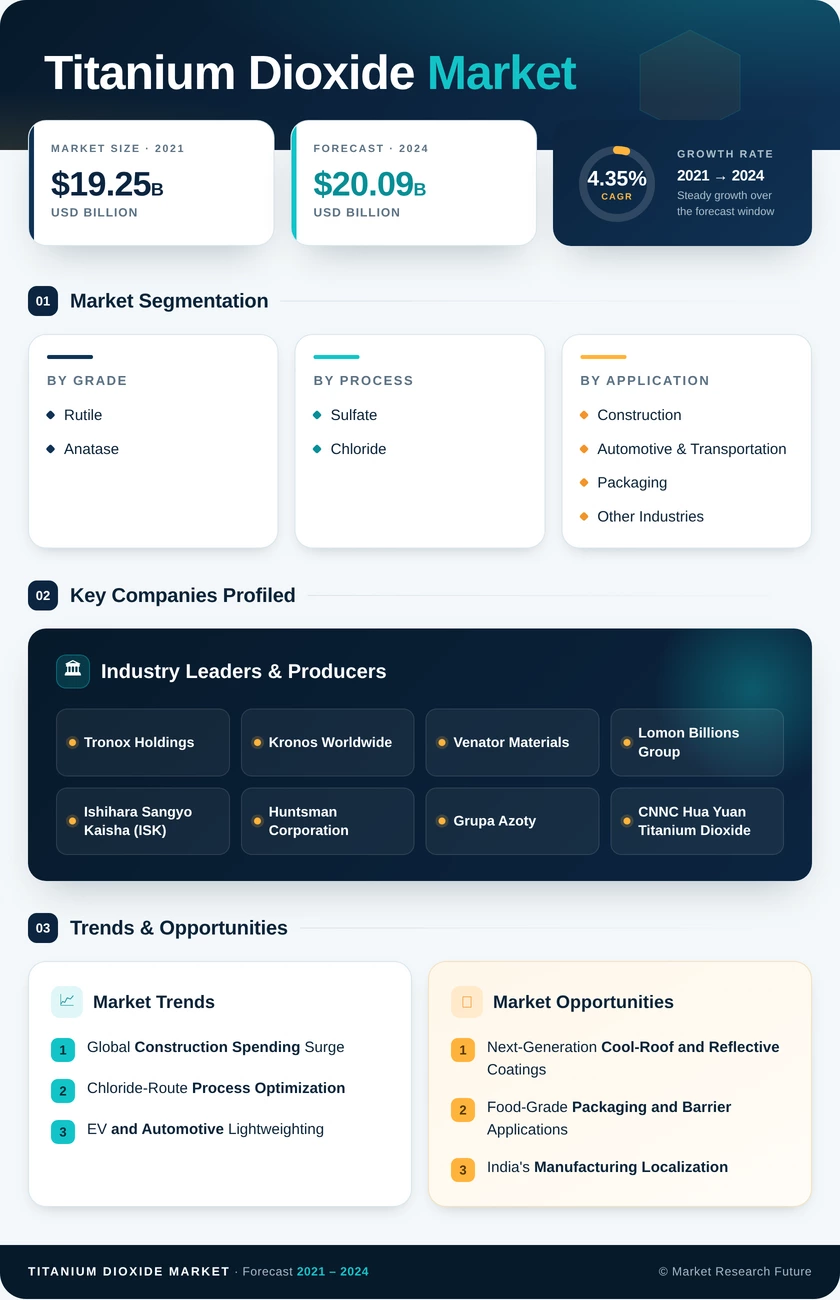
Segmentation Quick Reference

DimensionSub-SegmentsDominant SegmentFastest Growing Segment
By GradeRutile, AnataseRutile (72.1% share, 2025)Anatase (4.65% CAGR)
By ProcessChloride, SulfateSulfate (59.5% share, 2025)Chloride (4.89% CAGR)
By ApplicationPaints & Coatings, Plastics, Paper & Pulp, Cosmetics, Other ApplicationsPaints & Coatings (55.8% share, 2025)Plastics (4.67% CAGR)
By End-User IndustryConstruction, Automotive & Transportation, Packaging, Other IndustriesConstruction (40.3% share, 2025)Packaging (4.78% CAGR)
By GeographyAsia-Pacific, Europe, North America, South America, Middle East & AfricaAsia-Pacific (37.4% share, 2025)Asia-Pacific (5.16% CAGR)


Market Segmentation Overview

By Grade

Sub-SegmentKey Trend
RutilePreferred for exterior architectural and automotive coatings due to superior weathering resistance and opacity
AnataseGrowing in paper coatings, food-contact packaging, and mineral sunscreen formulations


Rutile remains the workhorse grade across paint, plastics, and industrial applications, while anatase is establishing itself in niche sectors where softer abrasion characteristics and cost efficiency outweigh pure durability requirements.

By Process

Sub-SegmentKey Trend
ChlorideExpanding share driven by lower environmental footprint and premium-grade output quality
SulfateDominant by installed capacity, especially across China's large-scale production facilities


The chloride-sulfate process split defines the competitive structure of global titanium dioxide manufacturing, with Western producers favoring chloride technology and Asian producers leveraging sulfate-route cost advantages.

By Application

Sub-SegmentKey Trend
Paints & CoatingsLargest application, driven by architectural and industrial maintenance demand cycles
PlasticsFastest-growing application, propelled by EV lightweighting and flexible packaging
Paper & PulpStable demand for printability and barrier properties in specialty papers
CosmeticsRising demand for mineral UV filters replacing chemical sunscreen actives
Other ApplicationsIncludes catalysts, ceramics, textiles, and food-grade uses


Paints and coatings continue to anchor more than half of global titanium dioxide consumption. Still, the plastics segment is gaining ground as automotive electrification and packaging modernization create new demand vectors.

By End-User Industry

Sub-SegmentKey Trend
ConstructionLargest end-user, tied to global urbanization and infrastructure stimulus
Automotive & TransportationTransitioning toward EV-specific coatings and lightweight polymer applications
PackagingFastest-growing end-user, driven by food-safety regulations and flexible film demand
Other IndustriesIncludes furniture, marine, aerospace, and specialty industrial applications


Construction's outsized share reflects titanium dioxide's fundamental role in architectural coatings, while packaging's rapid growth trajectory signals diversification beyond traditional paint-centric demand.

By Geography

Sub-SegmentKey Trend
Asia-PacificDominant producer and consumer; China's production base and India's localization drive regional leadership
EuropeRegulatory-driven innovation in encapsulated and dust-free product formats
North AmericaMature market sustained by residential renovation and cool-roof mandates.
South AmericaInfrastructure catch-up cycle, particularly in Brazil's construction and packaging sectors
Middle East & AfricaEmerging demand from Vision 2030 mega-projects and heat-reflective building coatings


Asia-Pacific's combined production capacity and consumption volumes make it the gravitational center of global titanium dioxide trade, though Europe and North America retain technology leadership in chloride-process manufacturing and specialty product development.