Toluene Market

Key Players: ExxonMobil Corporation, Sinopec Group, Royal Dutch Shell plc, BP plc, Reliance Industries Ltd., SABIC, SK Innovation Co., Ltd., Indian Oil Corporation

Toluene Market

Toluene Market Research Report Information by Product Type (Benzene and Xylene, Gasoline Additives, Solvents, Tri-Nitrotoluene (TNT), Toluene Diisocyanate (TDI) and others), Application (Paints & Coatings, Foams, Fuel Additives, Cleaning Agents, Heating Oils, Polymer Production and others), End-use Industry (Oil & Gas, Building & Construction, Automotive, Healthcare, Packing and others) and Region (North America, Europe, Asia-Pacific, Latin America and Middle East & Africa) - Forecast till 2035
ID: MRFR/CnM/0528-HCR
140 Pages
Chitranshi Jaiswal
Last Updated: June 16, 2026
 

Toluene Market Summary

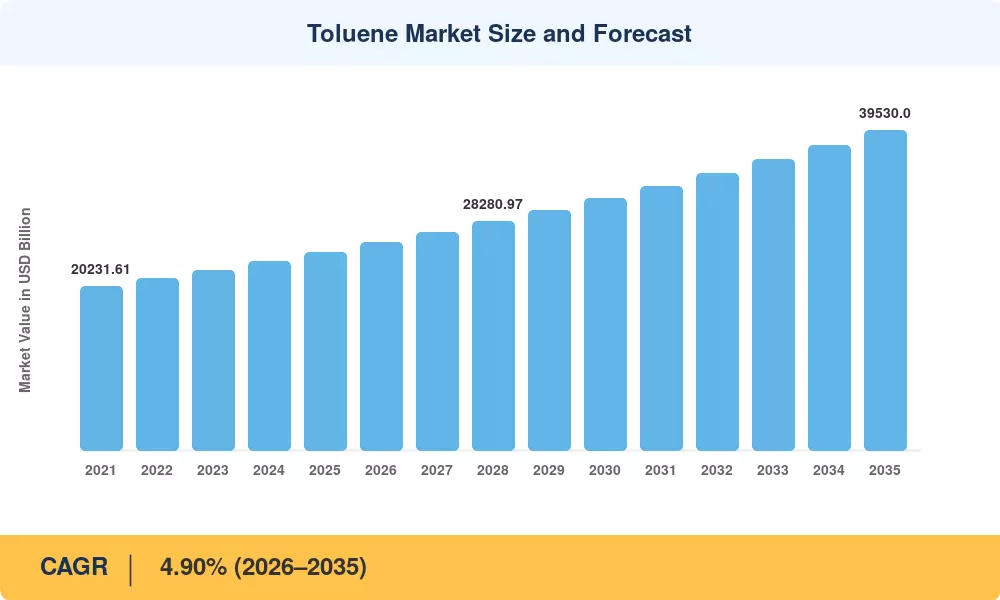
The global Toluene Market stood at USD 24,500 Million in 2025 and is projected to reach USD 25,700 Million in 2026 before climbing to USD 39,530 Million by 2035, registering a CAGR of 4.90% during the forecast period (2026–2035). This expansion is rooted in surging downstream demand for aromatic solvents used in benzene, xylene, and toluene diisocyanate (TDI) production, alongside tightening emissions mandates that compel refiners to upgrade petrochemical processing infrastructure. The U.S. EPA's 2024 revision of National Ambient Air Quality Standards for ozone-forming volatile organic compounds (VOCs) and China's 14th Five-Year Plan allocation of CNY 180 billion toward green chemical manufacturing are two concrete policy catalysts driving capital flows into cleaner toluene production technologies [2][3].

Legacy distillation and catalytic reforming units across aging refinery complexes are giving way to advanced hydrodealkylation and selective disproportionation systems. These technologies yield higher purity industrial solvents while reducing energy intensity by 12–18% per ton of output, according to the International Energy Agency's 2024 Petrochemicals Roadmap [4]. The shift is most pronounced in Asia-Pacific and the Middle East, where greenfield investments in integrated aromatics complexes exceed USD 22 billion committed through 2028.

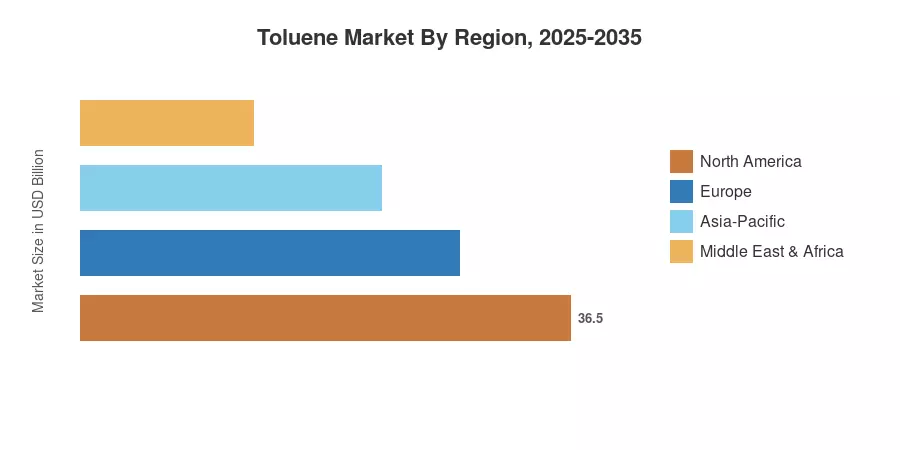
Asia-Pacific commands roughly 50.5% of the Toluene Market, making it the dominant region by a wide margin. It is also the fastest-growing region, expanding at a projected 5.90% CAGR through 2035, fueled by rapid industrialization in India and Southeast Asia North America holds the second-largest share at 20.8%, anchored by shale-derived feedstock advantages and robust chemical processing capacity along the U.S. Gulf Coast. Europe follows closely, where the EU REACH regulation framework continues to shape demand for low-VOC paint and coatings formulations. As downstream industries from automotive to construction intensify their consumption of hydrocarbon compounds, the Toluene Market is positioned for steady structural growth through the next decade.


Key Report Takeaways

• By Derivative

  • Benzene and xylene derivatives captured a combined 40.8% revenue share of the Toluene Market in 2025, reflecting their role as primary feedstocks for petrochemical processing chains
  • TDI is forecast to expand at a 5.80% CAGR through 2035, driven by polyurethane foam demand in construction and automotive cushioning

• By Application

  • The chemical industry accounted for 58.5% of Toluene Market volume in 2025, underscoring toluene's centrality as an intermediate in aromatic solvents production
  • Paint and coatings applications are advancing at a 5.15% CAGR, supported by infrastructure spending and rising demand for industrial solvents in protective coatings

• By End-User Industry

  • Automotive led end-user demand with a 22.6% share, where toluene serves as a critical fuel additive component and coating solvent
  • Construction is the fastest-growing end-user segment at a 5.20% CAGR, propelled by urbanization in Asia-Pacific and green building mandates in Europe

• By Region

  • Asia-Pacific captured 50.5% of the Toluene Market in 2025, with China alone representing over half of regional demand
  • North America's shale gas advantage sustains competitive feedstock pricing for chemical processing operations


Market Size and Forecast (2021–2035)

MRFR's projections combine bottom-up plant-capacity modeling with top-down demand estimation, triangulated against trade-flow data from UN Comtrade, ICIS, and proprietary refinery throughput surveys. Historical data (2021–2024) reflects actual production and trade volumes; forecast data (2026–2035) applies the calibrated 4.90% CAGR with adjustments for identified capacity additions and regulatory phase-ins.

Toluene Market Size and Forecast
Our Impact
Enabled $4.3B Revenue Impact for Fortune 500 and Leading Multinationals
Partnering with 2000+ Global Organizations Each Year
30K+ Citations by Top-Tier Firms in the Industry
 

Driver Impact Analysis

Driver ~% Impact on CAGR Geographic Relevance Impact Timeline
Downstream benzene/xylene demand expansion +1.3% Global Long-term (≥4 yr)
Construction-sector polyurethane (TDI) growth +0.9% Asia-Pacific, Europe Medium-term (2–4 yr)
Fuel additives regulations (octane enhancement) +0.7% North America, MEA Short-term (≤2 yr)
Paint and coatings infrastructure spending +0.6% Asia-Pacific, South America Medium-term (2–4 yr)
Integrated aromatics complex investments +0.5% Asia-Pacific, MEA Long-term (≥4 yr)
VOC-reduction technology upgrades +0.4% Europe, North America Medium-term (2–4 yr)
Shale-derived feedstock cost advantages +0.3% North America Short-term (≤2 yr)


Downstream Benzene and Xylene Demand Expansion

The constant pressure from downstream petrochemical processing facilities that hydrodealkylate and disproportionate toluene into benzene and xylene is the single biggest growth driver for the toluene market. Polystyrene, nylon, and cumene-phenol chains are predicted to be the main drivers of the 3.8% yearly growth in global benzene demand through 2035 [4]. The scale of investment directing more toluene into the production of hydrocarbon compounds is demonstrated by China's Zhejiang Petrochemical Phase II complex, which was put into service in 2024 and has a capacity of 4 million tons of aromatics annually.


Construction-Sector Polyurethane Growth

TDI-based polyurethane foams remain indispensable in insulation panels, spray foams, and cushioning for the construction and automotive industries. The World Bank estimates global construction output will reach USD 15.2 trillion by 2030, with emerging economies accounting for 57% of new building activity [8]. Every million square meters of insulated floor space consumes approximately 1,200 tons of TDI-derived foam, creating a durable demand pipeline for chemical processing of toluene into isocyanates.

Fuel Additives and Octane Enhancement

Toluene's high octane rating (114 RON) makes it a preferred blending component in premium gasoline formulations. The U.S. Environmental Protection Agency's Tier 3 gasoline sulfur standards have indirectly boosted toluene usage as refiners seek aromatic solvents to maintain octane after desulfurization [12]. In the Middle East, national oil companies are expanding domestic fuel additives blending capacity to meet Euro 5-equivalent vehicle standards, adding an estimated 1.8 million tons of annual toluene consumption by 2028.

Integrated Aromatics Complex Investments

Major investments in Asia-Pacific and the Middle East, such as HPCL’s Rajasthan complex, highlight the regional drive toward petrochemical self-sufficiency. Despite recent operational challenges—such as the April 2026 restoration efforts at the Rajasthan site—these integrated complexes are fundamentally designed to improve toluene recovery efficiency. By converting naphtha streams directly into high-value intermediates, these facilities are expected to reshape regional aromatic supply chains by late 2026, shifting the focus from imported feedstock to domestic output.


Restraints Impact Analysis

Restraint ~% Impact on CAGR Geographic Relevance Impact Timeline
Tightening VOC emission regulations –0.6% Europe, North America Short-term (≤2 yr)
Feedstock price volatility (crude/naphtha) –0.5% Global Medium-term (2–4 yr)
Bio-based solvent substitution –0.4% Europe Long-term (≥4 yr)
Health and safety compliance costs –0.3% Global Medium-term (2–4 yr)
Trade tariffs and geopolitical disruption –0.3% North America, Asia-Pacific Short-term (≤2 yr)


VOC Emission Regulations

Toluene's function in industrial solvent applications is changing due to the global trend toward lower VOC-emitting processes. Large-scale coating installations are under increasing pressure to reduce aromatic discharges due to revisions to frameworks such as the EU's Industrial Emissions Directive. The regulatory environment is forcing an accelerated shift toward low-VOC formulations, which effectively compresses margins for conventional solvent-based processes, even while toluene is still essential for high-performance applications where water-based alternatives currently perform poorly.


Feedstock Price Volatility

Toluene production costs are tightly coupled to crude oil and naphtha pricing. OPEC+ supply management decisions and geopolitical tensions in key producing regions can swing naphtha prices by 25–35% within a single quarter, squeezing margins for petrochemical processing operations that lack hedging strategies [14]. This volatility disproportionately impacts smaller producers in South America and Africa who lack scale-based purchasing power.

Bio-Based Solvent Substitution

R&D funding is being actively directed toward sustainable, bio-based chemical substitutes by European regulatory incentives, which are supported by the Green Deal Industrial Plan. Terpene-derived and fermentation-based solvents are making great strides in specialty, low-concentration formulations, but they are still not at full price parity with toluene for high-volume industrial applications. This is a long-term "substitution floor" for the toluene industry, where bio-based substitutes will gradually take market share as their cost-effectiveness rises through 2030.


Toluene Market Opportunities

High-Purity Toluene for Electronics Manufacturing

The semiconductor and flat-panel display industries require ultra-high-purity aromatic solvents (>99.95%) for photoresist stripping and wafer cleaning. Global semiconductor capital expenditure is forecast to exceed USD 190 billion annually by 2028 [18], creating a premium-priced niche within the Toluene Market for specialty-grade chemical processing output

Green Toluene Production via Catalytic Pyrolysis

Biomass-to-aromatics pathways using catalytic fast pyrolysis are progressing from pilot to demonstration scale. Anellotech's Bio-TCat technology has achieved 18% aromatic yield from non-food biomass, potentially offering a renewable route to hydrocarbon compounds that qualify for EU carbon credits

Emerging Market Infrastructure Build-Out

India's National Infrastructure Pipeline (USD 1.4 trillion through 2030) and Africa's urbanization wave — 950 million new urban dwellers by 2050 — will drive massive demand for paint and coatings, adhesives, and construction-grade polyurethane foam, all of which depend on toluene as a primary feedstock or solvent

Toluene-as-a-Service and Tolling Models

Integrated petrochemical producers are exploring tolling arrangements where downstream customers supply feedstock and pay processing fees, reducing working capital requirements. This service-based model transforms fixed-cost chemical processing assets into recurring-revenue platforms, particularly attractive for mid-size players in the Toluene Market seeking to monetize excess reforming capacity.

Hydrogen Carrier Applications

Toluene's ability to reversibly bind hydrogen through methylcyclohexane conversion positions it as a promising organic hydrogen carrier for long-distance energy transport. Japan's AHEAD consortium has demonstrated commercial-scale toluene-based hydrogen shipping from Brunei, signaling a potentially transformative new demand vector for fuel additives-grade toluene [19].


Toluene Market Future Outlook

Digitalization of Aromatics Production

Advanced process control systems powered by machine learning are enabling refiners to optimize toluene yield from catalytic reformers in real time. Resources estimates that AI-driven process optimization can improve aromatics selectivity by 5–8%, directly expanding output from existing assets without new capital expenditure. Early adopters in the Toluene Market — particularly in South Korea and Japan — are deploying digital twins of reformer units to simulate feedstock variability and maximize industrial solvents throughput.

Circular Economy and Solvent Recovery

Closed-loop solvent recovery systems are gaining traction as manufacturers seek to reduce both waste disposal costs and virgin aromatic solvents procurement. The European Solvents Industry Group reports that recovery rates for toluene in paint and coatings applications have risen from 42% to 61% between 2019 and 2024 [15]. By 2035, regulatory mandates in the EU and Japan are expected to push recovery rates above 80%, reshaping consumption patterns in the Toluene Market.

Hydrogen Economy Linkages

Toluene's role as an organic hydrogen carrier through the methylcyclohexane-toluene cycle is attracting strategic investment. Japan's Ministry of Economy, Trade and Industry has committed JPY 300 billion to hydrogen supply-chain infrastructure, with toluene-based transport identified as one of three priority pathways [19]. If this technology scales commercially, it could add 3–5 million tons of annual demand for fuel additives-grade toluene by the early 2030s, representing a structural shift in hydrocarbon compounds utilization.

ESG Reporting and Responsible Chemistry

Growing ESG disclosure requirements under the EU Corporate Sustainability Reporting Directive and the SEC's proposed climate rules are compelling chemical producers to quantify and reduce Scope 1 and 2 emissions associated with toluene manufacturing. Companies investing in low-carbon chemical processing — such as electric furnace-based reforming and renewable hydrogen integration — will command premium positioning in the Toluene Market as procurement departments prioritize suppliers with verified sustainability credentials [21].


Toluene Market Segmentation

By Derivative

Segment Key Metric Primary Demand Driver
Benzene and Xylene 40.8% share (2025) Downstream petrochemical processing
Gasoline Additives USD 5,380 Million (2025) Octane enhancement in premium fuels
Toluene Diisocyanates (TDI) 5.80% CAGR Construction polyurethane foams
Others USD 2,940 Million (2025) Specialty industrial solvents


Benzene and xylene derivatives dominate the toluene market landscape because toluene serves as the primary feedstock for hydrodealkylation (producing benzene) and selective disproportionation (producing paraxylene). These chemical processing routes supply raw materials for PET resin, nylon, and polycarbonate chains that serve packaging, textiles, and automotive sectors globally. China's paraxylene capacity additions — exceeding 15 million tons between 2020 and 2025 — have been a primary demand driver for toluene consumption in aromatic solvents conversion.

TDI's position as the fastest-growing derivative reflects the construction sector's insatiable appetite for rigid and flexible polyurethane insulation. Energy efficiency mandates in the EU, the U.S., and China are driving building codes that require thicker insulation panels, directly increasing toluene-derived isocyanate consumption.

By Application

Segment Key Metric Primary Demand Driver
Chemical Industry 58.5% share (2025) Intermediate feedstock conversion
Paints and Coatings 5.15% CAGR Infrastructure and automotive refinishing
Adhesives and Inks USD 2,870 Million (2025) Packaging and labeling growth
Others 4.40% CAGR Pharmaceuticals, rubber processing


The chemical industry's dominant share in the Toluene Market reflects toluene's fundamental role as a petrochemical processing intermediate. The majority of chemical-industry toluene consumption feeds benzene and paraxylene production, with growing volumes directed toward TDI and solvent-grade applications. Paint and coatings represent the second-most-significant application, where toluene functions as a fast-evaporating industrial solvent carrier in automotive OEM finishes, marine coatings, and architectural primers.

By End-User Industry

Segment Key Metric Primary Demand Driver
Automotive 22.6% share (2025) OEM coatings and fuel additives
Construction 5.20% CAGR Polyurethane insulation, adhesives
Oil and Gas USD 3,180 Million (2025) Wellbore fluids and aromatic solvents
Others 4.55% CAGR Electronics, textiles, pharmaceuticals


Automotive's leading share stems from dual consumption channels: toluene-based paint and coatings for vehicle finishing lines, and toluene as a high-octane fuel additive blending component. The transition to electric vehicles does not materially reduce coating demand — battery enclosures and lightweight composite body panels still require primer-surfacer systems based on hydrocarbon compounds. Construction's growth trajectory, meanwhile, is anchored in urbanization-driven insulation demand and the global push for net-zero-energy buildings.


Regional Market Share Analysis

Region Key Metric Primary Investment Themes
Asia-Pacific 50.5% market share (2025) Integrated aromatics complexes; construction boom
North America USD 5,100 Million (2025) Shale feedstock advantage; fuel additives
Europe 4.45% CAGR (2026–2035) VOC compliance; green chemistry transition
South America USD 1,420 Million (2025) Refinery modernization; infrastructure spending
Middle East & Africa 5.35% CAGR (2026–2035) Downstream diversification; petrochemical processing
Total USD 24,500 Million (2025)

The Toluene Market exhibits pronounced regional concentration, with Asia-Pacific alone commanding over half of global demand. Regional dynamics reflect feedstock availability, downstream industrial solvents consumption intensity, and regulatory frameworks governing aromatic solvents usage.


North America

Country Key Metric Key Driver
US 72.4% of regional share Gulf Coast refining cluster
Canada 4.80% CAGR Oil sands upgrader output
Mexico USD 620 Million (2025) Automotive manufacturing corridor


The U.S. Gulf Coast remains the backbone of North American toluene supply, with ExxonMobil's Baytown and Marathon Petroleum's Galveston Bay complexes accounting for substantial reforming capacity. Canada's oil sands upgraders produce toluene as a co-product of synthetic crude refining, while Mexico's expanding automotive sector — now the world's sixth-largest vehicle producer — sustains growing demand for paint and coatings and fuel additives.

Europe

Country Key Metric Key Driver
Germany 26.3% of regional share Automotive and chemical hubs
UK 4.50% CAGR Specialty chemical processing
France USD 510 Million (2025) Aerospace coatings demand
Italy 11.8% of regional share Paints and adhesives sector
Spain 4.30% CAGR Construction recovery
Nordic Countries USD 280 Million (2025) Green chemistry R&D
Russia 9.4% of regional share Refinery-integrated production
Rest of Europe 4.20% CAGR Diversified industrial demand


European regulatory pressure under REACH and the Industrial Emissions Directive is simultaneously constraining traditional industrial solvents use and stimulating innovation in low-emission aromatic solvents formulations. Germany's BASF Ludwigshafen complex and Shell's Pernis refinery in the Netherlands are investing in closed-loop toluene recovery systems that cut VOC releases by up to 40% while maintaining output volumes [3][9].

Asia-Pacific

Country Key Metric Key Driver
China 56.2% of regional share Massive aromatic complex capacity
India 6.20% CAGR Infrastructure and petrochemical processing growth
Japan USD 1,510 Million (2025) Electronics-grade purity demand
South Korea 8.7% of regional share Display and semiconductor manufacturing
ASEAN 5.80% CAGR Urbanization and construction
Rest of Asia-Pacific USD 680 Million (2025) Emerging refining capacity


China's dominance in the Toluene Market reflects its position as the world's largest producer and consumer of aromatic solvents. Sinopec and PetroChina operate reforming units with a combined capacity exceeding 12 million tons per year. India's Reliance Industries Jamnagar complex and HPCL's Rajasthan expansion are adding over 2.5 million tons of incremental toluene capacity, targeting both domestic chemical processing and export markets [7][10].

South America

Country Key Metric Key Driver
Brazil 64.8% of regional share Petrobras refinery upgrades
Argentina 4.60% CAGR Agricultural chemical demand
Rest of South America USD 270 Million (2025) Paint and coatings growth


Brazil's Petrobras-led refinery modernization program, budgeted at USD 16 billion through 2029, is upgrading catalytic reforming units to boost hydrocarbon compounds output and reduce import dependency for industrial solvents [11].

Middle East & Africa

Country Key Metric Key Driver
Saudi Arabia 38.5% of regional share Aramco downstream diversification
UAE 5.50% CAGR Construction and coatings demand
South Africa USD 145 Million (2025) Sasol coal-to-liquids toluene
Egypt 5.10% CAGR Refinery capacity additions
Rest of MEA USD 220 Million (2025) Emerging industrial base


Saudi Arabia's Vision 2030 economic diversification strategy is channeling billions into petrochemical processing complexes that convert crude-associated aromatics into exportable chemical intermediates. The Ras Al Khair and SATORP facilities position the kingdom as a net exporter of toluene and derivative products by 2028 [10].


Toluene Market By Region, 2025-2035
 

Competitive Benchmarking

The Toluene Market exhibits medium concentration, with the top five producers accounting for an estimated 32–38% of global output. The Herfindahl-Hirschman Index sits in the 600–900 range, indicating a moderately fragmented structure where large integrated oil majors compete alongside national oil companies and regional refiners. Scale advantages in feedstock procurement and downstream integration define the competitive moat for leading players.

Company Est. Revenue Share Range Key Offerings Strategic Positioning
ExxonMobil Corporation ~7–10% Reformate-grade toluene, aromatics processing Integrated upstream-to-chemicals leader
Sinopec Group ~6–9% Chemical-grade toluene, paraxylene conversion Dominant China producer
Royal Dutch Shell plc ~5–8% Solvent-grade toluene, fuel additives blending Global refining network
BP plc ~4–7% Industrial solvents, chemical intermediates European and U.S. Gulf Coast presence
Reliance Industries Ltd. ~4–6% Petrochemical processing, export-grade toluene India's largest private refiner
SABIC ~3–5% Aromatics, TDI feedstock Saudi integrated petrochemicals
SK Innovation Co., Ltd. ~3–5% High-purity toluene, battery solvents South Korea's technology leader
Indian Oil Corporation ~2–4% Domestic-grade toluene, fuel additives India's largest public refiner
Formosa Petrochemical Corp. ~2–4% Aromatics complex output, export volumes Taiwan integrated refiner
BASF SE ~2–3% Specialty-grade aromatic solvents, TDI European chemical processing leader


Recent News & Developments


Toluene Market Report Scope

Parameter Detail
Market Scope Global Toluene Market by Derivative, Application, End-User Industry, and Geography
Study Period 2021–2035
CAGR (Forecast) 4.90% (2026–2035)
Base Year Market Size USD 24,500 Million (2025)
Forecast Endpoint USD 39,530 Million (2035)
Fastest Growing Segment TDI by derivative; Construction by end-user; Asia-Pacific by region
Companies Profiled 10 (ExxonMobil, Sinopec, Shell, BP, Reliance, SABIC, SK Innovation, IOC, Formosa, BASF)
Valuation Currency USD Million


FAQs

How do toluene purity grades affect procurement pricing for electronics manufacturers?

Electronics-grade toluene (>99.95% purity) typically commands a 35–50% premium over industrial-grade product due to multi-stage distillation and stringent metal-ion specifications [18]. Buyers should negotiate annual volume contracts directly with refiners offering dedicated purification trains.

What hedging strategies can downstream buyers use against naphtha-linked toluene price swings?

Commodity swap contracts indexed to Platts or ICIS toluene assessments, combined with 60–90 day forward purchases, are the most common approaches [14]. Buyers consuming over 5,000 tons annually often secure formula-based pricing tied to quarterly naphtha benchmarks.

How does the methylcyclohexane hydrogen-carrier pathway compare to ammonia cracking for green hydrogen transport?

Toluene-based hydrogen transport offers higher volumetric density and a reusable carrier fluid, whereas ammonia requires energy-intensive cracking at the destination [19]. Toluene carriers are favored for medium-distance maritime routes under 5,000 kilometers.

What are the key compliance steps for exporting toluene to EU REACH-regulated markets?

Exporters must register toluene with ECHA above 1-ton annual thresholds and provide updated safety data sheets reflecting 2024 VOC classification amendments [3]. Pre-registration through an Only Representative simplifies market access for non-EU producers.

How do integrated refinery-petrochemical complexes achieve cost advantages over merchant toluene suppliers?

Integrated facilities capture 12–18% energy savings by sharing steam, hydrogen, and utilities across reforming and downstream aromatic solvents units [4]. Merchant suppliers face additional logistics and storage costs that widen the margin gap.

What role does toluene play in lithium-ion battery electrolyte solvent research?

Toluene derivatives are being explored as co-solvents in next-generation electrolyte formulations to improve thermal stability above 60°C [18]. Commercialization remains at the pilot stage, with projected volumes under 50,000 tons annually before 2030.

How are carbon border adjustment mechanisms expected to impact toluene trade flows between Asia and Europe?

The EU CBAM, effective in its transitional phase since 2026, will apply to embedded carbon in imported chemical intermediates, including toluene [21]. Asian exporters lacking verified low-carbon production data may face tariff surcharges of EUR 40–65 per ton.


FAQs

What is the current valuation of the Toluene Market as of 2024?

The Toluene Market was valued at approximately 3514.66 USD Million in 2024.

What is the projected market valuation for Toluene by 2035?

The Toluene Market is projected to reach approximately 4878.95 USD Million by 2035.

What is the expected CAGR for the Toluene Market during the forecast period 2025 - 2035?

The expected CAGR for the Toluene Market during the forecast period 2025 - 2035 is 3.03%.

Which companies are considered key players in the Toluene Market?

Key players in the Toluene Market include Benzene International, ExxonMobil Chemical, Shell Chemicals, TotalEnergies, and LyondellBasell Industries.

What are the main applications of Toluene in the market?

The main applications of Toluene include solvents, chemical intermediates, fuel additives, paint thinners, and adhesives.

How does the Toluene Market segment by end use?

The Toluene Market segments by end use into automotive, pharmaceutical, cosmetics, construction, and electronics.

What types of Toluene are available in the market?

Toluene is available in various types, including industrial grade, reagent grade, high purity grade, and technical grade.

What distribution channels are utilized in the Toluene Market?

Distribution channels in the Toluene Market include direct sales, online sales, distributors, and retail.

What forms of Toluene are present in the market?

Toluene is available in liquid, solid, and gas forms within the market.

What is the valuation range for Toluene used as a solvent?

The valuation range for Toluene used as a solvent is between 1050.0 and 1450.0 USD Million.
Author
Author
Author Profile
Chitranshi Jaiswal LinkedIn
Team Lead - Research
Chitranshi is a Team Leader in the Chemicals & Materials (CnM) and Energy & Power (EnP) domains, with 6+ years of experience in market research. She leads and mentors teams to deliver cross-domain projects that equip clients with actionable insights and growth strategies. She is skilled in market estimation, forecasting, competitive benchmarking, and both primary & secondary research, enabling her to turn complex data into decision-ready insights. An engineer and MBA professional, she combines technical expertise with strategic acumen to solve dynamic market challenges. Chitranshi has successfully managed projects that support market entry, investment planning, and competitive positioning, while building strong client relationships. Certified in Advanced Excel & Power BI she leverages data-driven approaches to ensure accuracy, clarity, and impactful outcomes.

Research Approach


Secondary Research

The secondary research process involved comprehensive analysis of regulatory databases, petrochemical industry publications, chemical manufacturing journals, and authoritative governmental and industry organizations. Key sources included the US Environmental Protection Agency (EPA), US Energy Information Administration (EIA), European Chemicals Agency (ECHA), European Environment Agency (EEA), International Energy Agency (IEA), International Council of Chemical Associations (ICCA), American Chemistry Council (ACC), National Institute for Occupational Safety and Health (NIOSH), Occupational Safety and Health Administration (OSHA), World Health Organization (WHO) Chemical Safety Program, OECD Chemicals and Biotechnology Committee, China Petroleum and Chemical Industry Federation (CPCIF), Ministry of Environment, Forest and Climate Change (India), Central Pollution Control Board (CPCB) India, Japan Petrochemical Industry Association (JPIA), REACH Regulation Database, Toxic Substances Control Act (TSCA) Inventory, and national petrochemical industry reports from key markets.

These sources were employed to gather production statistics, regulatory compliance data, safety and exposure studies, import/export trade flows, and market landscape analysis for benzene and xylene derivatives, solvents, toluene diisocyanate (TDI), trinitrotoluene (TNT), and gasoline additive applications.


Primary Research

Qualitative and quantitative insights were obtained by interviewing supply-side and demand-side stakeholders during the primary research process. The supply-side sources consisted of CEOs, VPs of Manufacturing Operations, refinery operations leaders, regulatory compliance officers, and commercial directors from toluene manufacturers, petrochemical conglomerates, and refinery operators. Supply chain directors from chemical distribution companies, polymer production managers, construction chemical specialists, automotive fuel additive formulators, foam producers, and procurement heads from paints and coatings manufacturers constituted demand-side sources. Market segmentation was verified, production capacity expansion timelines were confirmed, and insights regarding feedstock pricing dynamics, regulatory compliance costs, and substitution trends were obtained through primary research.

Primary Respondent Breakdown:

By Designation: C-level Primaries (28%), Director Level (35%), Others (37%)

By Region: North America (32%), Europe (30%), Asia-Pacific (35%), Rest of World (3%)


Market Size Estimation

Production capacity mapping and consumption volume analysis were employed to determine the global market valuation. The methodology comprised the following:

Identification of over 50 significant manufacturers in North America, Europe, Asia-Pacific, the Middle East, and Latin America

Product mapping throughout the production of benzene/xylene, solvent applications, TDI manufacturing, TNT production, petroleum additives, and other derivative categories Examination of annual revenues that are specific to toluene product portfolios, as reported and modeled

Manufacturers that account for 75-80% of the global market share in 2024 are included in the coverage.

Extrapolation is employed to generate segment-specific valuations by utilizing both bottom-up (consumption volume × ASP by region/application) and top-down (manufacturer revenue validation) methodologies. This methodology is specifically designed for the toluene market segments, which include the following: Product Types (Benzene & Xylene, Gasoline Additives, Solvents, TNT, TDI, Others), Applications (Paints & Coatings, Foams, Fuel Additives, Cleaning Agents, Heating Oils, Polymer Production), and End-Use Industries (Oil & Gas, Building & Construction, Automotive, Healthcare, Packaging).

Download Free Sample

Kindly complete the form below to receive a free sample of this Report

Download PDF ×

We do not share your information with anyone. However, we may send you emails based on your report interest from time to time. You may contact us at any time to opt-out.