Tractors Market

Key Players: CNH Industrial (Case IH / New Holland), AGCO Corporation (Fendt / Massey Ferguson), Mahindra & Mahindra, Kubota Corporation, TAFE (Massey Ferguson licensee), CLAAS, SDF Group (SAME Deutz-Fahr), Sonalika International

Tractors Market

Tractor Market Size, Share & Growth Analysis Report By Type (Utility Tractors (40–100 HP), Row-Crop Tractors (100–200 HP), Compact & Sub-Compact Tractors (<40 HP)), By Drive Type (Four-Wheel Drive (4WD), Two-Wheel Drive (2WD), Autonomous / Electric), By Application (Agriculture, Construction & Mining, Landscaping & Grounds Maintenance, Forestry) and By Regional (North America, Europe, South America, Asia Pacific, Middle East and Africa) - Industry Growth & Forecast to 2035
ID: MRFR/AT/10504-HCR
128 Pages
Shubham Munde, Swapnil Palwe
Last Updated: June 22, 2026

Tractor Market Summary

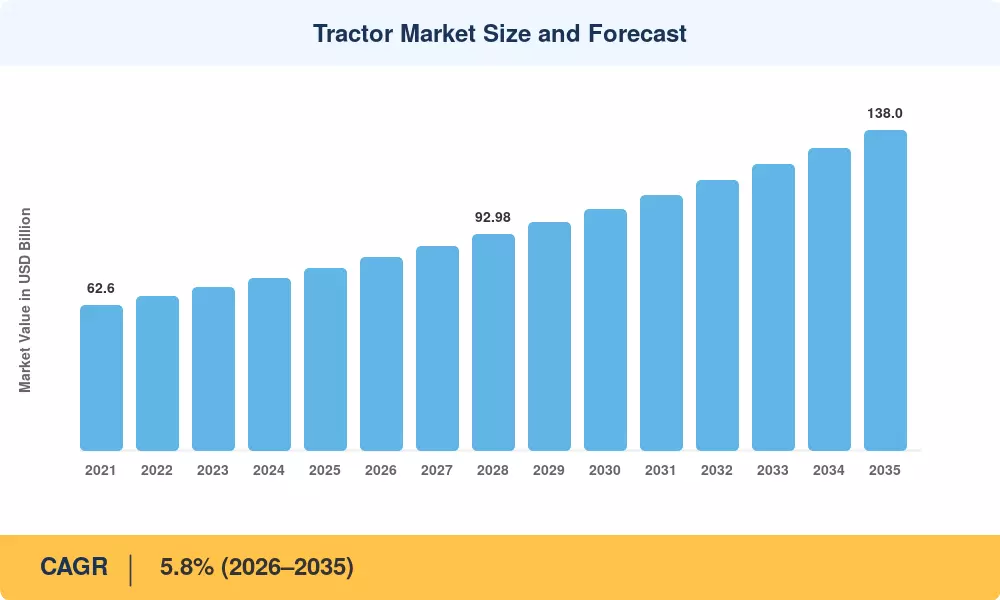
The global Tractor Market stood at an estimated USD 78.5 billion in 2025 and is projected to reach USD 138.0 billion by 2035, expanding at a CAGR of 5.8% during the 2026–2035 forecast window. This growth trajectory is anchored in two converging forces: the mechanization push across South and Southeast Asian agriculture—where India's Sub-Mission on Agricultural Mechanization (SMAM) alone disbursed over USD 480 million in subsidies between 2022 and 2025 [1]—and the fleet-replacement cycle underway in North America and Europe, where emissions-stage mandates (EU Stage V, EPA Tier 4 Final) are accelerating retirement of legacy diesel powertrains [2].

A technology shift is redefining what a tractor can do. Conventional mechanical-linkage machines are giving way to platforms integrated with satellite guidance, variable-rate implements, and real-time data telemetry. Deere & Company invested over USD 1.2 billion in precision-agriculture R&D between 2022 and 2024, while CNH Industrial acquired Raven Industries specifically to embed autonomy into its Case IH and New Holland lines [3]. Electric and hybrid drivetrains, still below 2% of unit sales, drew more than USD 600 million in venture and OEM capital commitments during 2023–2024 alone [4].

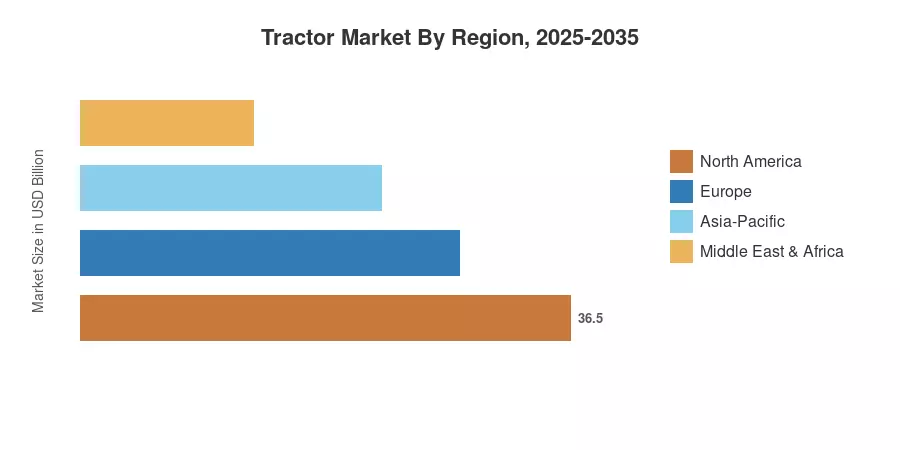
Asia-Pacific dominates the Tractor Market with roughly 42% revenue share, driven by India (the world's largest tractor-selling nation) and China's aggressive rural modernization programs. North America accounts for approximately 25% of global value, anchored by high-horsepower row-crop demand. Europe holds around 22%, with specialty and orchard segments growing steadily. As farm labor shortages intensify globally, the Tractor Market is poised for its most transformative decade since the diesel transition of the mid-twentieth century.


Key Report Takeaways

• By Type

  • Utility tractors (40–100 HP) command roughly 38% of the Tractor Market by revenue, reflecting broad applicability across mixed-farming operations worldwide.
  • Row-crop tractors (100–200+ HP) are forecast to grow at a CAGR of 6.4% through 2035, propelled by precision-agriculture adoption in grain-belt economies.
  • Compact and sub-compact tractors represent a USD 11.2 billion segment in 2025, expanding through lifestyle-acreage and municipal demand.

• By Drive Type

  • Four-wheel-drive platforms hold an estimated 54% unit share in the Tractor Market, reflecting the shift toward higher-traction field operations.
  • Autonomous and electric tractor platforms are projected to register the fastest segment CAGR at 14.5% through 2035.

• By Region

  • Asia-Pacific's dominance in the Tractor Market is reinforced by India's 900,000+ annual tractor unit sales.
  • North America contributes approximately USD 19.6 billion in 2025 value, with the U.S. accounting for over 78% of regional revenue.
  • Europe's Tractor Market benefits from CAP subsidy reform, incentivizing smart-farming equipment upgrades.


Tractor Market Size and Forecast (2021–2035)

Data for the historical period (2021–2024) is sourced from OEM revenue disclosures, national agricultural-equipment associations (AEM, FederUnacoma, TMA India), and customs trade databases. Forecast values (2026–2035) are generated using a bottom-up, segment-level build validated against macroeconomic agricultural-output projections from the FAO and World Bank [5].

Tractor Market Size and Forecast
Our Impact
Enabled $4.3B Revenue Impact for Fortune 500 and Leading Multinationals
Partnering with 2000+ Global Organizations Each Year
30K+ Citations by Top-Tier Firms in the Industry

Driver Impact Analysis

Driver ~% Impact on CAGR Geographic Relevance Impact Timeline
Smallholder mechanization subsidies ~22% India, SE Asia, Sub-Saharan Africa Short-term
Emissions-mandate fleet replacement ~18% North America, Europe Medium-term
Precision-agriculture integration ~17% North America, Europe, Brazil Medium-term
Rising farm labor costs ~15% Global Long-term
Electric and autonomous drivetrain R&D ~12% North America, Europe, China Long-term
Infrastructure-driven construction demand ~9% Middle East, Africa, India Medium-term
Lifestyle and estate-acreage expansion ~7% North America, Europe, Oceania Short-term


Smallholder Mechanization Subsidies

Small and marginal farmers in India can get up to 50% of their machine purchase costs under the SMAM program and state-level top-up payments. In order to maximize asset sharing in the 20–50 HP category, the program has built over 75,000 Custom Hiring Centers (CHCs) across the country and uses Direct Benefit Transfers to distribute hundreds of thousands of different implements each year [1]. The African Development Bank's "Feed Africa" initiative, which allocated USD 350 million for mechanized funding between 2023 and 2028, is spreading similar schemes throughout Kenya, Nigeria, and Ethiopia [12].


Emissions-Mandate Fleet Replacement

EPA Tier 4 Final and EU Stage V regulations have made pre-2014 tractor models increasingly expensive to operate due to parts obsolescence and fuel-efficiency penalties. The American Equipment Manufacturers Association estimates that roughly 28% of the U.S. tractor fleet exceeded 15 years of age in 2024, creating a replacement addressable pool valued at over USD 14 billion [9]. This regulatory push directly favors OEMs with compliant, higher-margin engine platforms.

Precision-Agriculture Integration

Guidance-ready tractors—those factory-equipped with ISOBUS connectivity and GPS steering—rose from 34% of new-unit shipments in 2021 to an estimated 52% in 2025 across North America and Western Europe [3]. John Deere's ExactApply and CNH's PLM platforms are converting hardware sales into recurring software subscriptions, raising per-unit aftermarket value by 12–18% over the ownership lifecycle [15].

Rising Farm Labor Costs

The U.S. Bureau of Labor Statistics reported a 26% increase in farm-worker hourly wages between 2019 and 2024. Comparable wage inflation in the EU (18%) and Australia (21%) is pushing growers toward higher-horsepower, operator-assist tractors that cover more hectares per labor-hour [16].


Restraints Impact Analysis

Restraint impact percentages represent estimated drag on the Tractor Market CAGR. These are directional, not additive.

Restraint ~% Drag on CAGR Geographic Relevance Impact Timeline
High upfront acquisition cost ~–25% Emerging economies Short-term
Fragmented land holdings ~–20% South Asia, Sub-Saharan Africa Long-term
Interest-rate and financing pressure ~–18% Global Short-term
Parts and service infrastructure gaps ~–15% Africa, Central Asia Medium-term
Right-to-repair regulatory uncertainty ~–12% North America, Europe Medium-term


High Upfront Acquisition Cost

In North America, a new 150 HP row-crop tractor typically costs between USD 190,000 and USD 260,000. Since 2020, this amount has increased by about 22% because of steel inflation, the incorporation of high-precision technology, and Tier 4 Final emission-control components [18]. Even a 45 HP model in India, which costs between USD 8,000 and USD 10,000, is more than most smallholders' yearly net income, making regional subsidy access the key factor enabling purchases throughout the tractor market.


Fragmented Land Holdings

The average operational holding in India is just 1.08 hectares, and across Sub-Saharan Africa it is below 2 hectares [1]. These micro-plots limit the economic justification for owning a full-size tractor, constraining demand to the sub-30 HP micro-tractor category or shared-ownership and rental models that compress OEM revenue per unit.

Interest Rate and Financing Pressure

Central-bank tightening cycles in 2023–2024 pushed U.S. agricultural-equipment loan rates above 7.5%, dampening new-equipment orders by an estimated 6% year-on-year in Q1 2024 [19]. While rate easing is anticipated through 2026, financing cost remains a headwind in the Tractor Market, particularly for mid-tier operations lacking collateral.


Tractor Market Opportunities

Electric and Hybrid Tractor Commercialization

The shift from pilot phases to commercial fleet production is being spearheaded by battery-electric tractors from well-known innovators like Monarch Tractor (MK-V) and significant legacy developers like CLAAS (via its eConcept prototypes). The upfront price premium for zero-emission farming equipment is practically halved by California's CORE incentive program, which gives up to USD 85,000 per unit [4]. The tractor market is expected to gain a high-margin electrification sub-segment worth an estimated USD 4.5 billion by 2032, thanks to these significant regional environmental incentives.


Autonomous Field Operations

Deere's fully autonomous 8R tractor received commercial deployment authorization in 2023. CNH Industrial and AGCO followed with Level 3+ pilot programs across Argentina and Australia [11]. As sensor costs decline and connectivity improves, autonomy will unlock 24-hour field operations and address the labor gap identified in Section 4.4.

Tractor-as-a-Service and Rental Platforms

Startups such as Trringo (Mahindra), EM3 AgriServices, and Gold Farm are building pay-per-hour rental networks targeting smallholders in India and East Africa. This model expands the addressable Tractor Market by converting non-owners into recurring service revenue streams.

Aftermarket Data Monetization

Connected tractors generate 5–10 GB of field and machine-health data per operating day. OEMs are packaging this telemetry into subscription analytics platforms—Deere's Operations Center, AGCO's Fuse—creating annuity-like revenue streams that lift customer lifetime value by an estimated 20–25% [15].

African and Southeast Asian Mechanization Gap

Sub-Saharan Africa has fewer than 3 tractors per 1,000 hectares of arable land, compared with over 25 in South Asia and 40+ in Europe [12]. Governments and multilateral lenders are increasing mechanization budgets, positioning the Tractor Market for double-digit growth in these frontier regions through 2035.


Tractor Market Future Outlook

Autonomy and Robotics Integration

Eight to twelve percent of new tractors sold in North America and Europe are predicted to have Level 3+ autonomous capacity by 2030 [11]. While Kubota and Yanmar are collaborating with robotics firms in Japan, Deere, CNH, and AGCO are developing autonomous stacks internally. Value-tier operator-driven machines and premium autonomous platforms will become more and more separated in the tractor market.


Electrification Trajectory

Battery-electric tractors will likely achieve cost parity with diesel equivalents in the sub-75 HP category by 2031–2033, according to the sources [14]. Larger-horsepower electrification depends on battery energy-density breakthroughs and grid infrastructure at the farm-gate. The Tractor Market's electrification arc mirrors the commercial-vehicle transition, but on a longer timeline given duty-cycle intensity.

Platform Economics and Software Revenue

OEMs are repositioning from hardware sellers to platform operators. Deere's fiscal-year 2024 technology revenue exceeded USD 700 million, and the company targets USD 1.5 billion by 2030 [15]. Subscription analytics, predictive-maintenance alerts, and agronomic-decision tools will raise the recurring-revenue share of Tractor Market economics from an estimated 4% in 2024 to over 12% by 2035.

Sustainability and ESG Reporting

Scope 3 agricultural emissions are now on the radar of food-and-beverage multinationals. As supply-chain disclosure rules tighten under the EU Corporate Sustainability Reporting Directive (CSRD) and SEC climate rules, farms face pressure to document fuel use and tillage practices [21]. Low-emission tractors become both a compliance tool and a brand differentiator in the Tractor Market.


Tractor Market Segmentation

By Type

Segment Key Metric Primary Demand Driver
Utility Tractors (40–100 HP) ~38% share Mixed farming; developing-market workhorse
Row-Crop Tractors (100–200 HP) CAGR 6.4% Precision large-acreage operations
Compact & Sub-Compact (<40 HP) USD 11.2 B (2025) Lifestyle acreage; municipal grounds
Specialty/Orchard Tractors ~8% share Vineyards; orchards; greenhouse
High-Horsepower (>200 HP) CAGR 6.1% Broadacre grain; articulated four-wheel


Utility tractors remain the backbone of the Tractor Market, particularly in South Asia and Sub-Saharan Africa, where versatile 50–75 HP platforms handle plowing, transport, and power-takeoff applications equally. India's top-selling models from Mahindra, TAFE, and Sonalika fall squarely into this bracket [8].

Row-crop tractors are the fastest-growing major segment by value. Precision-agriculture payloads—auto-steer, section control, yield monitoring—add USD 15,000–30,000 to the base price, lifting both unit transaction values and dealer margins across the Tractor Market [3].

By Drive Type

Segment Key Metric Primary Demand Driver
Four-Wheel Drive (4WD) ~54% unit share Higher traction; field-to-road versatility
Two-Wheel Drive (2WD) USD 22.5 B (2025) Cost-sensitive smallholder preference
Autonomous / Electric CAGR 14.5% Labor replacement; zero-emission mandates


Four-wheel-drive adoption has risen steadily as farmers prioritize traction in no-till and cover-crop systems. In the Tractor Market, 4WD penetration exceeds 70% in North America and is climbing past 40% in India, where it was below 25% a decade ago [9].

By Application

Segment Key Metric Primary Demand Driver
Agriculture ~82% share Core food-production mechanization
Construction & Mining CAGR 6.7% Infrastructure spending; earthmoving
Landscaping & Grounds USD 5.8 B (2025) Municipal, commercial property
Forestry ~3% share Timber harvesting and site prep


Agriculture overwhelmingly defines the Tractor Market, but construction-grade industrial tractors represent a high-growth niche. Caterpillar, JCB, and Kubota compete in this crossover space, supplying crawler and backhoe-loader tractor platforms for emerging-market infrastructure projects [12].


Regional Market Share Analysis

Region Key Metric Primary Investment Themes
Asia-Pacific ~42% global share Smallholder subsidies; compact-tractor demand
North America USD 19.6 B (2025) Precision-ag retrofit; fleet replacement
Europe CAGR 5.2% CAP reform; specialty and orchard segments
South America ~7% global share Agribusiness scale-up; Brazil soybean belt
Middle East & Africa CAGR 7.8% Infrastructure build-out; mechanization gap
Total USD 78.5 B (2025)

The Tractor Market exhibits strong regional variation driven by farm structure, policy regimes, and mechanization maturity.


Asia-Pacific

Country Key Metric Key Driver
India ~56% of regional revenue SMAM subsidies; monsoon-cycle replacement
China CAGR 5.6% Rural revitalization program; consolidation of farm plots
Japan USD 3.1 B (2025) Aging farmer demographic; automation adoption
South Korea ~3% of regional share Rice-paddy specialization; compact tractor demand
Rest of APAC CAGR 6.9% ASEAN mechanization initiatives


India alone sold over 940,000 tractor units in FY 2024, cementing its position as the single largest volume contributor to the global Tractor Market [8]. China's tractor demand is increasingly tilting toward the 80–120 HP category as the government promotes cooperative farming and land consolidation under the 14th Five-Year Plan [10].

North America

Country Key Metric Key Driver
United States ~78% of regional revenue Corn-belt fleet cycle; precision-ag
Canada CAGR 5.4% Prairie grain expansion; carbon-credit programs
Mexico USD 1.3 B (2025) Government PROAGRO subsidies


The U.S. Tractor Market benefits from the highest per-unit transaction value globally, with average selling prices exceeding USD 95,000 for row-crop models. Canada's growing canola and pulse acreage is driving incremental demand in the 150–250 HP class [9].

Europe

Country Key Metric Key Driver
Germany ~22% of regional revenue Fendt, CLAAS manufacturing hub
France CAGR 5.3% Wine and arable diversification
United Kingdom USD 2.1 B (2025) Post-Brexit ag-tech incentive schemes
Italy ~14% of regional share Orchard and vineyard specialty demand
Rest of Europe CAGR 5.0% Eastern Europe's modernization


The European Tractor Market is shaped by the Common Agricultural Policy, which from 2023 onward ties 25% of direct payments to eco-scheme compliance—effectively incentivizing tractor upgrades equipped with variable-rate and section-control capabilities [2].

South America

Country Key Metric Key Driver
Brazil ~68% of regional revenue Soybean, sugarcane mechanization
Argentina CAGR 6.1% Pampas grain-belt expansion
Rest of South America USD 0.9 B (2025) Andean and tropical diversification


Brazil's Plano Safra agricultural credit program allocated over BRL 400 billion for the 2024–2025 harvest cycle, with a significant portion directed toward equipment financing. This policy pipeline keeps the South American Tractor Market on an above-global growth trajectory [7].

Middle East & Africa

Country / Sub-Region Key Metric Key Driver
Turkey ~31% of regional revenue Domestic OEM base; export hub
South Africa CAGR 6.8% Commercial farming modernization
Rest of MEA CAGR 8.5% AfDB mechanization lending


The Middle East & Africa region represents the fastest-growing frontier for the Tractor Market, albeit from a small base. The African Development Bank's mechanization loans, combined with Indian OEM export strategies (Mahindra, TAFE, Sonalika), are seeding distribution networks across East and West Africa [12].


Tractor Market By Region, 2025-2035

Competitive Benchmarking

The Tractor Market is moderately concentrated, with an estimated HHI of approximately 1,400 and the top five companies holding a combined 50–55% revenue share. Deere & Company and CNH Industrial together account for roughly 30% of global sales, while Indian OEMs Mahindra & Mahindra and TAFE lead by unit volume.

Company Est. Revenue Share Range Key Offerings Strategic Positioning
Deere & Company ~15–18% 5–9 Series; autonomous 8R; ExactApply Technology leader; precision-ag ecosystem
CNH Industrial (Case IH / New Holland) ~12–15% Magnum, T-Series; Raven autonomy Full-line OEM; global dealer network
AGCO Corporation (Fendt / Massey Ferguson) ~8–11% Fendt 1000 Vario; Fuse platform Premium Europe focus: smart-farming
Mahindra & Mahindra ~7–10% Yuvo, Jivo, OJA series Volume leader India; Africa export push
Kubota Corporation ~6–8% M7, L-Series; Kubota Smart Agri Compact specialist; Japan and ASEAN
TAFE (Massey Ferguson licensee) ~4–6% MF 200 series; Eicher line India #2; price-value segment
CLAAS ~3–5% Axion, Xerion High-HP Europe; sugar-cane specialist
SDF Group (SAME Deutz-Fahr) ~2–4% 6-7-8-9 Series Southern Europe; orchard niche
Sonalika International ~2–3% Tiger, Worldtrak Emerging-market export; fast grower
Escorts Kubota ~2–3% Farmtrac, Powertrac India mid-tier; Kubota JV synergies


Recent News & Developments


  • CNH Industrial (March 2024): Completed integration of Raven Industries' autonomy stack across the Case IH Magnum AFS Connect line, delivering Level 2+ guidance as a factory option [3].
  • Monarch Tractor (June 2024): Secured USD 133 million Series C funding to scale production of the MK-V electric, driver-optional tractor at its Livermore, California facility [4].
  • Mahindra & Mahindra (September 2024): Opened a new tractor assembly plant in Pithampur, India, adding 100,000 units of annual capacity to meet domestic and export demand [8].
  • AGCO Corporation (November 2024): Unveiled the Fendt e100 Vario battery-electric compact tractor for commercial sale in Germany and France, targeting vineyard operations [14].
  • European Commission (January 2025): Published final rules under the EU Machinery Regulation (EU) 2023/1230 aligning tractor safety and cybersecurity standards with autonomous-operation readiness [2].
  • Kubota Corporation (March 2025): Announced a strategic partnership with NVIDIA to develop AI-based crop-row recognition for its next-generation autonomous tractor platform [11].


Tractor Market Report Scope

Parameter Detail
Market Scope Global Tractor Market — agricultural, construction, and grounds-maintenance applications
Study Period 2021–2035
CAGR 5.8% (2026–2035)
Market Size — 2025 (Base Year) USD 78.5 Billion
Market Size — 2035 (Forecast Endpoint) USD 138.0 Billion
Fastest Growing Segment Autonomous / Electric Tractors (CAGR 14.5%)
Companies Profiled 10 (Deere, CNH, AGCO, Mahindra, Kubota, TAFE, CLAAS, SDF, Sonalika, Escorts Kubota)
Valuation Currency USD (constant 2025 dollars)


FAQs

How does the right-to-repair movement affect tractor procurement decisions?

OEM software locks increasingly restrict independent servicing, adding 10–15% to lifetime maintenance costs. Buyers should evaluate dealer proximity and contractual service terms before committing to a locked ecosystem [20].

What financing structures are most common for high-horsepower tractor purchases?

Equipment-backed installment loans with 5–7 year terms dominate in North America, while lease-to-own models are growing in Europe. Interest subsidies through programs like USDA FSA loans can reduce effective rates by 150–200 basis points [19].

At what farm size does autonomous tractor investment become economically viable?

Current payback analyses suggest autonomous platforms break even on operations exceeding 800 hectares, primarily through labor savings. Smaller operations benefit more from shared-autonomy rental services [11].

How do tractor residual values differ between major OEM brands?

Deere tractors typically retain 55–65% of purchase price after five years, compared with 40–50% for most competitors. Strong residual value materially lowers the total cost of ownership [9].

What cybersecurity risks emerge from connected tractor platforms?

GPS spoofing and unauthorized telemetry access are documented vulnerabilities. The EU Machinery Regulation 2023/1230 now mandates cybersecurity-by-design for autonomous-capable machines sold after 2027 [2].

Can battery-electric tractors handle continuous heavy-draft fieldwork today?

Current battery-electric models deliver 4–8 hours of light-to-medium duty per charge. Heavy-draft operations like deep plowing still exceed available energy density, limiting electric viability to sub-100 HP tasks [14].

What role do tractor trade-in programs play in emerging-market growth?

OEMs like Mahindra and Sonalika operate certified pre-owned programs that feed affordable used tractors into Africa and Southeast Asia. These programs expand addressable demand by 15–20% in price-sensitive regions [8].    
Author
Author
Author Profile
Shubham Munde LinkedIn
Team Lead - Research
Shubham brings over 7 years of expertise in Market Intelligence and Strategic Consulting, with a strong focus on the Automotive, Aerospace, and Defense sectors. Backed by a solid foundation in semiconductors, electronics, and software, he has successfully delivered high-impact syndicated and custom research on a global scale. His core strengths include market sizing, forecasting, competitive intelligence, consumer insights, and supply chain mapping. Widely recognized for developing scalable growth strategies, Shubham empowers clients to navigate complex markets and achieve a lasting competitive edge. Trusted by start-ups and Fortune 500 companies alike, he consistently converts challenges into strategic opportunities that drive sustainable growth.
Co-Author
Co-Author Profile
Swapnil Palwe LinkedIn
Team Lead - Research
With a technical background as Bachelor's in Mechanical Engineering, with MBA in Operations Management , Swapnil has 6+ years of experience in market research, consulting and analytics with the tasks of data mining, analysis, and project execution. He is the POC for our clients, for their consulting projects running under the Automotive/A&D domain. Swapnil has worked on major projects in verticals such as Aerospace & Defense, Automotive and many other domain projects. He has worked on projects for fortune 500 companies' syndicate and consulting projects along with several government projects.
Download Free Sample

Kindly complete the form below to receive a free sample of this Report

Download PDF ×

We do not share your information with anyone. However, we may send you emails based on your report interest from time to time. You may contact us at any time to opt-out.