Trade Surveillance Systems Market

Key Players: NICE Actimize, Nasdaq (incl. Verafin), FIS, Software AG, IPC Systems, Eventus Systems, ACA Group, OneMarketData

Trade Surveillance Systems Market

Trade Surveillance Systems Market Size, Share and Research Report By Component (Solutions, Services), By Deployment Mode (On-Premise, Cloud), By Trading Type (Equities, Fixed Income, Derivatives, Digital Assets, Others (FX, Commodities)), By End-User (Sell-Side Institutions, Buy-Side Institutions, Exchanges & Market Operators, Regulators, Others (Clearing Houses, Trade Repositories)), By Organization Size (Tier-1 Global Banks, Tier-2 and Mid-Sized Firms, FinTech and Crypto Exchanges, Others (Regional Banks, Credit Unions)) and By Regional (North America, Europe, South America, Asia Pacific, Middle East and Africa) - Industry Forecast to 2035
ID: MRFR/ICT/6091-CR
147 Pages
Ankit Gupta, Shubham Munde
Last Updated: June 22, 2026

Trade Surveillance Systems Market Summary

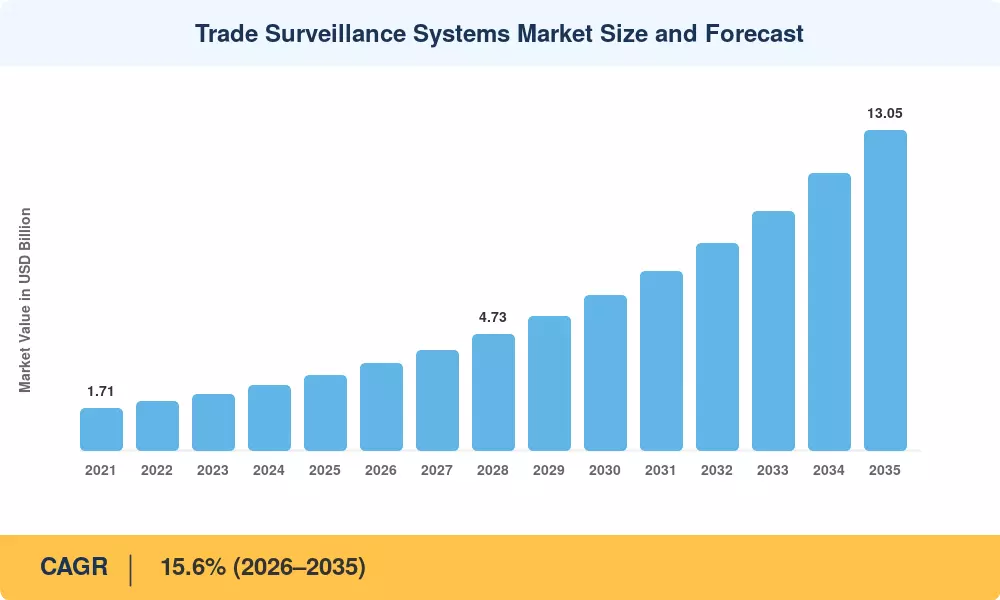
The Trade Surveillance Systems Market reached USD 3.06 billion in 2025 and is projected to grow from USD 3.54 billion in 2026 to USD 13.05 billion by 2035, registering a CAGR of 15.6% during the forecast period. Two policy-level catalysts underpin this expansion: the United States' Consolidated Audit Trail (CAT), which now ingests more than 58 billion order events daily across equity and options markets [1], and the European Securities and Markets Authority's ongoing MiFID II reporting revisions, which extended real-time transaction monitoring to systematic internalizers and organized trading facilities in late 2024 [2]. Institutions that once relied on end-of-day batch reviews are shifting budgets toward platforms capable of processing upwards of 150,000 transactions per second with sub-millisecond alert latency.

AI-driven architectures that include natural language processing, graph analytics, and reinforcement learning are replacing legacy rule-based engines, reducing false positives by up to 40% when compared to earlier generations of systems [3]. According to a poll, major sell-side banks allotted an expected USD 12.5 billion to compliance technology upgrades in 2024, with market manipulation detection capabilities ranking among the top three investment priorities [4]. This change is being accelerated by cloud-native installations, which provide mid-tier companies access to institutional-grade surveillance without requiring multimillion-dollar infrastructure expenditures.

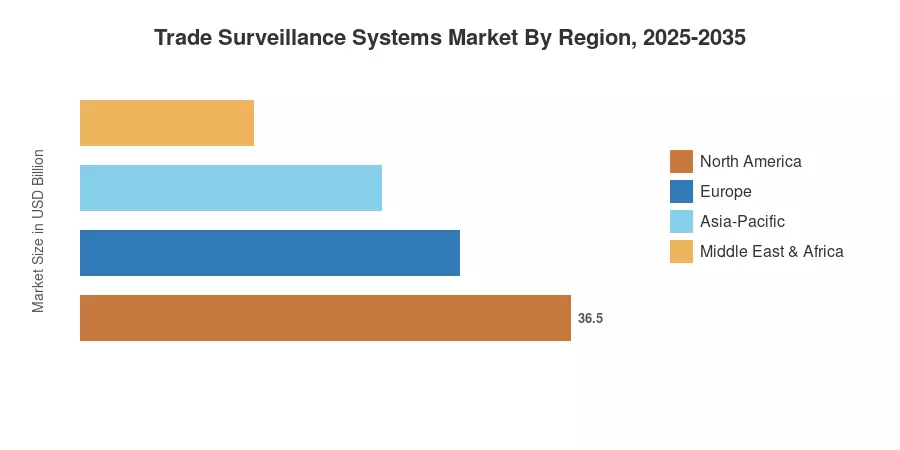
With 36.5% of worldwide revenue, North America has the greatest regional share thanks to FINRA's growing cross-market surveillance mandate and the SEC's strict enforcement stance. The fastest-growing region is Asia-Pacific, which is expected to develop at a compound annual growth rate (CAGR) of 19.0% through 2035 as regulators in South Korea, Japan, and India tighten control over digital asset exchanges and derivatives. Due to changing EMIR and MAR rules, Europe has the second-largest proportion. The market for trade surveillance systems is expected to increase steadily in double digits as financial markets become more intricate, digitized, and closely monitored.


Key Report Takeaways

• By Component

  • Solutions dominated the Trade Surveillance Systems Market with a 57.2% revenue share in 2025, reflecting demand for integrated analytics engines and dashboard toolkits.
  • Services are forecast to expand at a 19.4% CAGR through 2035 as managed surveillance and professional consulting engagements gain traction among mid-tier firms.


• By Deployment

  • Cloud deployment is projected to grow at a 20.5% CAGR from 2026 to 2035, outpacing on-premise installations as hybrid architectures address data-sovereignty concerns.

• By Trading Type

  • Equities accounted for 34.6% of the Trade Surveillance Systems Market in 2025, driven by high-frequency trading volumes and regulatory scrutiny of order-book manipulation.
  • Buy-side institutions record the highest end-user CAGR at 19.6%, as asset managers internalize compliance functions previously outsourced to prime brokers.


• By Region

  • North America held a 36.5% share of the Trade Surveillance Systems Market in 2025, anchored by SEC and CFTC enforcement activity.
  • Asia-Pacific exhibits the fastest regional CAGR of 19.0%, led by SEBI's algorithmic-trading surveillance framework in India and Japan's Financial Instruments and Exchange Act amendments.


Market Size and Forecast (2021–2035)

Market Research Future estimates are derived from a bottom-up methodology combining vendor revenue disclosures, regulatory spending surveys, and financial institution IT budget analyses. Historical values (2021–2024) are calibrated against audited annual reports and SIFMA/World Federation of Exchanges data, while forecast figures employ a compound growth model anchored to identified drivers and restraint offsets.

Trade Surveillance Systems Market Size and Forecast
Our Impact
Enabled $4.3B Revenue Impact for Fortune 500 and Leading Multinationals
Partnering with 2000+ Global Organizations Each Year
30K+ Citations by Top-Tier Firms in the Industry

Driver Impact Analysis

Driver ~% Impact on CAGR Geographic Relevance Impact Timeline
Stringent regulatory mandates (CAT, MiFID II, MAR) 25–30 Global Short-term (≤2 yr)
AI and machine-learning integration 20–25 North America, Europe Medium-term (2–4 yr)
Cloud and SaaS delivery models 15–18 Global Short-term (≤2 yr)
Digital-asset and DeFi market expansion 12–15 Global Medium-term (2–4 yr)
Cross-border trading complexity 8–10 Europe, Asia-Pacific Long-term (≥4 yr)
Real-time analytics and low-latency demand 7–9 North America Short-term (≤2 yr)
Insider-trading and spoofing enforcement surge 5–7 North America, Europe Long-term (≥4 yr)


Regulatory Mandate Escalation

The SEC's Consolidated Audit Trail rules require broker-dealers to monitor and report multi-asset order lifecycles. Under regulatory enforcement frameworks, non-compliance penalties for cross-market reporting failures push financial institutions to implement automated surveillance architectures. Simultaneously, ESMA's transaction reporting updates extend data tracking parameters across broader European bond and derivatives instrument categories.


AI and Machine-Learning Integration

To optimize supervisory efficiency, financial organizations utilize advanced data analytics models to screen communication data alongside trade logs. According to operational metrics monitored by financial regulators, transitioning to automated processing helps compliance frameworks reduce false-positive alerts. Implementing natural-language processing models cuts standard alert investigation timelines, optimizing resource allocation for complex institutional compliance.

Cloud and SaaS Delivery Models

Financial organizations are shifting infrastructure toward cloud-native software delivery models to lower initial capital deployment expenditures. Scalable cloud networks allow trading firms to distribute analytical compute processes dynamically while keeping localized sensitive financial data secure. This architectural model expands institutional-grade cross-market surveillance viability to mid-sized market entities previously limited by infrastructure costs.

Digital-Asset Market Expansion

The European Union’s Markets in Crypto-Assets Regulation establishes standardized market integrity rules across member nations. Similar licensing frameworks implemented by the Monetary Authority of Singapore and Hong Kong's SFC legally obligate asset custodians and exchanges to prevent manipulative trading. These global regulatory mandates require digital asset platforms to implement institutional compliance tooling


Restraints Impact Analysis

Restraint impact estimates represent directional headwinds to market expansion and are not directly subtracted from the CAGR. They reflect adoption friction, cost barriers, and regulatory ambiguity that slow vendor revenue realization.

Restraint ~% Negative Impact on CAGR Geographic Relevance Impact Timeline
High implementation cost and integration complexity –8 to –10 Global Short-term
Data-privacy conflicts across jurisdictions –5 to –7 Europe, Asia-Pacific Medium-term
False-positive alert fatigue –4 to –6 Global Short-term
Legacy system interoperability challenges –3 to –5 North America, Europe Long-term
Skilled compliance-technology talent shortage –2 to –4 Global Medium-term


Implementation Cost and Integration Complexity

Integrating enterprise-wide surveillance architectures demands substantial capital allocation. Multi-system data synchronization, model validation pipelines, and architectural testing cycles consistently extend implementation timelines by 12 to 18 months. This multi-year integration complexity presents a significant barrier for mid-market financial participants operating with fixed technological infrastructure budgets and restricted project-management capacity.


Data Privacy and Jurisdictional Conflicts

Cross-border data protection laws introduce profound architectural friction for global trading networks. Under sovereign frameworks like the EU's GDPR, differences in cross-border data transfer mechanisms cause average digital services imports to drop by over 8%. Compliance forces localized data-residency partitioning, which multiplies engineering expenses and fragments unified product deployment strategies.

False-Positive Alert Fatigue

Legacy logic-based detection infrastructure generates immense operational friction. Financial compliance audits indicate that up to 95% of initial rule-based surveillance system flags result in false positives, exhausting review teams. Although machine-learning systems mitigate this noise long term, initial 6 to 12-month calibration and parallel processing validation periods temporarily inflate total alert volumes.


Trade Surveillance Systems Market Opportunities

AI-Powered Predictive Surveillance

Next-generation platforms are shifting from retrospective pattern matching to predictive risk scoring. According to the United Nations Conference on Trade and Development (UNCTAD) digital policy briefs, advanced algorithmic models enhance oversight. These real-time structural processing platforms flag market manipulation and complex anomalies prior to trade execution, drastically reducing legal exposure for global banking groups.

Crypto and DeFi Surveillance Expansion

The market is capturing incremental demand as decentralized finance protocols fall under centralized monitoring guidelines. Following the implementation of European Securities and Markets Authority framework updates, digital asset service platforms face identical institutional compliance oversight. Cross-market compliance software providers are establishing integrated pipelines covering both public distributed ledgers and centralized trading registries.

Emerging-Market Regulatory Buildout

Developing nations are establishing electronic tracking structures for localized exchanges. For instance, India’s SEBI surveillance directive requires over 400 categorized brokerage institutions to implement automated processing tools. UNCTAD data confirms that institutional modernization across developing financial networks is driving high-growth target environments where automated vendor penetration previously remained below 15%.


Surveillance-as-a-Service Revenue Models

Subscription-hosted architectures are rapidly shifting the industry's baseline software procurement matrix toward continuous cloud delivery models. Regulated capital firms utilize these frameworks to minimize front-end technical budgets. Government trade database audits indicate that decentralized software-as-a-service compliance contracts are expanding at double the rate of legacy localized product licenses.

Trade Surveillance Systems Market Future Outlook

Generative AI and Autonomous Compliance

Large language models are entering surveillance workflows as investigation co-pilots, automatically drafting suspicious-activity narratives. According to United Nations technological forecasting models, artificial intelligence integration across automated financial administration systems optimizes resource allocations. This allows compliance infrastructure to manage end-to-end alert triaging efficiently, reducing heavy manual investigative human workloads at large institutions by 25% to 30%.

Consolidated Cross-Asset Surveillance Platforms

Institutions currently operate separate surveillance stacks for equities, fixed income, derivatives, and digital assets. Platform consolidation—driven by systemic cost pressures and regulatory expectations for holistic market-abuse detection—will be a defining trend through the 2030s. Software architectures that deliver unified monitoring across separate asset classes from a single interface will capture a dominant share of market demand.


Tokenized-Asset Proliferation

Intergovernmental financial infrastructure assessments from the Bank for International Settlements indicate that tokenized financial instruments are expanding rapidly across global private credit, real estate, and funds. Each tokenized asset introduces distinct order types, settlement mechanics, and manipulation risks. The surveillance software architecture must evolve efficiently to monitor on-chain distributed ledger entries and off-chain transactions simultaneously.


Regulatory Technology Standardization

Global standard-setters, including the Financial Stability Board, are developing common surveillance data taxonomies to improve cross-border enforcement. Interbank tracking networks confirm that widespread global migration to highly structured data reporting protocols simplifies technical vendor integration. Adopting these harmonized data messaging formats minimizes system switching friction while expanding the total addressable compliance technology environment.


Trade Surveillance Systems Market Segmentation

By Component

Segment Key Metric Primary Demand Driver
Solutions 57.2% share (2025) Integrated analytics and alert engines
Services 19.4% CAGR (2026–2035) Managed surveillance and consulting


Solutions remain the backbone of the Trade Surveillance Systems Market, encompassing real-time monitoring engines, case-management dashboards, and reporting modules. Large banks prefer integrated suites that consolidate alert generation, investigation workflows, and regulatory filing into a single platform. Services — including implementation consulting, model validation, and managed surveillance operations — are growing faster as mid-market firms outsource compliance technology management to reduce internal headcount requirements. Managed-surveillance contracts typically span three to five years and generate higher lifetime customer value than perpetual license arrangements.

By Deployment Mode

Segment Key Metric Primary Demand Driver
On-Premise 50.3% share (2025) Data-sovereignty and latency requirements
Cloud 20.5% CAGR (2026–2035) Elastic scalability and lower upfront cost


On-premise deployments continue to dominate the Trade Surveillance Systems Market among Tier-1 banks with strict data-residency policies, particularly in Germany, China, and Singapore. Cloud adoption is accelerating sharply, however, as hybrid architectures allow sensitive order data to remain on-premise while analytics workloads scale in the cloud. By the early 2030s, cloud and hybrid models are expected to surpass on-premise in total installed base.

By Trading Type

Segment Key Metric Primary Demand Driver
Equities 34.6% share (2025) HFT volume growth and spoofing detection
Fixed Income USD 0.52 Billion (2025) Bond-market transparency mandates
Derivatives 16.8% CAGR (2026–2035) Cross-margining complexity
Digital Assets 21.3% CAGR (2026–2035) MiCA and VASP licensing regimes
Others USD 0.18 Billion (2025) FX and commodities surveillance


Equities surveillance benefits from the deepest regulatory foundation globally, with the Trade Surveillance Systems Market anchored by decades of SEC, FCA, and ESMA enforcement precedent. Digital assets represent the fastest-growing trading-type segment as crypto exchanges and custodians adopt surveillance solutions to satisfy new licensing requirements across the EU, Singapore, Hong Kong, and the UAE.

By End-User

Segment Key Metric Primary Demand Driver
Sell-Side Institutions 36.8% share (2025) Broker-dealer regulatory obligations
Buy-Side Institutions 19.6% CAGR (2026–2035) In-house compliance internalization
Exchanges & Market Operators USD 0.48 Billion (2025) Self-regulatory surveillance mandates
Regulators 14.7% CAGR (2026–2035) National surveillance programme upgrades
Others USD 0.12 Billion (2025) Clearing houses, trade repositories


Sell-side institutions — investment banks, broker-dealers, and market makers — represent the largest end-user category due to direct regulatory obligations under Dodd-Frank, MiFID II, and equivalent national frameworks. Buy-side firms are the fastest-growing segment as asset managers and hedge funds increasingly establish dedicated surveillance functions rather than relying on executing brokers.

By Organization Size

Segment Key Metric Primary Demand Driver
Tier-1 Global Banks 38.2% share (2025) Multi-asset, multi-jurisdictional coverage
Tier-2 and Mid-Sized Firms USD 0.87 Billion (2025) Cost-efficient cloud and SaaS solutions
FinTech and Crypto Exchanges 23.1% CAGR (2026–2035) New licensing mandates
Others 11.4% CAGR (2026–2035) Regional banks and credit unions


Tier-1 global banks command the largest share of the Trade Surveillance Systems Market because their multi-asset, multi-jurisdictional trading operations require the most comprehensive surveillance architectures. FinTech and crypto exchanges are expanding the fastest, driven by regulatory regimes that now apply securities-equivalent surveillance standards to digital-asset platforms.


Regional Market Share Analysis

Region Key Metric Primary Investment Themes
North America 36.5% share (2025) CAT compliance, SEC/CFTC enforcement, AI adoption
Europe USD 0.79 Billion (2025) MiFID II refit, MAR expansion, DORA resilience
Asia-Pacific 19.0% CAGR (2026–2035) SEBI mandates, JFSA reforms, crypto licensing
South America USD 0.23 Billion (2025) CVM modernization, B3 exchange surveillance
Middle East & Africa 9.7% share (2025) DFSA/ADGM frameworks, Saudi CMA reforms
Total USD 3.06 Billion (2025)

The Trade Surveillance Systems Market exhibits significant regional variation driven by regulatory maturity, capital-market depth, and technology adoption curves.


North America

Country Key Metric Key Driver
United States 78.4% of regional share CAT, Dodd-Frank, FINRA Rule 3110
Canada 14.2% CAGR (2026–2035) IIROC cross-market surveillance
Mexico USD 0.04 Billion (2025) CNBV digital-asset licensing


The United States accounts for the vast majority of North American spending, driven by the SEC's record enforcement fines — exceeding USD 5 billion in fiscal year 2024 — and the operational demands of full CAT compliance [1]. Canadian regulators are mandating consolidated audit capabilities under IIROC's Universal Market Integrity Rules, while Mexico's CNBV is developing electronic surveillance requirements for its nascent crypto exchange ecosystem.

Europe

Country Key Metric Key Driver
Germany 21.3% of regional share BaFin algo-trading oversight
United Kingdom USD 0.19 Billion (2025) FCA market abuse enforcement
France 15.8% CAGR (2026–2035) AMF MiFID II supervision
Italy 10.4% of regional share CONSOB derivatives surveillance
Spain USD 0.05 Billion (2025) CNMV market reform programme
Nordic Countries 13.9% CAGR (2026–2035) Nasdaq Nordic exchange partnerships
Russia 3.1% of regional share MOEX self-regulatory surveillance
Rest of Europe USD 0.06 Billion (2025) EU-wide MAR harmonization


Europe's surveillance spending is shaped by the MAR and MiFID II frameworks, which impose near-identical transaction-reporting and order-surveillance obligations across EU member states [2]. The UK's FCA has emerged as a particularly aggressive enforcer post-Brexit, issuing over GBP 180 million in market-abuse fines in 2024 and driving British banks to upgrade legacy systems to AI-augmented platforms [12].

Asia-Pacific

Country Key Metric Key Driver
China 28.5% of regional share CSRC cross-market surveillance
India 21.7% CAGR (2026–2035) SEBI algo-trading mandates
Japan USD 0.11 Billion (2025) JFSA FIEA amendments
South Korea 16.8% CAGR (2026–2035) FSC crypto exchange oversight
ASEAN 12.4% of regional share MAS, SEC Thailand frameworks
Rest of Asia-Pacific USD 0.04 Billion (2025) Emerging exchange modernization


Asia-Pacific represents the Trade Surveillance Systems Market's highest-growth frontier. India's SEBI issued a comprehensive circular in 2024 mandating automated surveillance for all brokers with algorithmic trading access, creating immediate demand for cloud-native solutions among more than 400 qualifying firms [8]. Japan's 2025 FIEA amendments extend surveillance requirements to proprietary trading systems, while South Korea's FSC crypto licensing regime requires full order-book monitoring equivalent to listed securities standards.

South America

Country Key Metric Key Driver
Brazil 64.3% of regional share CVM Resolution 175
Argentina 15.9% CAGR (2026–2035) CNV digital-market reforms
Rest of South America USD 0.04 Billion (2025) Exchange consolidation


Brazil's Comissão de Valores Mobiliários (CVM) implemented Resolution 175 in 2024, requiring all registered intermediaries to maintain automated surveillance systems with audit-trail capabilities [17]. B3, the São Paulo exchange, expanded its own cross-market surveillance programme, creating partnership opportunities for global vendors seeking Latin American distribution.

Middle East & Africa

Country Key Metric Key Driver
Saudi Arabia 31.8% of regional share CMA Vision 2030 capital-market reforms
UAE 17.4% CAGR (2026–2035) DFSA/ADGM virtual-asset regulation
South Africa USD 0.05 Billion (2025) FSCA conduct-of-business framework
Egypt 14.1% CAGR (2026–2035) FRA exchange modernization
Rest of MEA 18.6% of regional share African exchange interoperability


Saudi Arabia's Capital Market Authority is investing heavily in surveillance infrastructure as part of Vision 2030's capital-market deepening agenda, while the UAE's DFSA and ADGM regulators mandate institutional-grade surveillance for all licensed virtual-asset service providers [18]. South Africa's FSCA is piloting AI-assisted market-abuse detection in partnership with the Johannesburg Stock Exchange.


Trade Surveillance Systems Market By Region, 2025-2035

Competitive Benchmarking

The Trade Surveillance Systems Market exhibits medium concentration, with the top five vendors accounting for an estimated 42–48% of global revenue. The Herfindahl-Hirschman Index (HHI) falls in the 900–1,200 range, indicating a competitive but not fragmented landscape. Vendor differentiation centers on AI-model sophistication, cross-asset coverage breadth, and deployment flexibility. Strategic acquisitions — such as Nasdaq's purchase of Verafin — have accelerated capability consolidation among top-tier players.

Company Est. Revenue Share Range Key Offerings Strategic Positioning
NICE Actimize ~10–13% SURVEIL-X platform; AI-driven alert analytics Broadest cross-asset surveillance suite; strong sell-side penetration
Nasdaq (incl. Verafin) ~9–12% Nasdaq Surveillance; Verafin financial crime Integrated exchange technology and surveillance; buy-side expansion
FIS ~7–10% Protegent surveillance suite Deep fixed-income and derivatives coverage; global bank relationships
Software AG ~5–8% Apama algorithmic trading & surveillance Real-time streaming analytics; CEP-engine heritage
IPC Systems ~4–6% Compliance Recordkeeper; trade-floor capture Voice and e-comms surveillance specialist
Eventus Systems ~3–5% Validus platform Cloud-native; rapid deployment for crypto exchanges
ACA Group ~3–5% ComplianceAlpha Buy-side and hedge-fund compliance focus
OneMarketData ~2–4% OneTick surveillance analytics Tick-data analytics; quantitative-strategy monitoring
Scila AB ~2–4% Scila Surveillance European exchange partnerships; Nordic coverage
Trading Technologies ~2–3% TT Score Machine-learning spoofing and layering detection


Recent News & Developments


  • Aquis Exchange(May 2026) -- The National Stock Exchange of Australia selected Aquis Equinox technology to integrate its advanced matching engine and trade surveillance tools.


  • NICE Actimize(April, 2026) -- The company released its 2026 Fraud Insights Report, highlighting critical shifts in digital fraud detection strategies for financial institutions globally.


  • NICE Actimize(April, 2026) -- The firm announced its ENGAGE 2026 conference agenda, bringing global experts together to discuss artificial intelligence, fraud prevention, and compliance.

Trade Surveillance Systems Market Report Scope

Parameter Detail
Market Scope Global Trade Surveillance Systems Market — solutions, services, deployment modes, trading types, end-users, organization sizes
Study Period 2021–2035
CAGR (Forecast Period) 15.6% (2026–2035)
Base Year Market Size USD 3.06 Billion (2025)
Forecast Endpoint USD 13.05 Billion (2035)
Fastest Growing Segment FinTech and Crypto Exchanges (by organization size); Digital Assets (by trading type)
Companies Profiled NICE Actimize, Nasdaq, FIS, Software AG, IPC Systems, Eventus Systems, ACA Group, OneMarketData, Scila AB, Trading Technologies
Valuation Currency USD Billion


FAQs

How long does a typical Trade Surveillance Systems Market platform take to deploy at a mid-sized bank?

Cloud-native deployments average 8–14 weeks, including data integration and model calibration. On-premise installations at mid-sized institutions typically require 6–9 months due to infrastructure provisioning and regulatory validation [10].

What differentiates AI-native surveillance vendors from legacy rule-engine providers?

AI-native platforms use unsupervised learning to detect novel manipulation patterns without pre-defined rules. Legacy systems rely on static thresholds that miss emerging abuse tactics and generate substantially higher false-positive rates [3].

Are Trade Surveillance Systems Market solutions interoperable with existing order-management systems?

Most vendors offer FIX-protocol and REST-API connectors for standard OMS integration. Custom middleware is typically required for proprietary or legacy execution platforms [11].

How do Trade Surveillance Systems Market vendors handle multi-jurisdictional data residency?

Leading providers deploy region-partitioned cloud instances with local encryption-key management. This architecture satisfies GDPR, PIPL, and PDPA requirements simultaneously [14].

What is the typical total cost of ownership for a Tier-1 bank's surveillance platform?

Three-year TCO for a Tier-1 institution ranges from USD 12 million to USD 20 million, covering licenses, integration, validation, and ongoing managed services [4].

Can Trade Surveillance Systems Market platforms monitor decentralized-exchange activity?

Several vendors now integrate on-chain analytics to track DEX order flow alongside centralized-exchange surveillance. Coverage remains partial for novel DeFi protocols [9].

How will generative AI reshape the Trade Surveillance Systems Market's competitive landscape?

Vendors embedding LLM-driven investigation co-pilots will compress alert resolution cycles and reduce analyst headcount. Firms without generative-AI roadmaps risk rapid market-share erosion [19].    
Author
Author
Author Profile
Ankit Gupta LinkedIn
Team Lead - Research
Ankit Gupta is a seasoned market intelligence and strategic research professional with over six plus years of experience in the ICT and Semiconductor industries. With academic roots in Telecom, Marketing, and Electronics, he blends technical insight with business strategy. Ankit has led 200+ projects, including work for Fortune 500 clients like Microsoft and Rio Tinto, covering market sizing, tech forecasting, and go-to-market strategies. Known for bridging engineering and enterprise decision-making, his insights support growth, innovation, and investment planning across diverse technology markets.
Co-Author
Co-Author Profile
Shubham Munde LinkedIn
Team Lead - Research
Shubham brings over 7 years of expertise in Market Intelligence and Strategic Consulting, with a strong focus on the Automotive, Aerospace, and Defense sectors. Backed by a solid foundation in semiconductors, electronics, and software, he has successfully delivered high-impact syndicated and custom research on a global scale. His core strengths include market sizing, forecasting, competitive intelligence, consumer insights, and supply chain mapping. Widely recognized for developing scalable growth strategies, Shubham empowers clients to navigate complex markets and achieve a lasting competitive edge. Trusted by start-ups and Fortune 500 companies alike, he consistently converts challenges into strategic opportunities that drive sustainable growth.

Research Approach


Secondary Research

The secondary research process involved comprehensive analysis of regulatory databases, financial markets legislation, peer-reviewed fintech journals, and authoritative banking and securities organizations. Key sources included the US Securities and Exchange Commission (SEC), Financial Industry Regulatory Authority (FINRA), Commodity Futures Trading Commission (CFTC), UK Financial Conduct Authority (FCA), European Securities and Markets Authority (ESMA), European Central Bank (ECB), Monetary Authority of Singapore (MAS), Hong Kong Monetary Authority (HKMA), Australian Securities and Investments Commission (ASIC), and the International Organization of Securities Commissions (IOSCO). These sources were used to collect regulatory compliance mandates, market abuse reporting statistics, algorithmic trading oversight requirements, and enforcement action data across MiFID II, Market Abuse Regulation (MAR), Dodd-Frank Act, and EMIR frameworks. Additional inputs were obtained from the Securities Industry and Financial Markets Association (SIFMA), Futures Industry Association (FIA), Swift Institute, FIX Trading Community, Bank for International Settlements (BIS), International Monetary Fund (IMF) Financial Stability Reports, and the World Federation of Exchanges (WFE) database. Technical standards were reviewed from ISO 23897 (Securities finance reference data) and ISO 20022 messaging repositories to map transaction monitoring requirements.


Primary Research

Supply-side and demand-side stakeholders were interviewed during the primary research process to acquire qualitative and quantitative insights regarding the integration of regulatory technology (RegTech), the incorporation of trade surveillance, and the modernization of compliance architecture. The supply-side sources consisted of CEOs, CTOs, Heads of Product Strategy, regulatory technology leaders, and commercial directors from trade surveillance platform vendors, financial market infrastructure providers, and RegTech solution developers. Chief Compliance Officers (CCOs), Heads of Market Surveillance, Chief Risk Officers (CROs), Head Traders, and procurement leads from tier-1 investment banks, broker-dealers, asset management firms, hedge funds, commodity trading advisors, and securities exchanges constituted our demand-side sources. Market segmentation was validated across cloud-native and on-premise deployments, RegTech roadmap timelines were confirmed, and insights were gathered on the adoption of artificial intelligence for behavioral analytics, cross-asset surveillance strategies, and budget allocation shifts under tightening global compliance frameworks through primary research.

Primary Respondent Breakdown:

By Designation: C-level Primaries (28%), Director Level (42%), Others (30%)

By Region: North America (32%), Europe (35%), Asia-Pacific (25%), Rest of World (8%)


Market Size Estimation

Global market valuation was derived through revenue mapping and transaction volume analysis across surveillance platforms. The methodology included:

Identification of 35+ key technology vendors and platform providers across North America, Europe, Asia-Pacific, and the Middle East

Product mapping across trade surveillance software, market abuse detection platforms, voice and electronic communications surveillance, and managed surveillance services across equities, fixed income, derivatives, and commodities asset classes

Analysis of reported and modeled annual revenues specific to trade surveillance and compliance technology portfolios, including breakdowns between perpetual licenses, SaaS subscriptions, and professional services

Coverage of vendors representing 65-70% of global market share in 2024, including pure-play RegTech firms and diversified financial technology conglomerates

Extrapolation using bottom-up (deployed surveillance instances × annual contract value by jurisdictional complexity) and top-down (vendor revenue triangulation against total compliance IT spending) approaches to derive segment-specific valuations across banking, brokerage, asset management, and exchange end-user categories

Download Free Sample

Kindly complete the form below to receive a free sample of this Report

Download PDF ×

We do not share your information with anyone. However, we may send you emails based on your report interest from time to time. You may contact us at any time to opt-out.