Transparent Display Market (2025 - 2035)

Transparent Display Market Size, Share and Research Report By Technology (LCD, OLED, Micro-LED, Others (E-Paper, Electroluminescent)), By End-User Industry (Retail & Digital Signage, Consumer Electronics & Smart Appliances, Automotive, Aerospace & Defense, Healthcare), By Application (Interactive Storefronts, Head-Up Displays (HUD), Smart Home Panels, Wearable Displays, Others), By Display Size (Less Than 10 Inches, 10–39 Inches, 40 Inches and Above) and By Regional (North America, Europe, South America, Asia Pacific, Middle East and Africa) - Industry Forecast to 2035.
ID: MRFR/SEM/6508-HCR
200 Pages
Ankit Gupta
Last Updated: July 02, 2026
Transparent Display Market
Market Size
Forecast Period2025-2035
CAGR (2025-2035)38.0%
2024 Market Size1.044(USD Billion)
2025 Market Size1.441(USD Billion)
2035 Market Size36.09(USD Billion)
Key Players
Samsung Electronics
LG Display
BOE Technology
Panasonic Corporation
Planar Systems
Visionox
Opportunities
  • Autonomous Vehicle Windshield Integration
  • Digital-Out-of-Home Advertising in Emerging Markets
  • Data-Driven Content Monetization

Transparent Display Market Summary

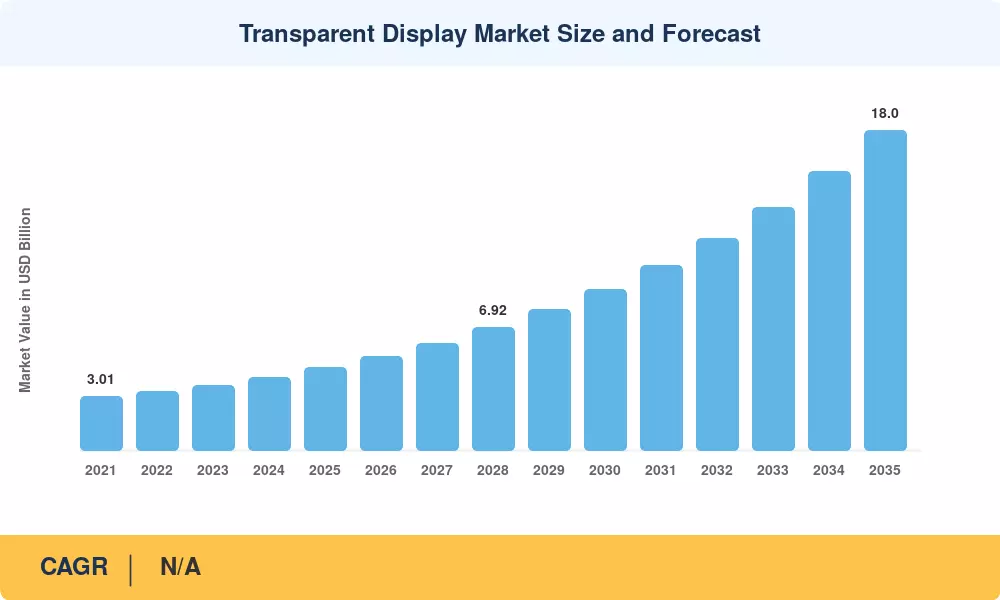
The Transparent Display Market was valued at USD 4.65 billion in 2025 and is projected to reach USD 5.28 billion in 2026, growing to approximately USD 18.00 billion by 2035 at a CAGR of 14.6% during the forecast period (2026–2035). Automotive OEMs now embed augmented-reality head-up displays as standard options on premium models, and the EU's Digital Storefronts Directive of 2024 has accelerated demand for interactive retail panels across 27 member states [1]. These regulatory and commercial catalysts are pulling the Transparent Display Market into a sustained expansion cycle.

Legacy static signage and conventional glass façades are giving way to digitally enabled surfaces that merge content delivery with physical transparency. Gen 8.6 OLED fabrication lines — each requiring upward of USD 3.2 billion in capital expenditure — are moving from pilot output to commercial yield rates above 65%, bringing unit costs down faster than analysts projected two years ago [2]. The transition from backlit LCD to emissive technologies is redrawing the supply chain.

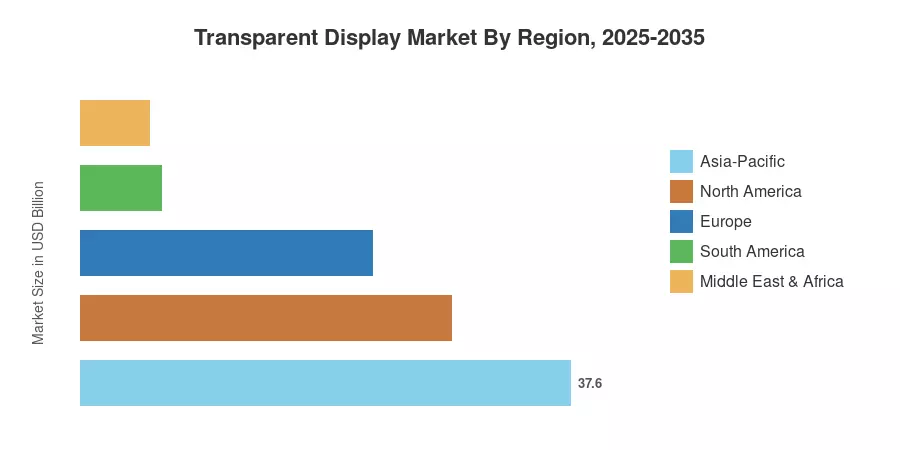
Asia-Pacific holds the dominant position in the Transparent Display Market with an estimated 37.6% revenue share in 2025, driven by panel manufacturing clusters in South Korea, China, and Japan. The region is also the fastest-growing, forecast to record a 15.3% CAGR through 2035. North America accounts for roughly 28.5% of revenue, anchored by retail digitization and defense cockpit programs. Europe follows at 22.4%, with smart-city investments across Germany and the Nordic Countries providing consistent demand.


Key Report Takeaways — Transparent Display Market

By Technology

  • Liquid-crystal display (LCD) held a 42.0% share of the Transparent Display Market in 2025, benefiting from established supply chains and competitive pricing.
  • Micro-LED technology is forecast to expand at a 17.0% CAGR from 2026 to 2035, outpacing all other technology segments as pixel-density requirements tighten.

By End-User Industry

  • Retail and digital signage led with an estimated 28.1% revenue share in 2025 as brands prioritize experiential storefronts.
  • Automotive end users are on track for a 17.5% CAGR through 2035, propelled by head-up display mandates in luxury and mid-tier vehicles.

By Region

  • Asia-Pacific secured 37.6% of global Transparent Display Market revenue in 2025 and remains the fastest-growing region at a projected 15.3% CAGR.
  • North America contributed approximately USD 1.32 billion in 2025 revenue, reflecting strong demand from defense and retail verticals.


Transparent Display Market Size and Forecast (2021–2035)

Market Research Future's estimates combine primary interviews with panel manufacturers, proprietary demand modeling, and validation against public financial filings. Historical figures (2021–2024) are derived from reported shipments; forecast values (2026–2035) reflect the calibrated 14.6% CAGR applied against the 2025 base year.
Transparent Display Market Size and Forecast
Our Impact
Enabled $4.3B Revenue Impact for Fortune 500 and Leading Multinationals
Partnering with 2000+ Global Organizations Each Year
30K+ Citations by Top-Tier Firms in the Industry

Driver Impact Analysis

Driver ~% Impact on CAGR Geographic Relevance Impact Timeline
Automotive AR head-up display mandates +2.8% Global Medium-term (2–4 yr)
Retail experience digitization +2.5% North America, Europe Short-term (≤2 yr)
Gen 8.6 OLED yield improvements +2.2% Asia-Pacific Medium-term
Smart-city infrastructure spending +1.8% Europe, Asia-Pacific Long-term (≥4 yr)
Defense transparent-armor cockpit R&D +1.4% North America Long-term
Consumer electronics miniaturization +1.2% Global Short-term
Digital-out-of-home advertising growth +1.0% Global Short-term


Automotive AR Head-Up Display Mandates

Euro NCAP's 2026 safety protocols assign bonus points to vehicles equipped with augmented-reality windshield displays, directly linking head-up display adoption to crash-test ratings [5]. Several European OEMs have responded by committing over USD 1.1 billion collectively to transparent panel integration across MY2027 model lines. This driver alone lifts the Transparent Display Market growth trajectory by an estimated 2.8 percentage points during the medium term.

Retail Experience Digitization

The National Retail Federation's 2025 survey found that 62% of top-50 U.S. retailers plan to install interactive storefront panels within 24 months [6]. Transparent panels allow merchandise to remain visible behind the display surface, a design advantage that traditional digital signage cannot replicate. This demand pulse is delivering roughly 2.5 percentage points of incremental growth to the Transparent Display Market in the near term.

Gen 8.6 OLED Yield Improvements

Samsung Display and BOE Technology have each reported yield rates on Gen 8.6 lines exceeding 68% as of Q4 2025, up from below 50% twelve months earlier [2]. Higher yields cut per-panel costs by approximately 18%, widening the addressable market for commercial installations. The Transparent Display Market benefits directly from this cost compression, with Asia-Pacific manufacturers capturing the majority of efficiency gains.

Smart-City Infrastructure Spending

The European Commission's Horizon Europe program has allocated EUR 1.4 billion to urban digitization projects between 2025 and 2029, with transparent wayfinding and transit panels explicitly listed as eligible categories [7]. Similar programs in South Korea and Singapore are embedding transparent displays into mass-transit stations and public buildings.


Restraints Impact Analysis

Impact estimates below are directional. They indicate how strongly each restraint offsets growth and should not be subtracted mechanically from the CAGR.

Restraint ~% Impact on CAGR Geographic Relevance Impact Timeline
High capital cost of emissive panel fabs –1.8% Global Medium-term
Indium-tin-oxide supply concentration –1.3% Ex-China markets Short-term
Limited outdoor luminance performance –1.0% Global Long-term
Fragmented interoperability standards –0.7% Europe, North America Medium-term
End-user ROI uncertainty –0.5% Global Short-term


High Capital Cost of Emissive Panel Fabrication

A single Gen 8.6 OLED fabrication line requires investment above USD 3 billion, and initial yield rates near 50% mean that cost recovery stretches beyond five years for most operators [11]. Vertically integrated manufacturers absorb this burden more readily, but mid-tier integrators face capital constraints that limit capacity additions and slow expansion of the Transparent Display Market.

Indium-Tin-Oxide Supply Concentration

Approximately 80% of refined indium originates from Chinese smelters, and spot prices outside China have risen above USD 400 per kilogram [12]. Integrators without long-term procurement contracts face margin compression of 200–400 basis points, constraining profitability across the Transparent Display Market supply chain.


Transparent Display Market Opportunities

Autonomous Vehicle Windshield Integration

The maturity of Level 3 and Level 4 autonomous driving platforms means complete windshield transparent display will be the main human-machine interface. Tier-1 vendors have already made prototypes of laminated waveguide windshields that can show navigation, hazard and entertainment layers at the same time. The addressable opportunity in driverless vehicles could approach USD 2.5 billion by 2033 [16].


Digital-Out-of-Home Advertising in Emerging Markets

Organised retail and transit infrastructure is growing fast in India, Brazil and Southeast Asian metros yet penetration of transparent panels is still around 3% in these regions. Advertising networks are also monetizing transparent bus-shelter and metro-station panels on a cost-per-thousand-impression basis which opens a recurring revenue stream for the Transparent Display Market.


Data-Driven Content Monetization

Transparent panels with embedded cameras and sensors create anonymised audience measurement data (dwell duration, gaze direction, demographic inference) that retailers can package as first-party analytics solutions [17]. This data layer turns a capital expense into an asset that generates revenue, allowing Transparent Display Market buyers to realize ROI benefits.


Healthcare and Laboratory Visualization

Clear panels can be used in operating rooms and other cleanroom settings to overlay patient vital signs or process control data into the clinician’s line of sight without blocking the direct view. Healthcare is a high-growth segment in the Transparent Display Market, with the worldwide smart-hospital construction pipeline projected at USD 68 billion through 2030 [18].


Defense and Aerospace Cockpit Modernization

The U.S. Department of Defense's Next-Generation Fixed-Wing program has specified transparent cockpit canopies with integrated situational-awareness overlays [8]. Allied NATO countries are expected to follow with similar procurement standards, creating a multi-billion-dollar defense addressable market for the Transparent Display Market over the long term.


Transparent Display Market Future Outlook

AI-Driven Content Personalization

Edge-AI processors embedded in transparent panels will enable real-time audience detection and content adaptation by 2028. Panels will shift from static scheduling to contextual rendering — adjusting messaging based on foot-traffic density, ambient light, and even individual gaze patterns. The global edge-AI chipset market, forecast to exceed USD 38 billion by 2030 [24], will supply the compute layer that turns the Transparent Display Market into an intelligent media platform.

Platform Economics and Display-as-a-Service

Hardware-centric revenue models are giving way to subscription-based Display-as-a-Service (DaaS) offerings that bundle panel leasing, content management, and analytics. DaaS reduces upfront capital requirements by 40–60%, lowering the adoption barrier for mid-market retailers and transit authorities. This shift toward recurring revenue will reshape competitive dynamics across the Transparent Display Market between 2028 and 2032 [25].

Sustainability and Circular-Economy Manufacturing

IEA data projects that display manufacturing will account for 2.1% of global electricity consumption in the electronics sector by 2030 [26]. Transparent panel makers are responding with cadmium-free quantum-dot films, solvent-recovery systems, and modular designs that simplify end-of-life recycling. ESG-conscious procurement policies in the EU and California are expected to favor suppliers demonstrating lifecycle carbon reductions, adding a sustainability premium to the Transparent Display Market.

Convergence with Mixed-Reality Ecosystems

As extended-reality headsets become lighter and more affordable, transparent displays will serve as the ambient complement — providing shared, public-facing AR content that individual headsets cannot replicate. The convergence between personal XR devices and architectural transparent surfaces will create a layered media environment, expanding the total addressable market for the Transparent Display Market beyond traditional signage into spatial computing.


Transparent Display Market Segmentation

By Technology

Segment Metric Primary Demand Driver
LCD 42.0% share (2025) Cost efficiency, established supply base
OLED USD 1.38 Billion (2025) Superior contrast, thinness
Micro-LED 17.0% CAGR (2026–2035) High brightness, long lifespan
Others (E-Paper, Electroluminescent) USD 0.19 Billion (2025) Low-power niche applications


LCD technology continues to anchor the Transparent Display Market because of mature fabrication infrastructure and competitive unit costs. Retailers deploying high-volume signage programs often select LCD for total-cost-of-ownership advantages, even as transparency ratios lag behind emissive alternatives. OLED is the premium incumbent, favored in automotive and consumer electronics for its ability to deliver deep blacks on a thin, flexible substrate.

Micro-LED is the fastest-advancing technology in the Transparent Display Market, offering peak luminance above 5,000 nits — roughly three times that of OLED — along with resistance to burn-in. Apple's investment in Micro-LED die-transfer processes and Samsung's modular Micro-LED wall product are accelerating commercialization timelines. Analysts expect Micro-LED to cross the 10% revenue-share threshold by 2030 as manufacturing yields improve [9].

By End-User Industry

Segment Metric Primary Demand Driver
Retail & Digital Signage 28.1% share (2025) Experiential storefront demand
Consumer Electronics & Smart Appliances USD 0.98 Billion (2025) Smart-home integration
Automotive 17.5% CAGR (2026–2035) AR HUD adoption
Aerospace & Defense USD 0.42 Billion (2025) Cockpit modernization
Healthcare 14.8% CAGR (2026–2035) Operating theater visualization


Retail and digital signage remains the revenue leader in the Transparent Display Market as brands compete for foot traffic in an increasingly omnichannel landscape. Flagship stores from luxury fashion houses to consumer electronics chains are replacing opaque window displays with see-through panels that showcase merchandise while delivering promotional content.

Automotive is closing the gap rapidly. Euro NCAP bonus scoring and consumer expectations for connected cockpits are pulling transparent display integration from concept vehicles into mass-production platforms. The Transparent Display Market stands to benefit from OEM commitments spanning 2027–2032 model years across European and East Asian brands [5].

By Application

Segment Metric Primary Demand Driver
Interactive Storefronts 34.7% share (2025) Omnichannel retail strategy
Head-Up Displays (HUD) 17.1% CAGR (2026–2035) Automotive safety regulations
Smart Home Panels USD 0.37 Billion (2025) IoT ecosystem growth
Wearable Displays 15.2% CAGR (2026–2035) AR glasses miniaturization
Others USD 0.21 Billion (2025) Industrial, medical


The Interactive Storefronts segment is the largest in the transparent display market and is projected to grow at a CAGR of 34.7% during the forecast period. On the other hand, the Head-Up Displays (HUD) category has been crowned as the fastest-growing vertical, expected to grow at a healthy CAGR of 17.1% (2026–2035) owing to the stringent vehicle safety standards.


By Display Size

Segment Metric Primary Demand Driver
Less Than 10 Inches 12.6% share (2025) Wearables and instrument clusters
10–39 Inches USD 1.68 Billion (2025) Appliance panels, automotive HUD
40 Inches and Above 49.0% share (2025) Large-format retail signage


Panels at 40 inches and above dominate the Transparent Display Market because the value proposition of transparent content delivery scales with physical surface area. Large-format installations in retail, transit, and corporate lobbies command higher average selling prices and longer replacement cycles. Smaller panels below 10 inches are growing steadily as AR eyewear and automotive instrument clusters drive demand for compact, high-resolution transparent surfaces.


Regional Market Share Analysis

Region Revenue Share (2025) Primary Investment Themes
Asia-Pacific 37.6% Panel manufacturing scale, smart-city programs
North America 28.5% Defense R&D, retail digitization
Europe 22.4% Urban mobility, sustainability regulations
South America 6.2% Transit advertising, organized retail expansion
Middle East & Africa 5.3% Mega-project construction, tourism infrastructure
Total 100.0%


North America

Country CAGR (2026–2035) Key Driver
United States 14.2% Defense HUD procurement and luxury retail
Canada 13.5% Smart-transit and public-space digitization
Mexico 12.8% Nearshored manufacturing and DOOH advertising


The United States accounts for the majority of North American spending in the Transparent Display Market, led by Department of Defense cockpit modernization contracts and high-profile retail rollouts across flagship stores in New York, Los Angeles, and Miami. Canada's federal Smart Cities Challenge has funded transparent wayfinding panels in Toronto and Vancouver transit hubs, while Mexico benefits from nearshoring trends that are drawing display assembly capacity to Monterrey and Guadalajara [19].

Europe

Country Share of Regional Revenue (2025) Key Driver
Germany 24.8% Automotive OEM integration
United Kingdom 19.2% Luxury retail and financial-district signage
France 15.6% Smart-city transit programs
Italy 11.4% Fashion retail and tourism
Spain 8.7% Hospitality and airport modernization
Nordic Countries 9.1% Public-sector digitization
Russia 4.5% Limited adoption; import constraints
Rest of Europe 6.7% Various


Germany's automotive corridor drives the largest share of European demand within the Transparent Display Market, as OEMs in Stuttgart and Munich integrate AR windshield technology into next-generation vehicles. The UK follows with luxury retail installations along Bond Street and Mayfair. France's Grand Paris Express project has specified transparent wayfinding displays across 68 new stations scheduled to open between 2026 and 2030 [20].

Asia-Pacific

Country Revenue (USD Billion, 2025) Key Driver
China 0.68 Panel manufacturing dominance
Japan 0.41 Consumer electronics innovation
South Korea 0.38 OLED fab leadership
India 0.14 Retail and DOOH advertising
ASEAN 0.10 Smart-building and tourism
Rest of Asia-Pacific 0.04 Various


Asia-Pacific remains the engine room of the Transparent Display Market, with South Korea and China hosting the world's largest OLED and Micro-LED fabrication complexes. Japan's consumer electronics brands are integrating transparent panels into premium home appliances and point-of-sale terminals. India's National Smart Cities Mission has earmarked transparent display installations for 12 metro systems, positioning the country as a fast-emerging demand center [21].

South America

Country CAGR (2026–2035) Key Driver
Brazil 13.8% Organized retail expansion
Argentina 12.4% Urban transit advertising
Rest of South America 11.9% Tourism and hospitality


Brazil's São Paulo and Rio de Janeiro are spearheading transparent display adoption through transit-advertising concessions and luxury mall installations. Argentina's Buenos Aires metro authority has piloted transparent panels on platform barriers, combining safety glass with passenger-information overlays [22].

Middle East & Africa

Country Share of Regional Revenue (2025) Key Driver
Saudi Arabia 30.2% NEOM and Vision 2030 mega-projects
UAE 28.6% Tourism, retail, and hospitality
South Africa 14.8% Banking and commercial real estate
Egypt 10.1% New Administrative Capital construction
Rest of MEA 16.3% Various


Saudi Arabia's NEOM project alone has specified transparent façade panels across multiple commercial districts, making it one of the single largest procurement programs for the Transparent Display Market globally. The UAE's duty-free retail complexes and five-star hospitality chains are early adopters, with Dubai Mall and Abu Dhabi International Airport deploying storefront panels since 2024 [23].


Transparent Display Market By Region, 2025-2035

Competitive Benchmarking

Market concentration in the Transparent Display Market is moderate, with the top five players controlling an estimated 48–54% of global revenue. The Herfindahl–Hirschman Index sits in the 800–1,200 range, indicating a competitive but not fragmented structure. Scale in OLED and Micro-LED fabrication creates meaningful barriers to entry, yet specialized integrators continue to carve out share in niche verticals.

Company Est. Revenue Share Range Key Offerings Strategic Positioning
Samsung Electronics ~10–14% OLED transparent panels, Micro-LED walls Vertically integrated fab-to-module leader
LG Display ~9–13% Transparent OLED signage, automotive panels Premium commercial and retail focus
BOE Technology ~7–10% LCD and OLED transparent modules Scale-driven cost leader, China-centric
Panasonic Corporation ~5–8% Transparent projection displays Broadcast and event technology heritage
Planar Systems (Leyard) ~4–7% LED transparent screens, video walls Large-format display specialist
Visionox ~3–6% Flexible OLED transparent panels Emerging challenger in wearable displays
NEXNOVO Technology ~3–5% Transparent LED glass screens Niche architectural and retail focus
Crystal Display Systems ~2–4% Transparent LCD showcases Specialty retail and museum installations
Lumineq (Beneq) ~2–3% Thin-film electroluminescent displays Defense and harsh-environment specialist
Pro Display ~1–3% Switchable transparent screens Custom AV integration


Recent News & Developments

  • Samsung Electronics (January 2025): Unveiled a 77-inch transparent Micro-LED prototype at CES 2025, claiming 4,500-nit peak brightness and 40% transparency ratio — a step-change from prior OLED-based models [9].


  • Apple Inc. (October 2023): Filed a patent portfolio covering waveguide-based transparent display architectures for future mixed-reality glasses and automotive windshield applications [16].


Transparent Display Market — Report Scope and Methodology

Parameter Detail
Market Scope Global Transparent Display Market — Technology, End-User Industry, Application, Display Size, Geography
Study Period 2021–2035
CAGR (Forecast Period) 14.6% (2026–2035)
Base Year Market Size USD 4.65 Billion (2025)
Forecast Year Market Size USD 18.00 Billion (2035)
Fastest Growing Technology Micro-LED
Fastest Growing End-User Automotive
Companies Profiled 10 (Samsung Electronics, LG Display, BOE Technology, Panasonic, Planar Systems, Visionox, NEXNOVO, Crystal Display Systems, Lumineq, Pro Display)
Valuation Currency USD Billion


FAQs

What is the projected market valuation of the Transparent Display Market by 2035?

The Transparent Display Market is projected to reach a valuation of 36.09 USD Billion by 2035.

What was the market valuation of the Transparent Display Market in 2024?

In 2024, the Transparent Display Market was valued at 1.044 USD Billion.

What is the expected CAGR for the Transparent Display Market during the forecast period 2025 - 2035?

The expected CAGR for the Transparent Display Market during the forecast period 2025 - 2035 is 38.0%.

Which companies are considered key players in the Transparent Display Market?

Key players in the Transparent Display Market include Samsung Electronics, LG Display, Sharp Corporation, Panasonic Corporation, Sony Corporation, AU Optronics, BOE Technology Group, Visionox Technology, and E Ink Holdings.

What are the main segments of the Transparent Display Market based on display size?
The main segments based on display size include Small & Medium displays valued at 0.418 USD Billion and Large displays valued at 0.626 USD Billion.
How does the Transparent Display Market perform in terms of technology segments?

In terms of technology segments, both LCD and OLED displays are valued at 0.418 USD Billion, while other technologies are valued at 0.208 USD Billion.

What is the market performance of different resolution segments in the Transparent Display Market?
The Ultra HD and Full HD resolution segments are each valued at 0.418 USD Billion, while the HD segment is valued at 0.208 USD Billion.
What product segments are included in the Transparent Display Market?
Product segments include Head-Mounted Displays valued at 0.15 USD Billion, Head-Up Displays at 0.25 USD Billion, Digital Signage at 0.35 USD Billion, and Smart Appliances at 0.1 USD Billion.
Which verticals are driving growth in the Transparent Display Market?
The verticals driving growth include Consumer at 0.25 USD Billion, Retail & Hospitality at 0.15 USD Billion, and Healthcare at 0.2 USD Billion.
What is the anticipated growth trend for the Transparent Display Market in the coming years?
The Transparent Display Market appears to be on a robust growth trajectory, with projections indicating substantial expansion through 2035.
Author
Author
Author Profile
Ankit Gupta LinkedIn
Team Lead - Research
Ankit Gupta is a seasoned market intelligence and strategic research professional with over six plus years of experience in the ICT and Semiconductor industries. With academic roots in Telecom, Marketing, and Electronics, he blends technical insight with business strategy. Ankit has led 200+ projects, including work for Fortune 500 clients like Microsoft and Rio Tinto, covering market sizing, tech forecasting, and go-to-market strategies. Known for bridging engineering and enterprise decision-making, his insights support growth, innovation, and investment planning across diverse technology markets.

Research Approach


Secondary Research

The secondary research process involved comprehensive analysis of industry databases, technical publications, patent repositories, and authoritative electronics and display technology organizations. Key sources included the US Department of Energy (DOE) Office of Energy Efficiency & Renewable Energy, National Institute of Standards and Technology (NIST), European Commission Directorate-General for Communications Networks, Content and Technology (CNECT), Japan Ministry of Economy, Trade and Industry (METI), Korea Display Industry Association (KDIA), Society for Information Display (SID.org), International Electrotechnical Commission (IEC), IEEE Xplore Digital Library, US Patent and Trademark Office (USPTO), European Patent Office (EPO), China National Intellectual Property Administration (CNIPA), United Nations Industrial Development Organization (UNIDO), OECD Digital Economy Outlook, International Data Corporation (IDC), Consumer Technology Association (CTA), and national electronics industry associations from key markets. These sources were used to collect display technology roadmaps, patent filing trends, energy efficiency standards, production capacity data, trade statistics, and competitive landscape analysis for LCD, OLED, and emerging transparent display technologies.


Primary Research

Qualitative and quantitative insights were obtained by interviewing supply-side and demand-side stakeholders during the primary research process. CEOs, VPs of Engineering, leaders of display R&D, and business development directors from transparent display panel manufacturers, OEMs, and component suppliers comprised the supply-side sources. Facility managers from healthcare institutions and smart building operators, procurement heads, product managers from automotive manufacturers, retail solution architects, aerospace systems integrators, and chief technology officers constituted demand-side sources. Technology adoption timelines were validated, product development pipelines were confirmed, and insights on manufacturing yield rates, pricing trajectories, and supply chain dynamics were gathered through primary research.

Primary Respondent Breakdown:

By Designation: C-level Primaries (28%), Director Level (35%), Others (37%)

By Region: North America (32%), Europe (30%), Asia-Pacific (34%), Rest of World (4%)


Market Size Estimation

Global market valuation was derived through revenue mapping and unit shipment analysis. The methodology included:

The identification of over 50 key manufacturers in North America, Europe, Asia-Pacific, and Latin America

Product mapping across LCD, OLED, and other emerging transparent display technologies by display size (small & medium, large) and resolution (Ultra HD, Full HD, HD)

Analysis of reported and modeled annual revenues specific to transparent display portfolios including head-mounted displays, head-up displays, digital signage, and smart appliances

Coverage of manufacturers representing 75-80% of global market share in 2024

Extrapolation using bottom-up (unit shipment × ASP by country/vertical) and top-down (manufacturer revenue validation) approaches to derive segment-specific valuations for retail & hospitality, automotive & transportation, aerospace & defense, healthcare, sports & entertainment, and consumer verticals

Download Free Sample

Kindly complete the form below to receive a free sample of this Report

Download PDF ×

We do not share your information with anyone. However, we may send you emails based on your report interest from time to time. You may contact us at any time to opt-out.
















