Download Free Sample
Kindly complete the form below to receive a free sample of this Report
Transportation Engineering Consulting Services Market Research Report By End Use (Government Agencies, Private Sector, Consulting Firms, Construction Companies, Research Institutions), By Application (Traffic Management, Infrastructure Development, Transportation Planning, Environmental Impact Assessment, Safety Analysis), By Service Type (Feasibility Studies, Design Services, Project Management, Regulatory Compliance, Technical Advisory) And By Region (North America, Europe, Asia-Pacific, And Rest Of The World) – Market Forecast Till 2035.
As per MRFR analysis, the Transportation Engineering Consulting Services Market was estimated at 45.0 USD Billion in 2024. The market is projected to grow from 46.53 USD Billion in 2025 to 65.0 USD Billion by 2035, exhibiting a compound annual growth rate (CAGR) of 3.4% during the forecast period 2025 - 2035.
The Transportation Engineering Consulting Services Market is experiencing a transformative shift towards smart technologies and sustainability.
| 2024 Market Size | 45.0 (USD Billion) |
| 2035 Market Size | 65.0 (USD Billion) |
| CAGR (2025 - 2035) | 3.4% |
AECOM (US), WSP Global (CA), Jacobs Engineering (US), Stantec (CA), HDR (US), Kiewit Corporation (US), Gannett Fleming (US), Tetra Tech (US), Ramboll (DK)
Our Impact
Enabled $4.3B Revenue Impact for Fortune 500 and Leading Multinationals
Partnering with 2000+ Global Organizations Each Year
30K+ Citations by Top-Tier Firms in the Industry
The Transportation Engineering Consulting Services Market is currently experiencing a dynamic evolution, driven by the increasing complexity of transportation systems and the growing demand for sustainable infrastructure solutions. As urbanization accelerates, cities are facing unprecedented challenges related to traffic congestion, environmental impact, and the need for efficient public transit systems. Consulting firms are adapting by offering innovative strategies that integrate advanced technologies, such as smart traffic management systems and data analytics, to enhance operational efficiency and improve user experience. This shift towards technology-driven solutions appears to be reshaping the landscape of transportation engineering consulting, as stakeholders seek to optimize resources and reduce costs while meeting regulatory requirements. Moreover, the emphasis on sustainability is becoming a pivotal factor in shaping the Transportation Engineering Consulting Services Market. Governments and private entities are increasingly prioritizing eco-friendly practices, which necessitates a reevaluation of traditional engineering approaches. This trend suggests that consulting firms must not only provide technical expertise but also demonstrate a commitment to environmental stewardship. As a result, collaboration among various stakeholders, including government agencies, private sector players, and community organizations, is likely to intensify, fostering a more integrated approach to transportation planning and development. The future of this market seems poised for growth, with an emphasis on innovation and sustainability driving its trajectory.
The incorporation of smart technologies into transportation systems is becoming a defining trend within the Transportation Engineering Consulting Services Market. This integration facilitates real-time data collection and analysis, enabling more efficient traffic management and improved safety measures. Consulting firms are increasingly leveraging these technologies to provide clients with innovative solutions that enhance operational efficiency.
Sustainability is emerging as a critical focus in the Transportation Engineering Consulting Services Market. As environmental concerns gain prominence, consulting firms are adapting their strategies to prioritize eco-friendly practices. This shift not only aligns with regulatory requirements but also meets the growing demand from clients for sustainable infrastructure solutions.
The trend towards collaborative stakeholder engagement is reshaping the Transportation Engineering Consulting Services Market. Consulting firms are recognizing the importance of involving various stakeholders, including government agencies and community organizations, in the planning and development process. This collaborative approach fosters a more comprehensive understanding of community needs and enhances project outcomes.
The Transportation Engineering Consulting Services Market is significantly influenced by ongoing urbanization and population growth trends. As urban areas expand, the demand for efficient transportation systems becomes paramount. Cities are grappling with increased traffic congestion, necessitating innovative solutions to enhance mobility. Consulting firms play a crucial role in addressing these challenges by providing strategic planning and design services tailored to urban environments. Recent projections suggest that by 2050, nearly 70 percent of the world's population will reside in urban areas, further intensifying the need for robust transportation infrastructure. This demographic shift creates a fertile ground for the Transportation Engineering Consulting Services Market to thrive, as stakeholders seek expert guidance to develop sustainable and effective transportation solutions that cater to growing urban populations.
The Transportation Engineering Consulting Services Market is experiencing a surge in demand due to heightened investments in infrastructure development. Governments and private entities are allocating substantial budgets to enhance transportation networks, including roads, bridges, and rail systems. For instance, recent reports indicate that infrastructure spending is projected to reach trillions of dollars over the next decade, driven by urbanization and population growth. This influx of capital creates opportunities for consulting firms to provide expertise in planning, design, and project management. As cities expand and transportation needs evolve, the role of engineering consultants becomes increasingly vital in ensuring that projects are completed efficiently and sustainably. Consequently, the Transportation Engineering Consulting Services Market is poised for growth as stakeholders seek specialized knowledge to navigate complex infrastructure challenges.
The Transportation Engineering Consulting Services Market is significantly influenced by the need for compliance with stringent regulatory frameworks and safety standards. Governments worldwide are implementing rigorous regulations to ensure the safety and reliability of transportation systems. This trend necessitates the involvement of consulting firms that possess the expertise to navigate these complex regulations. For example, the Federal Highway Administration has established guidelines that require thorough assessments and adherence to safety protocols in transportation projects. As a result, engineering consultants are increasingly sought after to conduct safety audits, risk assessments, and compliance evaluations. This growing emphasis on safety and regulatory adherence not only enhances public trust in transportation systems but also drives demand for specialized consulting services within the Transportation Engineering Consulting Services Market.
The Transportation Engineering Consulting Services Market is being reshaped by rapid technological advancements that enhance transportation efficiency and safety. Innovations such as intelligent transportation systems, autonomous vehicles, and data analytics are transforming how transportation projects are designed and executed. For instance, the integration of smart traffic management systems has been shown to reduce congestion and improve travel times. Consulting firms are increasingly leveraging these technologies to provide data-driven solutions that optimize transportation infrastructure. The market for smart transportation solutions is expected to grow significantly, with estimates suggesting a compound annual growth rate of over 20 percent in the coming years. This technological evolution presents a substantial opportunity for the Transportation Engineering Consulting Services Market to expand its offerings and improve project outcomes.
The Transportation Engineering Consulting Services Market is increasingly driven by the imperative for sustainability and environmental stewardship. As concerns about climate change and environmental degradation intensify, there is a growing demand for transportation projects that minimize ecological impact. Consulting firms are now tasked with integrating sustainable practices into their designs, such as using eco-friendly materials and promoting public transit solutions. Recent studies indicate that projects incorporating sustainable design principles can lead to cost savings and improved community acceptance. Furthermore, regulatory bodies are incentivizing green initiatives, which further propels the need for expertise in sustainable transportation solutions. This shift towards sustainability not only aligns with The Transportation Engineering Consulting Services Industry as a leader in promoting responsible development.
In the Transportation Engineering Consulting Services Market, Traffic Management holds the largest share due to increasing urbanization and the consequent rise in traffic congestion. This segment encompasses strategies and technologies aimed at optimizing traffic flow, reducing delays, and improving overall mobility. Infrastructure Development follows closely, focusing on the enhancement and expansion of transportation systems to accommodate growing populations and commerce. Other crucial segments include Transportation Planning, Environmental Impact Assessment, and Safety Analysis, each contributing to the cohesive development of effective transportation solutions.
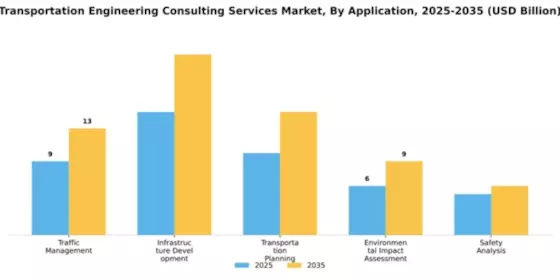
Traffic Management (Dominant) vs. Safety Analysis (Emerging)
Traffic Management is positioned as the dominant application within the Transportation Engineering Consulting Services Market, characterized by a focus on improving traffic circulation and addressing congestion issues through innovative solutions. Strategies such as real-time traffic monitoring, smart signaling systems, and predictive modeling play pivotal roles in enhancing road network performance. On the other hand, Safety Analysis is emerging rapidly as a critical area of focus, driven by increasing demands for accident reduction and improved public safety measures. This segment emphasizes risk assessment, mitigation strategies, and compliance with safety regulations, facilitating safer transportation environments. Both segments are essential for fostering sustainable urban mobility and addressing the complexities of modern transportation challenges.
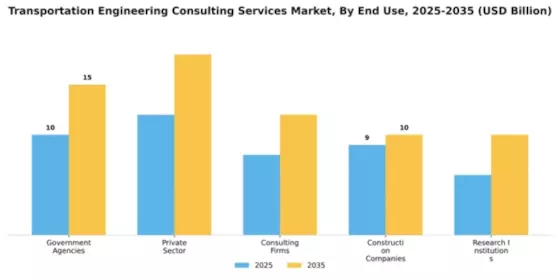
In the Transportation Engineering Consulting Services Market, the market share distribution reveals that Government Agencies hold the largest segment share due to their extensive involvement in infrastructure projects and regulatory frameworks. This segment is characterized by stable demand, as government initiatives and funding play crucial roles in transportation development, leading to significant contributions to overall market performance. The Private Sector, while smaller, showcases rapid growth as investments in infrastructure and urban development increase. This is fueled by private investments and public-private partnerships that stimulate innovation and efficiency in transportation engineering services.
Government Agencies: Dominant vs. Private Sector: Emerging
Government Agencies are the dominant players in the Transportation Engineering Consulting Services Market, primarily due to their responsibility for large-scale infrastructure projects and ensuring compliance with safety and environmental standards. Their requirements often lead to significant contracts for consulting services. On the other hand, the Private Sector is emerging as a vital component of the market, driven by its agility to adapt to market demands and integrate cutting-edge technologies, which fosters increased competition and service diversification. This segment is gaining momentum as private firms seek to capitalize on modernization initiatives and urban expansion, making them essential players in future transportation projects.
In the Transportation Engineering Consulting Services Market, the dominant service type is Project Management, which captures a significant portion of market share due to the increasing complexity of transportation projects. This segment's strength lies in its ability to integrate various facets of project execution, ensuring efficiency and compliance with industry standards. Following closely is Design Services, recognized for its rapid growth, driven by technological advancements and the need for innovative solutions in transportation design, including sustainable practices and smart infrastructure.
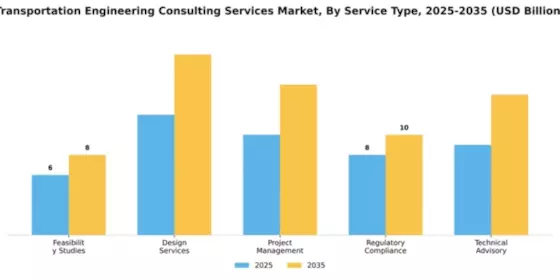
Project Management: Dominant vs. Design Services: Emerging
Project Management in the Transportation Engineering Consulting Services Market stands as the most prominent segment, essential for ensuring that projects are completed on time, within scope, and utilizing optimal resources. This service type focuses on coordinating multiple activities ranging from budgeting to scheduling, thus mitigating risks and enhancing operational efficiency. On the other hand, Design Services is an emerging segment that has experienced exponential growth due to technological innovations, such as CAD and BIM technologies, which facilitate smarter and more efficient designs. This segment caters to the evolving needs of infrastructure projects, emphasizing sustainability and resilience in engineering design.
Get more detailed insights about Transportation Engineering Consulting Services Market Request Free Sample
North America holds a commanding position in the Transportation Engineering Consulting Services market, with a market size of $22.5 billion in 2025. The region's growth is driven by increasing infrastructure investments, urbanization, and a focus on sustainable transportation solutions. Regulatory support for green initiatives and smart city projects further catalyzes demand, positioning North America as a leader in innovative transportation solutions. The competitive landscape is robust, featuring key players such as AECOM, Jacobs Engineering, and HDR, which dominate the market. The U.S. and Canada are the leading countries, benefiting from advanced technology adoption and a skilled workforce. The presence of major firms ensures a high level of service quality and innovation, making North America a hub for transportation engineering consulting services.
Europe's Transportation Engineering Consulting Services market is valued at $12.0 billion in 2025, driven by stringent environmental regulations and a commitment to sustainable transport solutions. The European Union's Green Deal and various national policies promote investments in public transport and infrastructure upgrades, fostering a favorable environment for consulting services. The demand for innovative solutions to reduce carbon emissions is a significant growth driver in the region. Leading countries include Germany, France, and the UK, where major players like Ramboll and WSP Global are actively involved. The competitive landscape is characterized by a mix of established firms and emerging local players, enhancing service diversity. The focus on digitalization and smart transport systems positions Europe as a key player in the global market for transportation engineering consulting services.
The Asia-Pacific region is witnessing significant growth in the Transportation Engineering Consulting Services market, projected at $8.0 billion in 2025. Rapid urbanization, population growth, and government initiatives to enhance infrastructure are key drivers of this expansion. Countries like China and India are investing heavily in transportation networks, including roads, railways, and airports, creating substantial demand for consulting services. Regulatory frameworks are increasingly supportive of public-private partnerships, further stimulating market growth. China and India lead the market, with major firms like Stantec and Tetra Tech establishing a strong presence. The competitive landscape is evolving, with both international and local players vying for market share. The focus on smart city initiatives and sustainable transport solutions is expected to drive innovation and growth in the region, making it a vital area for transportation engineering consulting services.
The Middle East and Africa region, with a market size of $2.5 billion in 2025, is emerging as a significant player in the Transportation Engineering Consulting Services market. The growth is fueled by substantial investments in infrastructure projects, particularly in the Gulf Cooperation Council (GCC) countries. Government initiatives aimed at diversifying economies and enhancing transportation networks are key drivers of demand for consulting services. Regulatory support for large-scale projects is also a catalyst for growth in this region. Leading countries include the UAE and South Africa, where firms are increasingly focusing on sustainable and innovative transportation solutions. The competitive landscape features both local and international players, with a growing emphasis on collaboration to meet the rising demand for efficient transportation systems. The region's potential for growth is significant, driven by ongoing infrastructure development and investment.
The Transportation Engineering Consulting Services Market is characterized by a dynamic competitive landscape, driven by increasing infrastructure investments and a growing emphasis on sustainable transportation solutions. Major players such as AECOM (US), WSP Global (CA), and Jacobs Engineering (US) are strategically positioned to leverage their extensive expertise in engineering and project management. AECOM (US) focuses on integrating advanced technologies into its service offerings, while WSP Global (CA) emphasizes sustainability and resilience in its projects. Jacobs Engineering (US) is known for its commitment to innovation and digital transformation, which collectively shapes a competitive environment that prioritizes efficiency and adaptability.The market structure appears moderately fragmented, with a mix of large multinational firms and smaller regional players. Key business tactics include localizing services to meet specific regional needs and optimizing supply chains to enhance project delivery timelines. The collective influence of these major players fosters a competitive atmosphere where collaboration and strategic partnerships are increasingly vital for success.In November AECOM (US) announced a partnership with a leading technology firm to develop a smart transportation platform aimed at enhancing urban mobility. This strategic move is likely to position AECOM (US) at the forefront of the digital transformation trend within the industry, enabling it to offer innovative solutions that address the complexities of modern transportation systems.In October WSP Global (CA) secured a major contract for the design and implementation of a sustainable transit system in a metropolitan area. This initiative underscores WSP's commitment to sustainability and its ability to deliver environmentally friendly solutions, which are increasingly demanded by clients and regulatory bodies alike. Such projects not only enhance WSP's portfolio but also reinforce its reputation as a leader in sustainable engineering practices.In September Jacobs Engineering (US) launched a new initiative focused on integrating artificial intelligence (AI) into its project management processes. This strategic action is indicative of Jacobs' forward-thinking approach, as AI has the potential to significantly improve efficiency and decision-making in transportation projects. By embracing such technologies, Jacobs is likely to enhance its competitive edge in a rapidly evolving market.As of December current competitive trends are heavily influenced by digitalization, sustainability, and the integration of AI technologies. Strategic alliances are shaping the landscape, allowing companies to pool resources and expertise to tackle complex challenges. The shift from price-based competition to a focus on innovation, technology, and supply chain reliability is evident, suggesting that future differentiation will hinge on the ability to deliver cutting-edge solutions that meet the evolving demands of clients and communities.




The Transportation Engineering Consulting Services Market is projected to grow at a 3.4% CAGR from 2025 to 2035, driven by urbanization, infrastructure investments, and technological advancements.
New opportunities lie in:
By 2035, the market is expected to be robust, reflecting ongoing demand and innovation.
| MARKET SIZE 2024 | 45.0(USD Billion) |
| MARKET SIZE 2025 | 46.53(USD Billion) |
| MARKET SIZE 2035 | 65.0(USD Billion) |
| COMPOUND ANNUAL GROWTH RATE (CAGR) | 3.4% (2025 - 2035) |
| REPORT COVERAGE | Revenue Forecast, Competitive Landscape, Growth Factors, and Trends |
| BASE YEAR | 2024 |
| Market Forecast Period | 2025 - 2035 |
| Historical Data | 2019 - 2024 |
| Market Forecast Units | USD Billion |
| Key Companies Profiled | AECOM (US), WSP Global (CA), Jacobs Engineering (US), Stantec (CA), HDR (US), Kiewit Corporation (US), Gannett Fleming (US), Tetra Tech (US), Ramboll (DK) |
| Segments Covered | Application, End Use, Service Type |
| Key Market Opportunities | Integration of smart transportation systems enhances efficiency and sustainability in the Transportation Engineering Consulting Services Market. |
| Key Market Dynamics | Rising demand for sustainable infrastructure drives innovation and competition in transportation engineering consulting services. |
| Countries Covered | North America, Europe, APAC, South America, MEA |
The projected market valuation for the Transportation Engineering Consulting Services Market in 2035 is 65.0 USD Billion.
The overall market valuation for the Transportation Engineering Consulting Services Market in 2024 was 45.0 USD Billion.
The expected CAGR for the Transportation Engineering Consulting Services Market during the forecast period 2025 - 2035 is 3.4%.
Key players in the Transportation Engineering Consulting Services Market include AECOM, WSP Global, Jacobs Engineering, Stantec, HDR, Kiewit Corporation, Gannett Fleming, Tetra Tech, and Ramboll.
The main application segments include Traffic Management, Infrastructure Development, Transportation Planning, Environmental Impact Assessment, and Safety Analysis.
The valuation for the Infrastructure Development segment in 2024 was 15.0 USD Billion.
The Transportation Planning segment is projected to be valued at 15.0 USD Billion by 2035.
The end-use segments include Government Agencies, Private Sector, Consulting Firms, Construction Companies, and Research Institutions.
The valuation for the Design Services segment in 2024 was 12.0 USD Billion.
By 2035, the Design Services segment is expected to have the highest valuation, projected at 18.0 USD Billion.


Kindly complete the form below to receive a free sample of this Report

“This is really good guys. Excellent work on a tight deadline. I will continue to use you going forward and recommend you to others. Nice job”


“Thanks. It’s been a pleasure working with you, please use me as reference with any other Intel employees.”


“Thanks for sending the report it gives us a good global view of the Betaïne market.”


“Thank you, this will be very helpful for OQS.”


“We found the report very insightful! we found your research firm very helpful. I'm sending this email to secure our future business.”


“I am very pleased with how market segments have been defined in a relevant way for my purposes (such as "Portable Freezers & refrigerators" and "last-mile"). In general the report is well structured. Thanks very much for your efforts.”


“I have been reading the first document or the study, ,the Global HVAC and FP market report 2021 till 2026. Must say, good info! I have not gone in depth at all parts, but got a good indication of the data inside!”


“We got the report in time, we really thank you for your support in this process. I also thank to all of your team as they did a great job.”


“The Automotive 48V ECU Components Procurement Intelligence Study” was a complex project, but the Market Research Future (MRFR) team handled it with quality, agility, and customer-centricity. They delivered all requested data on time and within the agreed scope. The team, including Shubhendra Anand and Rahul Gotadki, was always readily available to clarify questions and swiftly implement necessary adjustments, driving the project to a successful conclusion within a very demanding timeframe.
I would also like to specifically commend Akshay Agarwal for his responsiveness and support at every stage—from our initial inquiry on May 6th through to final delivery on June 18th. His dedication made the entire process seamless.”



