Transportation Infrastructure Market (2026 - 2035)

Transportation Infrastructure Market Research Report Information By Type (Roadways, Railways, Airways, Ports and Inland Waterways), By Construction Type (New Construction and Renovation), By Investment Source (Public and Private) – Forecast Till 2035
ID: MRFR/PCM/26857-HCR
100 Pages
Tejas Chaudhary
Last Updated: July 14, 2026
Transportation Infrastructure Market
Market Size
Forecast Period2026-2035
CAGR (2026-2035)6.96%
2025 Market SizeUSD 84.70 Billion
2035 Market SizeUSD 166.00 Billion
Key Players
VINCI SA
ACS Group
China Communications Construction Co.
Larsen & Toubro
Bechtel Corporation
Bouygues Construction
Opportunities
  • Asset-Recycling and Toll-Operate-Transfer Models
  • Smart Corridor and Connected-Vehicle Infrastructure
  • Climate-Resilient Infrastructure in Emerging Markets

Transportation Infrastructure Market Summary

The global transportation infrastructure market was valued at USD 84.70 billion in 2025 and is projected to reach USD 90.59 billion in 2026 before climbing to USD 166.00 billion by 2035, expanding at a CAGR of 6.96% during the forecast period (2026–2035). Record-breaking government commitments underpin this trajectory — the United States alone has earmarked over USD 550 billion under the Infrastructure Investment and Jobs Act. At the same time, India's National Infrastructure Pipeline targets USD 1.4 trillion in capital outlay through 2030 [1]. Highway bidding under hybrid annuity models, dedicated freight corridor completions, and sustained terminal upgrades across major airports are converting policy pledges into contract awards at an accelerating pace.

The transportation infrastructure market's project delivery process is changing due to a technological revolution. In order to reduce design errors by an estimated 15–20% and shorten timeframes by several months, governments are requiring Building Information Modeling (BIM) on projects worth more than $12 million [2]. Manual survey methods are being replaced by digital twins, drone-based surveying, and AI-enabled traffic simulation; contractors that do not use these tools run the danger of being excluded from public contracts. A significant indication that digital preparedness will become a requirement for procurement is the European Commission's updated TEN-T legislation, which mandates digital construction requirements on all core network corridors by 2030 [3].

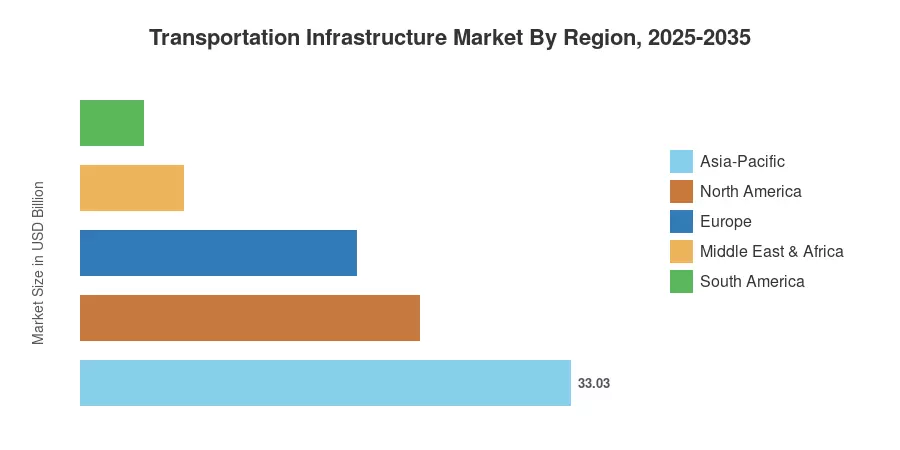
With a 39% share of worldwide transportation infrastructure spending, Asia-Pacific leads the market due to India's Bharatmala and Sagarmala efforts and China's highway and high-speed train construction schemes. With an 8.21% CAGR, the Middle East and Africa is the fastest-growing region thanks to Egypt's new administrative capital projects and Saudi Arabia's NEOM. The U.S. federal infrastructure bill and Canada's national trade corridor fund serve as the foundation for North America's second-largest share, which is 27%. The ability of economies to turn committed capital into finished assets on time will determine the course of the next ten years.


Key Report Takeaways

• By Type

  • Roadways commanded a 55.8% share of the transportation infrastructure market in 2025, reflecting sustained highway expansion across Asia and North America.
  • Ports and inland waterways are forecast to register the highest growth at an 8.68% CAGR through 2035, as global trade rebalancing drives new terminal construction.
  • Railways attracted USD 17.84 billion in global spending during 2025, with high-speed rail programs in China, India, and the EU accounting for the bulk of outlays.

• By Construction Type

  • New construction represented 82.2% of the transportation infrastructure market in 2025, as greenfield corridors outpaced rehabilitation budgets.
  • Renovation and rehabilitation projects are expected to grow at an 8.57% CAGR, driven by aging bridge and tunnel portfolios in Europe and North America.

• By Region

  • Asia-Pacific held a 39% share of the transportation infrastructure market during 2025, led by China and India.
  • The Middle East & Africa region is forecast to achieve the fastest CAGR of 8.21% through 2035.


Market Size and Forecast (2021–2035)

The data presented below draws on national statistical agencies, multilateral development bank disclosures, and proprietary modeling by Market Research Future. Historical values (2021–2024) reflect realized contract awards and completion-stage spending, while the forecast period (2026–2035) uses a weighted composite of GDP elasticity, announced pipeline values, and budget appropriation trajectories.
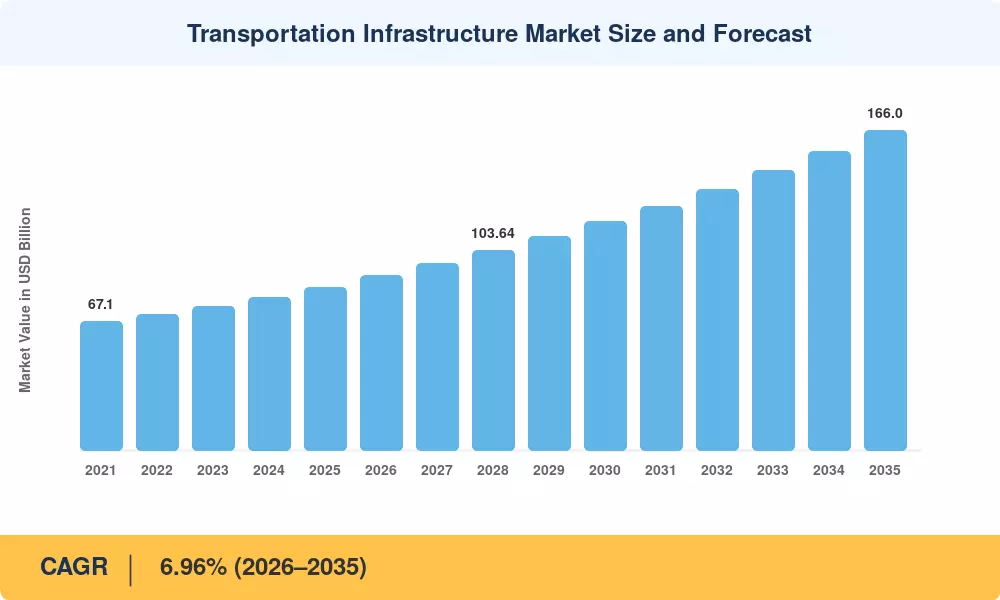
Transportation Infrastructure Market Size and Forecast
Our Impact
Enabled $4.3B Revenue Impact for Fortune 500 and Leading Multinationals
Partnering with 2000+ Global Organizations Each Year
30K+ Citations by Top-Tier Firms in the Industry

Driver Impact Analysis

Driver ~% Impact on CAGR Geographic Relevance Impact Timeline
Government stimulus and multi-year infrastructure bills +1.8% Global Short-term (≤2 yr)
Urbanization-driven transit corridor demand +1.3% Asia-Pacific, Africa Long-term (≥4 yr)
Trade-route diversification and port expansion +0.9% MEA, South America Medium-term (2–4 yr)
Digital construction mandates (BIM, digital twins) +0.7% Europe, North America Medium-term (2–4 yr)
PPP and asset-recycling capital models +0.6% Asia-Pacific, Europe Medium-term (2–4 yr)
High-speed and dedicated freight rail programs +1.0% Asia-Pacific, Europe Long-term (≥4 yr)
Climate-resilience retrofitting requirements +0.5% North America, Europe Long-term (≥4 yr)


Government Stimulus and Multi-Year Infrastructure Bills

The single most powerful accelerant for the transportation infrastructure market is the wave of legislated spending programs that lock in multi-year budget certainty. The U.S. IIJA alone authorizes USD 550 billion in new federal spending over five years, with roughly 60% directed at surface transportation [1]. India's Union Budget for FY 2025–26 allocated INR 11.11 trillion (approximately USD 133 billion) to capital expenditure, a significant portion flowing into highways and railways [5]. China's 15th Five-Year Plan is expected to sustain annual expressway investment above USD 85 billion through 2030 [13]. These committed appropriations reduce contractor risk premiums and encourage private co-investment.

Urbanization-Driven Transit Corridor Demand

By 2050, the global urban population is projected to reach approximately two-thirds of the total population, according to UN-Habitat data. Rapid urbanization in emerging economies necessitates extensive investment in metro rail and bus rapid transit to mitigate congestion, which frequently imposes economic costs reaching several percentage points of national GDP in major metropolitan centers annually.

Trade-Route Diversification and Port Expansion

Geopolitical shifts are accelerating the development of alternative trade corridors, such as the African Continental Free Trade Area (AfCFTA). Strengthening these routes requires intentional investment in connected transport corridors and intermodal hubs to enhance efficiency. Targeted infrastructure upgrades are critical for optimizing cross-border trade, as physical connectivity remains a primary determinant for moving goods across expanding markets.


High-Speed and Dedicated Freight Rail Programs

Rail infrastructure serves as a capital-intensive growth pillar. India’s Dedicated Freight Corridor project, spanning thousands of kilometers, aims to separate freight from passenger traffic to improve operational efficiency and competitiveness. Simultaneously, the European Union’s revised TEN-T regulation mandates the completion of a core network by 2030, with estimated investment requirements exceeding 515 billion euros for its realization.


Restraints Impact Analysis

Restraint ~% Impact on CAGR Geographic Relevance Impact Timeline
Land acquisition delays and right-of-way disputes –0.6% Asia-Pacific, South America Long-term (≥4 yr)
Raw material cost volatility (steel, cement, bitumen) –0.5% Global Short-term (≤2 yr)
Skilled labor shortages in civil engineering –0.4% Europe, North America Medium-term (2–4 yr)
Fiscal tightening and sovereign debt constraints –0.4% South America, Africa Medium-term (2–4 yr)
Environmental and permitting complexity –0.3% Europe, North America Long-term (≥4 yr)


Land Acquisition Delays

Securing right-of-way remains a primary risk for linear infrastructure projects. As of mid-2025, the Ministry of Road Transport and Highways identified approximately 489 national highway projects facing completion delays, significantly attributed to land acquisition hurdles and necessary statutory clearances. These bottlenecks frequently necessitate time extensions and project restructurings, directly impacting the efficient delivery of critical transportation networks nationwide


Raw Material Cost Volatility

Steel and cement are foundational materials, accounting for a substantial share of total construction costs. To mitigate financial risks from global price fluctuations, the Ministry of Road Transport and Highways implemented updated price adjustment mechanisms effective April 2026. These protocols enable monthly compensation for material cost variations in EPC and HAM contracts, ensuring project continuity despite ongoing commodity price instability.

Skilled Labor Shortages

The global engineering and construction sector faces a structural workforce imbalance, exacerbated by an aging population and high retirement rates. Recent industry reports indicate that nearly 73% of employers worldwide struggle to recruit skilled engineering talent. As senior professionals exit the workforce in economies like Germany and Japan, the sector must prioritize strategic talent development and retention to maintain infrastructure delivery.


Transportation Infrastructure Market Opportunities

Asset-Recycling and Toll-Operate-Transfer Models

Governments are increasingly monetizing operational assets to fund new construction. In India, the National Highways Authority has successfully raised over ₹48,995 crore through Toll-Operate-Transfer bundles to unlock capital for infrastructure development. This model enables the transition of maintenance responsibilities to private concessionaires, efficiently leveraging existing public assets to finance greenfield projects without further increasing sovereign debt burdens.


Smart Corridor and Connected-Vehicle Infrastructure

The integration of intelligent transport systems and vehicle-to-everything communication marks a significant shift in infrastructure investment. U.S. federal programs recently announced over $1.7 billion in funding for diverse infrastructure projects, prioritizing modern connectivity. Simultaneously, the European C-Roads platform continues to unite over 20 nations, fostering a harmonized ecosystem for essential secure data exchange between vehicles and road infrastructure.


Climate-Resilient Infrastructure in Emerging Markets

The World Bank Group actively prioritizes climate adaptation, with recent commitments directing approximately 30 percent of its Transport Global Practice financing toward resilience. Future projects necessitate the integration of climate-resistant designs—such as flood-hardened road embankments and heat-resilient pavement standards—to ensure the long-term viability of transport networks against intensifying climate hazards in low- and middle-income regions.

Modular and Prefabricated Construction Techniques

Prefabrication offers a transformative method for enhancing construction efficiency. By shifting complex assembly tasks to controlled factory environments, projects can achieve up to 50% faster completion timelines and an 80% reduction in on-site labor requirements. These methods also significantly improve sustainability, with documented evidence showing a reduction in greenhouse gas emissions by approximately 17–30% compared to conventional on-site construction practices.


Data Monetization Through Digital Twins

Infrastructure operators are leveraging digital twins to extend commercial value beyond construction delivery. Integrating real-time sensor data and predictive analytics into virtual models improves maintenance efficiency by over 40% and reduces total maintenance costs by approximately 25–30%. These intelligent systems allow operators to anticipate failures and optimize resource allocation, creating new recurring revenue streams through advanced data-driven infrastructure management.


Transportation Infrastructure Market Future Outlook

Autonomous and AI-Enabled Construction Operations

Machine-learning algorithms are increasingly optimizing real-time construction management. Autonomous earthmoving and sensor-equipped machinery are currently being piloted across various highway projects globally. Industry analysis indicates that the integration of automated construction equipment can improve labor productivity by approximately 30% through streamlined processes. These technologies are fundamentally altering cost structures and project execution timelines within the transportation infrastructure market.


Electrification of Transport Corridors

Electrified rail systems and electric highway infrastructure are establishing a new capital layer for civil works. India is nearing the completion of its broad-gauge railway electrification, with over 99.6% of the network electrified by mid-2026. This transition significantly reduces fuel costs and improves freight efficiency, forming a critical component of global strategies to achieve net-zero carbon transport targets.


ESG Reporting and Green Bond Financing

Sustainability-linked financing is reshaping infrastructure funding. Global issuance of sustainable bonds exceeded $1 trillion in 2024, reflecting a 20% year-on-year increase driven by government and corporate climate commitments. Institutional capital is increasingly channeled toward low-carbon transport corridors and multimodal hubs, as standardized green bond frameworks ensure transparent allocation of proceeds toward projects with verifiable environmental and social impacts.


Platform Economics and Integrated Concession Models

The operational landscape is evolving, with integrated Design-Build-Finance-Operate-Maintain (DBFOM) concessions becoming standard for large-scale projects. These models prioritize long-term lifecycle cost optimization and data-driven maintenance. By embedding technology and digital asset management, contractors are transitioning from traditional project builders to long-term platform operators, ensuring higher efficiency and sustained performance across the entire lifecycle of critical transportation infrastructure.


Transportation Infrastructure Market Segmentation

By Type

Segment Key Metric Primary Demand Driver
Roadways 55.8% share (2025) National highway programs and urban expressway construction
Railways USD 17.84 Billion (2025) High-speed rail and freight corridor investment
Airways 6.42% CAGR (2026–2035) Terminal expansion and greenfield airport construction
Ports and Inland Waterways 8.68% CAGR (2026–2035) Trade-route diversification and container terminal upgrades


Roadways remain the largest segment in the transportation infrastructure market, anchored by expressway expansion in China, India's Bharatmala program, and the U.S. IIJA's surface-transportation allocations. Highway contracts are evolving from simple asphalt-and-concrete jobs into technology-integrated corridors with embedded sensors, V2X communication infrastructure, and smart toll-gantry systems that raise per-kilometer investment values.

Ports and inland waterways represent the fastest-growing type segment, driven by the rebalancing of global supply chains and the construction of transshipment hubs in the Middle East and South Asia. India's Sagarmala program — targeting 574 port-linked projects — and Egypt's expansion of the Suez Canal Economic Zone are prominent examples of how maritime logistics is generating large-scale civil engineering demand in the transportation infrastructure market.

By Construction Type

Segment Key Metric Primary Demand Driver
New Construction 82.2% share (2025) Greenfield highway, rail, and airport programs
Renovation 8.57% CAGR (2026–2035) Aging bridges and tunnels in Europe and North America


New construction dominates the transportation infrastructure market because developing economies in Asia, the Middle East, and Africa are still building foundational networks rather than maintaining legacy systems. Greenfield expressway corridors, new airport terminals, and dedicated rail lines account for the majority of contract awards globally.

Renovation is the fastest-growing sub-segment, however, reflecting the structural reality that Europe and North America face trillion-dollar maintenance backlogs. The American Society of Civil Engineers has rated U.S. infrastructure at a C-minus, with over 46,000 bridges classified as structurally deficient [15]. This maintenance imperative is channeling growing budgets toward rehabilitation and retrofit contracts.

By Investment Source

Segment Key Metric Primary Demand Driver
Public 84.6% share (2025) Government budget allocations, multilateral lending
Private 8.47% CAGR (2026–2035) PPP concessions, toll-operate-transfer deals, airport privatization


Public spending accounts for the dominant share of the transportation infrastructure market, as sovereign governments bear primary responsibility for road, rail, and port networks. Multilateral development banks — including the World Bank, ADB, and AfDB — supplement national budgets with concessional lending that totaled over USD 22 billion for transport projects in 2024 [8].

Private investment is growing faster as governments experiment with capital-recycling models. India's toll-operate-transfer program, Australia's asset-recycling initiative, and the proliferation of airport concession deals across Latin America are steadily increasing private-sector participation in the transportation infrastructure market. Institutional investors, including sovereign wealth funds and infrastructure-focused PE funds, view long-duration transport assets as attractive inflation hedges.


Regional Market Share Analysis

Region Key Metric Primary Investment Themes
North America 27% share (2025) Federal stimulus, bridge rehabilitation and airport modernization
Europe 22% share (2025) TEN-T corridors, rail electrification, green mobility
Asia-Pacific USD 33.03 Billion (2025) Highway expansion, high-speed rail, port development
South America 5% share (2025) Concession-based toll roads, logistics corridors
Middle East & Africa 8.21% CAGR (2026–2035) Giga-projects, trade-corridor construction, and new cities
Total USD 84.70 Billion (2025)

The transportation infrastructure market exhibits significant regional variation in spending intensity, funding models, and project maturity. Asia-Pacific leads on absolute volume, while the Middle East & Africa is accelerating fastest from a smaller base.


North America

Country Key Metric Key Driver
United States 78% of regional share IIJA federal disbursements [1]
Canada USD 3.89 Billion (2025) National Trade Corridors Fund [18]
Mexico 7.4% CAGR (2026–2035) Tren Maya and Interoceanic Corridor [19]


The United States anchors North American spending, with the IIJA directing approximately USD 110 billion toward roads and bridges and USD 66 billion toward passenger rail over five years [1]. Canada's National Trade Corridors Fund is channeling CAD 4.6 billion toward port and intermodal access projects, while Mexico's Tren Maya railway and the Interoceanic Corridor of the Isthmus of Tehuantepec are drawing combined investment exceeding USD 18 billion, positioning the country as the region's fastest-growing contributor to the transportation infrastructure market.

Europe

Country Key Metric Key Driver
Germany 24% of regional share Autobahn modernization, Deutsche Bahn expansion [3]
United Kingdom USD 3.35 Billion (2025) Road Investment Strategy 3, HS2 Phase 1 [20]
France 6.8% CAGR (2026–2035) Grand Paris Express metro [21]
Italy USD 2.41 Billion (2025) PNRR-funded southern motorway upgrades [22]
Spain 14% of regional share Mediterranean rail corridor [3]
Nordic Countries 6.5% CAGR (2026–2035) Cross-border Scandinavian rail links
Russia USD 1.49 Billion (2025) Eastern corridor and Arctic port access
Rest of Europe 12% of regional share CEF-funded road and rail co-financing


European spending within the transportation infrastructure market is shaped by the EU's revised TEN-T regulation, which requires nine core network corridors to meet interoperability and capacity standards by 2030 [3]. Germany's Federal Transport Infrastructure Plan 2030 allocates EUR 270 billion, with over 40% directed at rail, while France's Grand Paris Express — a EUR 36 billion automated metro — represents the continent's single largest urban transit project [21].

Asia-Pacific

Country Key Metric Key Driver
China 46% of regional share Expressway and high-speed rail programs [13]
India 8.12% CAGR (2026–2035) Bharatmala, Sagarmala, DFC programs [5]
Japan USD 3.63 Billion (2025) Shinkansen extensions, expressway rehabilitation
South Korea 9% of regional share GTX metropolitan rail, new airport links
ASEAN 7.9% CAGR (2026–2035) Trans-ASEAN motorway, Jakarta MRT expansion [7]
Rest of Asia-Pacific USD 1.98 Billion (2025) Bangladesh, Sri Lanka corridor projects


Asia-Pacific is the dominant region in the transportation infrastructure market, powered by China's annual expressway investment exceeding USD 85 billion and India's combined Bharatmala-Sagarmala-DFC programs targeting over USD 120 billion in total outlay [5][13]. India is the region's fastest-growing country-level market, driven by record highway bidding under the Hybrid Annuity Model and near-completion of the 2,843-kilometer Dedicated Freight Corridor.

South America

Country Key Metric Key Driver
Brazil 62% of regional share Federal concession rounds, airport PPPs [23]
Argentina 6.3% CAGR (2026–2035) Vaca Muerta logistics corridor
Rest of South America USD 0.87 Billion (2025) Chile, Colombia toll road concessions


Brazil's federal highway concession program continues to anchor the South American portion of the transportation infrastructure market. Seventeen new concession packages covering 9,400 kilometers were tendered between 2023 and 2025, attracting both domestic and European construction groups [23]. Argentina's logistics corridor linking Vaca Muerta shale resources to Atlantic ports is emerging as the sub-region's most capital-intensive greenfield program.

Middle East & Africa

Country Key Metric Key Driver
Saudi Arabia 34% of regional share NEOM, Riyadh Metro Phase 2, Red Sea airport [6]
UAE USD 1.19 Billion (2025) Etihad Rail, Al Maktoum Airport expansion
South Africa 7.6% CAGR (2026–2035) SANRAL road upgrades, Durban port deepening
Egypt 18% of regional share New Administrative Capital monorail, Suez corridor [24]
Rest of MEA 8.5% CAGR (2026–2035) AfCFTA trade corridors, Nairobi expressway-type PPPs


The Middle East & Africa region is the fastest-growing segment of the transportation infrastructure market at an 8.21% CAGR, propelled by Saudi Arabia's giga-project construction cycle and Egypt's new administrative capital transport network [6][24]. The Saudi Public Investment Fund is directing over USD 70 billion into transport-related mega-projects through 2030, while AfCFTA implementation is unlocking multilateral funding for cross-border road and rail corridors across sub-Saharan Africa.


Transportation Infrastructure Market By Region, 2025-2035

Competitive Benchmarking

The global transportation infrastructure market exhibits medium concentration, with the top five players accounting for an estimated 22–28% of global contract value. The competitive field is stratified: a handful of diversified engineering conglomerates compete for mega-projects above USD 1 billion, while a fragmented tier of regional contractors captures the volume of mid-size and local projects. Cross-border joint ventures are increasingly common on large-scale rail and port programs.

Company Est. Revenue Share Range Key Offerings Strategic Positioning
VINCI SA ~5–8% Motorway concessions, airport construction and rail civil works Integrated concession operator with 4,500+ km toll-road portfolio
ACS Group ~4–7% Highway construction, tunnel boring, bridge engineering Global EPC presence through Hochtief and Cimic subsidiaries
China Communications Construction Co. ~5–8% Port construction, expressway building, bridge engineering Dominant in Belt and Road-linked transport projects
Larsen & Toubro ~3–5% Highway EPC, metro rail, airport terminals India's largest transport contractor with a growing Middle East presence
Bechtel Corporation ~3–5% Mega-project management, rail systems and airport delivery U.S.-headquartered, known for complex program management
Bouygues Construction ~2–4% Road and rail civil works, PPP concessions Strong in Francophone Africa and European rail programs
Ferrovial ~2–4% Toll roads, airport operations, managed lanes Pioneer of asset-recycling and concession-based business models
Strabag SE ~2–3% Road construction, tunneling and railway superstructure Central European leader with an expanding Scandinavian footprint
Fluor Corporation ~2–3% Transportation program management, design-build U.S. federal and state DOT specialist
Skanska AB ~2–3% Highway and bridge construction, PPP delivery Nordic sustainability leader with U.S. civil operations


Recent News & Developments


  • Ceigall India(July 2026): The company secured three Hybrid Annuity Mode highway projects totaling ₹4,050 crore and emerged as the lowest bidder for a ₹704.70 crore contract.
  • Government of India(July, 2026): Union ministers inaugurated the 63-km, six-lane Lucknow-Kanpur Expressway, built for ₹4,200 crore to reduce travel time and congestion between the cities significantly.
  • BRICS Nations(July, 2026): Transport ministers adopted a ministerial declaration on Sustainable Aviation Fuel, infrastructure circularity, and transport decarbonisation to foster deeper cooperation under India’s 2026 chairship.


Transportation Infrastructure Market Report Scope

Parameter Detail
Market Scope Global transportation infrastructure construction covering roadways, railways, airways, ports, and inland waterways
Study Period 2021–2035
CAGR 6.96% (2026–2035)
Base Year Market Size USD 84.70 Billion (2025)
Forecast Endpoint USD 166.00 Billion (2035)
Fastest Growing Segment Ports and Inland Waterways (8.68% CAGR)
Companies Profiled 10 (VINCI, ACS, CCCC, L&T, Bechtel, Bouygues, Ferrovial, Strabag, Fluor, Skanska)
Valuation Currency USD Billion


FAQs

How does the hybrid annuity model differ from traditional BOT contracts in risk allocation?
Under a hybrid annuity, the government bears 40% of the construction cost upfront and pays annuity installments over 15 years, shifting traffic-revenue risk away from the contractor. This model has increased bid participation by 25–30% in India since 2020 [11].
What minimum BIM maturity level should contractors target for international tenders?
Most public agencies now require BIM Level 2, meaning collaborative 3D modeling with shared data environments. Contractors targeting EU or Middle Eastern tenders should invest in ISO 19650 certification to remain eligible [2].
Which financing instruments offer the lowest cost of capital for greenfield transport projects?
Sustainability-linked bonds and multilateral concessional loans typically offer 80–150 basis points below commercial bank debt for qualifying transport projects. Green-bond issuance for transport reached USD 42 billion in 2024 [12].
How are geopolitical tensions reshaping port-investment priorities?
Supply-chain diversification is redirecting capital toward alternative transshipment hubs in Vietnam, Morocco, and Oman, away from concentrated chokepoints. Port-construction pipelines in these countries have grown by over 35% since 2022 [9].
What lifecycle cost premium should asset owners budget for climate-resilient designs?
Climate-resilient design typically adds 10–15% upfront cost but reduces lifecycle maintenance expenditure by 25–30% over a 30-year horizon. The World Bank recommends incorporating these premiums into all new coastal and floodplain projects [12].
How are digital twin platforms changing concession-contract structures?
Concessionaires are embedding digital-twin delivery as a contract obligation, creating asset-health dashboards that enable performance-based maintenance payments. This shifts concession economics from fixed schedules to data-driven lifecycle management [25].
What role do sovereign wealth funds play in the transportation infrastructure market?
Sovereign wealth funds — including PIF, GIC, and ADIA — deployed over USD 18 billion into transport concessions globally in 2024. They favor brownfield toll roads and airport concessions for predictable inflation-linked returns [11].    
Author
Author
Author Profile
Tejas Chaudhary
Research Analyst Level II
I have a degree in Engineering (Civil), with masters in Business Administration (Marketing). With more than 4 years of experience in market research and consulting, I am involved in end-to-end process of market research, proposals, project kickoffs and delivery. I have research knowledge and expertise in consumer goods/packaging domain. Also I have worked for various other domains like construction & equipment. Effectively managed and delivered more than 60 report studies for regional as well as global clientele.
Download Free Sample

Kindly complete the form below to receive a free sample of this Report

Download PDF ×

We do not share your information with anyone. However, we may send you emails based on your report interest from time to time. You may contact us at any time to opt-out.
















