• Cat-intel
  • MedIntelliX
  • Resources
  • About Us
  • Hero Background
    English
    Chinese
    French
    Japanese
    Korean
    German
    Spanish

    Trivalent Chromium Finishing Market Trends

    ID: MRFR/CnM/5999-CR
    149 Pages
    Anshula Mandaokar
    February 2019

    Trivalent Chromium Finishing Market Research Report by Type (Plating, Passivation, Conversion Coatings), by Application (Hydraulics & Heavy Machinery, Oil & Gas, Automotive, Aerospace, Others), and Region - Global Forecast till 2035

    Share:
    Download PDF ×

    We do not share your information with anyone. However, we may send you emails based on your report interest from time to time. You may contact us at any time to opt-out.

    Trivalent Chromium Finishing Market Infographic
    $ 4,950.0
    $ 5,950.0
    $ 7,250.0

    Market Trends

    Key Emerging Trends in the Trivalent Chromium Finishing Market

    Hexavalent chromium plating, once a staple in protective coatings for applications in automotive, aerospace, and industrial sectors, has encountered significant restrictions in recent years. Regulatory bodies such as the Occupational Safety and Health Administration (OSHA) and the Environmental Protection Agency (EPA) have imposed stringent guidelines due to the inherent dangers associated with hexavalent chromium, prompting a reevaluation of its usage. Hexavalent chromium ions, a key component in traditional plating solutions, are notorious for their high toxicity. Prolonged exposure to hexavalent chromium can lead to severe health hazards, including skin ulcers and the dissolution of mucous membranes. The US government has classified hexavalent chromium as a carcinogenic agent to humans, underlining the gravity of its health risks. One of the primary concerns with hexavalent chromium plating lies in its inefficiency during the electroplating process. The low efficiency results in the creation of mist, which, when released into the air, poses significant health risks. The mist carries minute amounts of hexavalent chromium compounds, contributing to a hazardous work environment. Workers exposed to this mist may experience skin irritation and respiratory issues, further emphasizing the urgent need for alternative, safer plating methods. In addition to the direct health risks, hexavalent chromium plating generates hazardous byproducts during the electroplating process. Substances such as lead chromates and barium sulfate, identified as hazardous wastes, contribute to environmental concerns. The disposal and management of these byproducts pose challenges, necessitating a shift toward more sustainable and eco-friendly plating alternatives. Recognizing the environmental and health hazards posed by hexavalent chromium plating, there has been a growing global push towards adopting safer alternatives. The need for innovation in coating technologies has become imperative, with an emphasis on developing protective coatings that can match or surpass the performance of hexavalent chromium while mitigating the associated risks. Several industries have responded proactively to these challenges by exploring and investing in alternative coating methods. The goal is to replace hexavalent chromium with coatings that are not only effective but also environmentally friendly and safe for workers. Advancements in plating technologies, such as trivalent chromium plating, have gained traction as promising alternatives. Trivalent chromium offers a safer option, with reduced toxicity compared to hexavalent chromium, and has become a focus of research and development in the quest for sustainable plating solutions. Furthermore, the shift towards greener technologies aligns with the broader global commitment to sustainability. Companies are increasingly adopting environmentally conscious practices, recognizing that responsible manufacturing includes minimizing the environmental impact of production processes and the materials used. In conclusion, the era of hexavalent chromium plating is witnessing a transformative shift due to increased awareness of its health and environmental risks. Regulatory restrictions, coupled with the recognition of its hazardous nature, have prompted industries to explore safer and more sustainable alternatives. The pursuit of innovative coating technologies, such as trivalent chromium plating, reflects a collective effort to address these concerns while maintaining the high standards of protection required in automotive, aerospace, and industrial applications. The evolution away from hexavalent chromium marks a significant step towards safer workplaces, reduced environmental impact, and a more sustainable future for the industries relying on protective coatings.

    Market Summary

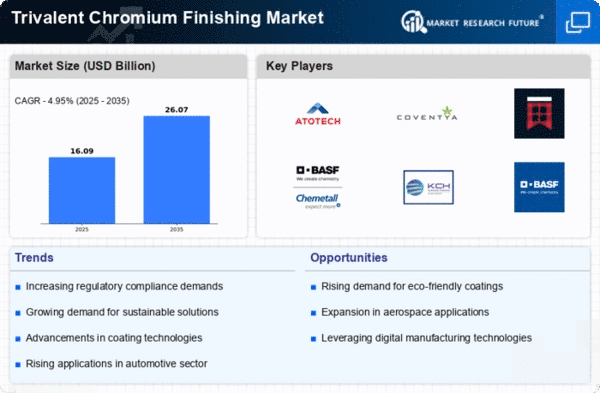
    The Global Trivalent Chromium Finishing Market is projected to grow from 290.7 USD Billion in 2024 to 551.3 USD Billion by 2035.

    Key Market Trends & Highlights

    Trivalent Chromium Finishing Key Trends and Highlights

    • The market is expected to experience a compound annual growth rate (CAGR) of 5.99 percent from 2025 to 2035.
    • By 2035, the market valuation is anticipated to reach 551.3 USD Billion, indicating robust growth potential.
    • In 2024, the market is valued at 290.7 USD Billion, reflecting a strong foundation for future expansion.
    • Growing adoption of trivalent chromium finishing due to its environmental benefits is a major market driver.

    Market Size & Forecast

    2024 Market Size 290.7 (USD Billion)
    2035 Market Size 551.3 (USD Billion)
    CAGR (2025-2035) 5.99%
    Largest Regional Market Share in 2024 latin_america)

    Major Players

    MacDermid, Inc. (U.S.), Atotech (Germany), Chem Processing, Inc. (U.S.), Ronatec C2C, Inc. (U.S.), Midland Polishing & Plating Ltd. (U.K.), ASTERION, LLC (U.S.), Electro Chemical Finishing (U.S.), CHEMEON Surface Technology, LLC (U.S.), Master Finish Company (U.S.), Three J's Industries, Inc. (U.S.)

    Market Trends

    The increasing regulatory focus on environmental sustainability is driving the adoption of trivalent chromium finishing technologies, which are perceived as safer alternatives to hexavalent chromium processes.

    U.S. Environmental Protection Agency

    Trivalent Chromium Finishing Market Market Drivers

    Market Growth Projections

    The Global Trivalent Chromium Finishing Market Industry is poised for substantial growth, with projections indicating a market value of 290.7 USD Billion in 2024 and an anticipated increase to 551.3 USD Billion by 2035. This growth trajectory suggests a compound annual growth rate of 5.99% from 2025 to 2035, reflecting the increasing adoption of trivalent chromium technologies across various sectors. The market's expansion is likely driven by factors such as regulatory support, technological advancements, and rising consumer demand for sustainable and high-quality finishing solutions. These projections underscore the industry's potential as it adapts to evolving market dynamics.

    Rising Automotive Production and Sales

    The resurgence of the automotive sector significantly influences the Global Trivalent Chromium Finishing Market Industry. With global automotive production projected to increase, the demand for durable and aesthetically pleasing components rises correspondingly. Trivalent chromium finishing offers excellent corrosion resistance, making it an attractive choice for automotive manufacturers. As the market evolves, the value is expected to reach 551.3 USD Billion by 2035, driven by the need for high-performance coatings in vehicles. This trend indicates a shift towards more sustainable and efficient finishing solutions, aligning with the industry's broader goals of reducing environmental impact.

    Growing Demand for Eco-Friendly Coatings

    The increasing emphasis on environmental sustainability drives the Global Trivalent Chromium Finishing Market Industry. As industries seek alternatives to hexavalent chromium, which poses significant health risks, trivalent chromium emerges as a safer option. This shift is particularly evident in sectors such as automotive and aerospace, where regulatory pressures and consumer preferences favor eco-friendly solutions. The market's value is projected to reach 290.7 USD Billion in 2024, reflecting a robust demand for sustainable finishing processes. Companies adopting trivalent chromium technologies not only comply with regulations but also enhance their brand image, appealing to environmentally conscious consumers.

    Regulatory Support for Sustainable Practices

    Government regulations promoting sustainable manufacturing practices bolster the Global Trivalent Chromium Finishing Market Industry. Many countries are implementing stricter environmental standards, encouraging industries to transition from harmful substances like hexavalent chromium to safer alternatives. This regulatory landscape not only fosters innovation but also incentivizes companies to adopt trivalent chromium technologies. As a result, manufacturers are likely to invest in research and development to enhance their finishing processes. The growing alignment between regulatory frameworks and market demands suggests a favorable environment for the expansion of trivalent chromium finishing solutions.

    Technological Advancements in Finishing Processes

    Innovations in trivalent chromium finishing technologies contribute to the expansion of the Global Trivalent Chromium Finishing Market Industry. Advanced techniques, such as electroplating and chemical vapor deposition, improve the efficiency and quality of coatings. These advancements enable manufacturers to achieve superior corrosion resistance and aesthetic appeal, which are crucial in competitive markets. As industries increasingly prioritize product longevity and performance, the adoption of these technologies is likely to accelerate. The anticipated compound annual growth rate of 5.99% from 2025 to 2035 underscores the potential for growth driven by technological enhancements in finishing processes.

    Increased Focus on Product Aesthetics and Durability

    The growing consumer preference for high-quality, aesthetically pleasing products drives the Global Trivalent Chromium Finishing Market Industry. Industries such as electronics, jewelry, and consumer goods increasingly prioritize surface finishes that enhance both appearance and durability. Trivalent chromium finishing provides a unique combination of visual appeal and protective qualities, making it a preferred choice for manufacturers. As consumer expectations evolve, companies are likely to invest in advanced finishing technologies to meet these demands. This trend indicates a potential for sustained growth in the market, as manufacturers strive to deliver products that align with consumer desires for both beauty and longevity.

    Market Segment Insights

    Regional Insights

    Key Companies in the Trivalent Chromium Finishing Market market include

    Industry Developments

    The United States market for trivalent chromium finishing was calculated at USD 44.07 million in 2016 and it is anticipated to register a compound annual growth rate (CAGR) of 5.4% from 2017 to 2025. And the rising environmental concerns with regard to hexavalent chrome are aimed to drive the demand for trivalent chrome in the country. According to a study, we consider the proper blend of accurate, reliable, and relevant data as of major importance. The data analysts are adept in the exactly interpreting data and gaining the correct information.

    Factors, that are taking forward the trivalent chromium finishing market growth include strict rules, regulations and orders, but the thermal spray coating as an alternative to plating can hamper the market growth.

    Intended Audience:

      • Trivalent chromium finishing manufacturers
      • Trivalent chromium finishing service providers
      • Traders and distributors of trivalent chromium finishing
      • Production process industries
      • Potential investors
      • Raw material suppliers
      • Nationalized laboratory

    Future Outlook

    Trivalent Chromium Finishing Market Future Outlook

    The Trivalent Chromium Finishing Market is projected to grow at a 5.99% CAGR from 2024 to 2035, driven by increasing environmental regulations and demand for sustainable alternatives.

    New opportunities lie in:

    • Develop advanced eco-friendly formulations to meet regulatory standards.
    • Expand into emerging markets with tailored solutions for local industries.
    • Invest in R&D for innovative applications in automotive and aerospace sectors.

    By 2035, the market is expected to achieve substantial growth, positioning itself as a leader in sustainable finishing solutions.

    Market Segmentation

    Trivalent Chromium Finishing Market Segmentation Overview

    SegmentedType
    • Plating
    • Passivation
    • Conversion Coatings

    Report Scope

    Report Attribute/Metric Details
    Market Size USD 273.81 Billion
    Market Size USD 290.66 Billion
    Market Size USD 465.5 Billion
    CAGR 5.80% CAGR (2024-2032)
    Base Year 2023
    Forecast Period 2024 to 2032
    Historical Data 2019 & 2020
    Forecast Units Value (USD Billion)
    Report Coverage Revenue Forecast, Competitive Landscape, Growth Factors, and Trends
    Segments Covered Type, Application, End-Use Industry and Region.
    Geographies Covered North America, Europe, Asia-Pacific, and Rest of the World (RoW)
    Key Vendors MacDermid, Inc. (U.S.), Atotech (Germany), Chem Processing, Inc. (U.S.), Ronatec C2C, Inc. (U.S.), Midland Polishing & Plating Ltd. (U.K.), ASTERION, LLC (U.S.), Electro Chemical Finishing (U.S.), CHEMEON Surface Technology, LLC (U.S.), Master Finish Company (U.S.), and Three J's Industries, Inc. (U.S.).
    Key Market Opportunities Strategic market evolution, value chain optimization, trade regulations, product launches, area marketplace expanding, and technological innovations.
    Key Market Drivers   Growing demand in the automotive industry is boosting market growth.
     

    Market Highlights

    Author

    Anshula Mandaokar
    Team Lead - Research

    She holds an experience of about 6+ years in market research and business consulting, working under the spectrum of information communication technology, telecommunications and semiconductor domains. aarti conceptualizes and implements a scalable business strategy and provides strategic leadership to the clients. her expertise lies in market estimation, competitive intelligence, pipeline analysis, customer assessment, etc.

    Leave a Comment

    Latest Comments

    John Doe
    john@example.com

    This is a great article! Really helped me understand the topic better.

    Posted on July 23, 2025, 10:15 AM
    Jane Smith
    jane@domain.com

    Thanks for sharing this. I’ve bookmarked it for later reference.

    Posted on July 22, 2025, 7:45 PM

    FAQs

    At what CAGR is the trivalent chromium finishing market projected to grow during the forecast period?

    The trivalent chromium finishing market is projected to grow at a 5.80% CAGR between 2024-2032

    What will be the value of the trivalent chromium finishing market during the forecast period?

    The trivalent chromium finishing market is predicted to touch USD 465.5 Billion by 2032.

    Which region will dominate the trivalent chromium finishing market?

    Asia Pacific will dominate the trivalent chromium finishing market.

    What are the key factors driving the trivalent chromium finishing market?

    Growing demand in the automotive industry is boosting market growth.

    Which factors may restrict the trivalent chromium finishing market growth?

    Availability of alternatives may restrict market growth.

    1. Executive Summary
    2. Market Introduction
      1. Definition 18
      2. Scope of the Study 18
      3. List Of Assumptions 18
      4. Market Structure 19
      5. Key Takeaways 19
    3. Market Insights
    4. Research Methodology
      1. Research Process 25
      2. Primary Research 25
      3. Secondary Research 26
      4. Market Size Estimation 27
      5. Forecast Model 28
    5. Market Dynamics
      1. Introduction 30
      2. Drivers 31
        1. Stringent Regulations On The Use Of Hexavalent Chromium 31
        2. Increasing Demand For Trivalent Chromium Plating In The Automotive Industry 31
        3. Drivers Impact Analysis 32
      3. Restraints 33
        1. Thermal Spray Coating As An Effective Alternative To Hard Chrome Plating 33
        2. Restraints Impact Analysis 33
      4. Opportunities 34
        1. Surging Demand For Chrome Plated Plastics 34
      5. Challenges 34
        1. High Costs 34
    6. Market Factor Analysis
      1. Supply Chain Analysis 36
        1. Raw Materials 37
        2. Key Players 37
        3. Distribution Channel 37
        4. Applications 37
      2. Porter’s Five Forces Model 37
        1. Threat Of New Entrants 38
        2. Rivalry 38
        3. Threat Of Substitutes 38
        4. Bargaining Power Of Suppliers 38
        5. Bargaining Power Of Buyers 38
      3. Customer Analysis 39
      4. Pricing Analysis 40
      5. Macroeconomic Indicator 41
    7. Global Trivalent Chromium Finishing Market, By Type
      1. Introduction 43
      2. Plating 45
      3. Conversion Coatings 46
      4. Passivation 47
    8. Global Trivalent Chromium Finishing Market, By Application
      1. Introduction 49
      2. Automotive 51
      3. Hydraulics & Heavy Machinery 52
      4. Oil & Gas 53
      5. Aerospace 54
      6. Others 55
    9. Global Trivalent Chromium Finishing Market, By Region
      1. Introduction 57
      2. North America 61
        1. US 64
        2. Canada 66
      3. Europe 68
        1. Germany 71
        2. France 73
        3. Russia 75
        4. UK 77
        5. Spain 79
        6. Italy 81
        7. Poland 83
        8. Rest Of Europe 85
      4. Asia Pacific 87
        1. China 90
        2. Japan 92
        3. India 94
        4. South Korea 96
        5. Australia & New Zealand 98
        6. Thailand 100
        7. Rest Of Asia Pacific 102
      5. Latin America 104
        1. Mexico 107
        2. Brazil 109
        3. Argentina 111
        4. Rest Of Latin America 113
      6. The Middle East And Africa 115
        1. Turkey 118
        2. South Korea 120
        3. GCC COUNTRIES 122
        4. Egypt 124
        5. Rest Of The Middle East And Africa 126
    10. Competitive Landscape
      1. Competitive Landscape 129
        1. Introduction 129
        2. Key Development Analysis 129
        3. Market Strategy Analysis 130
    11. Company Profiles
      1. MacDermid, Inc. 132
        1. Company Overview 132
        2. Financial Overview 132
        3. Products Offered 132
        4. Key Developments 132
        5. SWOT Analysis 133
        6. Key Strategies 133
      2. Atotech 134
        1. Company Overview 134
        2. Financial Overview 134
        3. Products Offered 134
        4. Key Developments 134
        5. SWOT Analysis 135
        6. Key Strategies 135
      3. Chem Processing, Inc. 136
        1. Company Overview 136
        2. Financial Overview 136
        3. Products Offered 136
        4. Key Developments 136
        5. SWOT Analysis 136
        6. Key Strategies 136
      4. Ronatec C2C, Inc. 137
        1. Company Overview 137
        2. Financial Overview 137
        3. Products Offered 137
        4. Key Developments 137
        5. SWOT Analysis 137
        6. Key Strategies 137
      5. Midland Polishing & Plating Ltd 138
        1. Company Overview 138
        2. Financial Overview 138
        3. Products Offered 138
        4. Key Developments 138
        5. SWOT Analysis 138
        6. Key Strategies 138
      6. ASTERION, LLC 139
        1. Company Overview 139
        2. Financial Overview 139
        3. Products Offered 139
        4. Key Developments 139
        5. SWOT Analysis 139
        6. Key Strategies 140
      7. Electro Chemical Finishing 141
        1. Company Overview 141
        2. Financial Overview 141
        3. Products Offered 141
        4. Key Developments 141
        5. SWOT Analysis 141
        6. Key Strategies 141
      8. CHEMEON Surface Technology, LLC 142
        1. Company Overview 142
        2. Financial Overview 142
        3. Products Offered 142
        4. Key Developments 142
        5. SWOT Analysis 143
        6. Key Strategies 143
      9. Master Finish Company 144
        1. Company Overview 144
        2. Financial Overview 144
        3. Products Offered 144
        4. Key Developments 144
        5. SWOT Analysis 144
        6. Key Strategies 144
      10. Three J's Industries, Inc. 145
        1. Company Overview 145
        2. Financial Overview 145
        3. Products Offered 145
        4. Key Developments 145
        5. SWOT Analysis 146
        6. Key Strategies 146
    12. Conclusion
    13. List of Tables and Figures
      1. 13 List Of Tables
      2. TABLE 1 MARKET SYNOPSIS 16
      3. TABLE 2 LIST OF ASSUMPTIONS 18
      4. TABLE 3 CUSTOMER ANALYSIS 39
      5. TABLE 4 PRICING BY REGION, USD PER TONS (2020-2027) 40
      6. TABLE 5 PRICING BY TYPE, USD PER TONS (2020-2027) 40
      7. TABLE 6 PRICING BY APPLICATION, USD PER TONS (2020-2027) 40
      8. TABLE 7 NOMINAL GDP IN USD MILLION, BY COUNTRY, 2020 41
      9. TABLE 8 GLOBAL TRIVALENT CHROMIUM FINISHING, BY TYPE, 2020-2027 (USD THOUSAND) 43
      10. TABLE 9 GLOBAL TRIVALENT CHROMIUM FINISHING MARKET, BY TYPE, 2020-2027 (TONS) 44
      11. TABLE 10 GLOBAL TRIVALENT CHROMIUM FINISHING MARKET FOR PLATING, BY REGION, 2020-2027 (USD THOUSAND) 45
      12. TABLE 11 GLOBAL TRIVALENT CHROMIUM FINISHING MARKET FOR PLATING, BY REGION, 2020-2027 (TONS) 45
      13. TABLE 12 GLOBAL TRIVALENT CHROMIUM FINISHING MARKET FOR CONVERSION COATINGS, BY REGION, 2020-2027 (USD THOUSAND) 46
      14. TABLE 13 GLOBAL TRIVALENT CHROMIUM FINISHING MARKET FOR CONVERSION COATINGS, BY REGION, 2020-2027 (TONS) 46
      15. TABLE 14 GLOBAL TRIVALENT CHROMIUM FINISHING MARKET FOR PASSIVATION, BY REGION, 2020-2027 (USD THOUSAND) 47
      16. TABLE 15 GLOBAL TRIVALENT CHROMIUM FINISHING MARKET FOR PASSIVATION, BY REGION, 2020-2027 (TONS) 47
      17. TABLE 16 GLOBAL TRIVALENT CHROMIUM FINISHING, BY APPLICATION, 2020-2027 (USD THOUSAND) 49
      18. TABLE 17 GLOBAL TRIVALENT CHROMIUM FINISHING MARKET, BY APPLICATION, 2020-2027 (TONS) 50
      19. TABLE 18 GLOBAL TRIVALENT CHROMIUM FINISHING MARKET FOR AUTOMOTIVE, BY REGION, 2020-2027 (USD THOUSAND) 51
      20. TABLE 19 GLOBAL TRIVALENT CHROMIUM FINISHING MARKET FOR AUTOMOTIVE, BY REGION, 2020-2027 (TONS) 51
      21. TABLE 20 GLOBAL TRIVALENT CHROMIUM FINISHINGMARKET FOR HYDRAULICS & HEAVY MACHINERY, BY REGION, 2020-2027 (USD THOUSAND) 52
      22. TABLE 21 GLOBAL TRIVALENT CHROMIUM FINISHING MARKET FOR HYDRAULICS & HEAVY MACHINERY, BY REGION, 2020-2027 (TONS) 52
      23. TABLE 22 GLOBAL TRIVALENT CHROMIUM FINISHING MARKET FOR OIL & GAS, BY REGION, 2020-2027 (USD THOUSAND) 53
      24. TABLE 23 GLOBAL TRIVALENT CHROMIUM FINISHINGMARKET FOR OIL & GAS, BY REGION, 2020-2027 (TONS) 53
      25. TABLE 24 GLOBAL TRIVALENT CHROMIUM FINISHING MARKET FOR AEROSPACE, BY REGION, 2020-2027 (USD THOUSAND) 54
      26. TABLE 25 GLOBAL TRIVALENT CHROMIUM FINISHINGMARKET FOR AEROSPACE, BY REGION, 2020-2027 (TONS) 54
      27. TABLE 26 GLOBAL TRIVALENT CHROMIUM FINISHING MARKET FOR OTHERS, BY REGION, 2020-2027 (USD THOUSAND) 55
      28. TABLE 27 GLOBAL TRIVALENT CHROMIUM FINISHING MARKET FOR OTHERS, BY REGION, 2020-2027 (TONS) 55
      29. TABLE 28 GLOBAL TRIVALENT CHROMIUM FINISHING MARKET, BY REGION, 2020-2027 (USD THOUSAND) 57
      30. TABLE 29 GLOBAL TRIVALENT CHROMIUM FINISHING MARKET, BY REGION, 2020-2027 (TONS) 58
      31. TABLE 30 GLOBAL TRIVALENT CHROMIUM FINISHING MARKET, BY TYPE, 2020-2027 (USD THOUSAND) 59
      32. TABLE 31 GLOBAL TRIVALENT CHROMIUM FINISHING MARKET, BY TYPE, 2020-2027 (TONS) 59
      33. TABLE 32 GLOBAL TRIVALENT CHROMIUM FINISHING MARKET, BY APPLICATION, 2020-2027 (USD THOUSAND) 60
      34. TABLE 33 GLOBAL TRIVALENT CHROMIUM FINISHING MARKET, BY APPLICATION, 2020-2027 (TONS) 60
      35. TABLE 34 NORTH AMERICA TRIVALENT CHROMIUM FINISHING MARKET, BY COUNTRY, 2020-2027 (USD THOUSAND) 61
      36. TABLE 35 NORTH AMERICA TRIVALENT CHROMIUM FINISHINGMARKET, BY COUNTRY, 2020-2027 (TONS) 61
      37. TABLE 36 NORTH AMERICA TRIVALENT CHROMIUM FINISHING MARKET, BY TYPE, 2020-2027 (USD THOUSAND) 61
      38. TABLE 37 NORTH AMERICA TRIVALENT CHROMIUM FINISHING MARKET, BY TYPE, 2020-2027 (TONS) 62
      39. TABLE 38 NORTH AMERICA TRIVALENT CHROMIUM FINISHING MARKET, BY APPLICATION, 2020-2027 (USD THOUSAND) 62
      40. TABLE 39 NORTH AMERICA TRIVALENT CHROMIUM FINISHING MARKET, BY APPLICATION, 2020-2027 (TONS) 63
      41. TABLE 40 US TRIVALENT CHROMIUM FINISHING MARKET, BY TYPE, 2020-2027 (USD THOUSAND) 64
      42. TABLE 41 US TRIVALENT CHROMIUM FINISHING MARKET, BY TYPE, 2020-2027 (TONS) 64
      43. TABLE 42 US TRIVALENT CHROMIUM FINISHING MARKET, BY APPLICATION, 2020-2027 (USD THOUSAND) 65
      44. TABLE 43 US TRIVALENT CHROMIUM FINISHINGMARKET, BY APPLICATION, 2020-2027 (TONS) 65
      45. TABLE 44 CANADA TRIVALENT CHROMIUM FINISHING MARKET, BY TYPE, 2020-2027 (USD THOUSAND) 66
      46. TABLE 45 CANADA TRIVALENT CHROMIUM FINISHING MARKET, BY TYPE, 2020-2027 (TONS) 66
      47. TABLE 46 CANADA TRIVALENT CHROMIUM FINISHING MARKET, BY APPLICATION, 2020-2027 (USD THOUSAND) 67
      48. TABLE 47 CANADA TRIVALENT CHROMIUM FINISHING MARKET, BY APPLICATION, 2020-2027 (TONS) 67
      49. TABLE 48 EUROPE TRIVALENT CHROMIUM FINISHING MARKET, BY COUNTRY, 2020-2027 (USD THOUSAND) 68
      50. TABLE 49 EUROPE TRIVALENT CHROMIUM FINISHING MARKET, BY COUNTRY, 2020-2027 (TONS) 68
      51. TABLE 50 EUROPE TRIVALENT CHROMIUM FINISHING MARKET, BY TYPE, 2020-2027 (USD THOUSAND) 69
      52. TABLE 51 EUROPE TRIVALENT CHROMIUM FINISHING MARKET, BY TYPE, 2020-2027 (TONS) 69
      53. TABLE 52 EUROPE TRIVALENT CHROMIUM FINISHING MARKET, BY APPLICATION, 2020-2027 (USD THOUSAND) 70
      54. TABLE 53 EUROPE TRIVALENT CHROMIUM FINISHING MARKET, BY APPLICATION, 2020-2027 (TONS) 70
      55. TABLE 54 GERMANY TRIVALENT CHROMIUM FINISHING MARKET, BY TYPE, 2020-2027 (USD THOUSAND) 71
      56. TABLE 55 GERMANY TRIVALENT CHROMIUM FINISHING MARKET, BY TYPE, 2020-2027 (TONS) 71
      57. TABLE 56 GERMANY TRIVALENT CHROMIUM FINISHING MARKET, BY APPLICATION, 2020-2027 (USD THOUSAND) 72
      58. TABLE 57 GERMANY TRIVALENT CHROMIUM FINISHING MARKET, BY APPLICATION, 2020-2027 (TONS) 72
      59. TABLE 58 FRANCE TRIVALENT CHROMIUM FINISHING MARKET, BY TYPE, 2020-2027 (USD THOUSAND) 73
      60. TABLE 59 FRANCE TRIVALENT CHROMIUM FINISHING MARKET, BY TYPE, 2020-2027 (TONS) 73
      61. TABLE 60 FRANCE TRIVALENT CHROMIUM FINISHING MARKET, BY APPLICATION, 2020-2027 (USD THOUSAND) 74
      62. TABLE 61 FRANCE TRIVALENT CHROMIUM FINISHING MARKET, BY APPLICATION, 2020-2027 (TONS) 74
      63. TABLE 62 RUSSIA TRIVALENT CHROMIUM FINISHING MARKET, BY TYPE, 2020-2027 (USD THOUSAND) 75
      64. TABLE 63 RUSSIA TRIVALENT CHROMIUM FINISHING MARKET, BY TYPE, 2020-2027 (TONS) 75
      65. TABLE 64 RUSSIA TRIVALENT CHROMIUM FINISHING MARKET, BY APPLICATION, 2020-2027 (USD THOUSAND) 76
      66. TABLE 65 RUSSIA TRIVALENT CHROMIUM FINISHING MARKET, BY APPLICATION, 2020-2027 (TONS) 76
      67. TABLE 66 UK TRIVALENT CHROMIUM FINISHING MARKET, BY TYPE, 2020-2027 (USD THOUSAND) 77
      68. TABLE 67 UK TRIVALENT CHROMIUM FINISHING MARKET, BY TYPE, 2020-2027 (TONS) 77
      69. TABLE 68 UK TRIVALENT CHROMIUM FINISHINGMARKET, BY APPLICATION, 2020-2027 (USD THOUSAND) 78
      70. TABLE 69 UK TRIVALENT CHROMIUM FINISHINGMARKET, BY APPLICATION, 2020-2027 (TONS) 78
      71. TABLE 70 SPAIN TRIVALENT CHROMIUM FINISHING MARKET, BY TYPE, 2020-2027 (USD THOUSAND) 79
      72. TABLE 71 SPAIN TRIVALENT CHROMIUM FINISHING MARKET, BY TYPE, 2020-2027 (TONS) 79
      73. TABLE 72 SPAIN TRIVALENT CHROMIUM FINISHING MARKET, BY APPLICATION, 2020-2027 (USD THOUSAND) 80
      74. TABLE 73 SPAIN TRIVALENT CHROMIUM FINISHING MARKET, BY APPLICATION, 2020-2027 (TONS) 80
      75. TABLE 74 ITALY TRIVALENT CHROMIUM FINISHING MARKET, BY TYPE, 2020-2027 (USD THOUSAND) 81
      76. TABLE 75 ITALY TRIVALENT CHROMIUM FINISHING MARKET, BY TYPE, 2020-2027 (TONS) 81
      77. TABLE 76 ITALY TRIVALENT CHROMIUM FINISHING MARKET, BY APPLICATION, 2020-2027 (USD THOUSAND) 82
      78. TABLE 77 ITALY TRIVALENT CHROMIUM FINISHING MARKET, BY APPLICATION, 2020-2027 (TONS) 82
      79. TABLE 78 POLAND TRIVALENT CHROMIUM FINISHING MARKET, BY TYPE, 2020-2027 (USD THOUSAND) 83
      80. TABLE 79 POLAND TRIVALENT CHROMIUM FINISHING MARKET, BY TYPE, 2020-2027 (TONS) 83
      81. TABLE 80 POLAND TRIVALENT CHROMIUM FINISHING MARKET, BY APPLICATION, 2020-2027 (USD THOUSAND) 84
      82. TABLE 81 POLAND TRIVALENT CHROMIUM FINISHING MARKET, BY APPLICATION, 2020-2027 (TONS) 84
      83. TABLE 82 REST OF EUROPE TRIVALENT CHROMIUM FINISHING MARKET, BY TYPE, 2020-2027 (USD THOUSAND) 85
      84. TABLE 83 REST OF EUROPE TRIVALENT CHROMIUM FINISHING MARKET, BY TYPE, 2020-2027 (TONS) 85
      85. TABLE 84 REST OF EUROPE TRIVALENT CHROMIUM FINISHING MARKET, BY APPLICATION, 2020-2027 (USD THOUSAND) 86
      86. TABLE 85 REST OF EUROPE TRIVALENT CHROMIUM FINISHING MARKET, BY APPLICATION, 2020-2027 (TONS) 86
      87. TABLE 86 ASIA PACIFIC TRIVALENT CHROMIUM FINISHING MARKET, BY COUNTRY, 2020-2027 (USD THOUSAND) 87
      88. TABLE 87 ASIA PACIFIC TRIVALENT CHROMIUM FINISHING MARKET, BY COUNTRY, 2020-2027 (TONS) 87
      89. TABLE 88 ASIA PACIFIC TRIVALENT CHROMIUM FINISHING MARKET, BY TYPE, 2020-2027 (USD THOUSAND) 88
      90. TABLE 89 ASIA PACIFIC TRIVALENT CHROMIUM FINISHING MARKET, BY TYPE, 2020-2027 (TONS) 88
      91. TABLE 90 ASIA PACIFIC TRIVALENT CHROMIUM FINISHING MARKET, BY APPLICATION, 2020-2027 (USD THOUSAND) 89
      92. TABLE 91 ASIA PACIFIC TRIVALENT CHROMIUM FINISHING MARKET, BY APPLICATION, 2020-2027 (TONS) 89
      93. TABLE 92 CHINA TRIVALENT CHROMIUM FINISHING MARKET, BY TYPE, 2020-2027 (USD THOUSAND) 90
      94. TABLE 93 CHINA TRIVALENT CHROMIUM FINISHING MARKET, BY TYPE, 2020-2027 (TONS) 90
      95. TABLE 94 CHINA TRIVALENT CHROMIUM FINISHING MARKET, BY APPLICATION, 2020-2027 (USD THOUSAND) 91
      96. TABLE 95 CHINA TRIVALENT CHROMIUM FINISHINGMARKET, BY APPLICATION, 2020-2027 (TONS) 91
      97. TABLE 96 JAPAN TRIVALENT CHROMIUM FINISHING MARKET, BY TYPE, 2020-2027 (USD THOUSAND) 92
      98. TABLE 97 JAPAN TRIVALENT CHROMIUM FINISHING MARKET, BY TYPE, 2020-2027 (TONS) 92
      99. TABLE 98 JAPAN TRIVALENT CHROMIUM FINISHING MARKET, BY APPLICATION, 2020-2027 (USD THOUSAND) 93
      100. TABLE 99 JAPAN TRIVALENT CHROMIUM FINISHINGMARKET, BY APPLICATION, 2020-2027 (TONS) 93
      101. TABLE 100 INDIA TRIVALENT CHROMIUM FINISHING MARKET, BY TYPE, 2020-2027 (USD THOUSAND) 94
      102. TABLE 101 INDIA TRIVALENT CHROMIUM FINISHING MARKET, BY TYPE, 2020-2027 (TONS) 94
      103. TABLE 102 INDIA TRIVALENT CHROMIUM FINISHING MARKET, BY APPLICATION, 2020-2027 (USD THOUSAND) 95
      104. TABLE 103 INDIA TRIVALENT CHROMIUM FINISHING MARKET, BY APPLICATION, 2020-2027 (TONS) 95
      105. TABLE 104 SOUTH KOREA TRIVALENT CHROMIUM FINISHING MARKET, BY TYPE, 2020-2027 (USD THOUSAND) 96
      106. TABLE 105 SOUTH KOREA TRIVALENT CHROMIUM FINISHING MARKET, BY TYPE, 2020-2027 (TONS) 96
      107. TABLE 106 SOUTH KOREA TRIVALENT CHROMIUM FINISHING MARKET, BY APPLICATION, 2020-2027 (USD THOUSAND) 97
      108. TABLE 107 SOUTH KOREA TRIVALENT CHROMIUM FINISHING MARKET, BY APPLICATION, 2020-2027 (TONS) 97
      109. TABLE 108 AUSTRALIA & NEW ZEALAND TRIVALENT CHROMIUM FINISHING MARKET, BY TYPE, 2020-2027 (USD THOUSAND) 98
      110. TABLE 109 AUSTRALIA & NEW ZEALAND TRIVALENT CHROMIUM FINISHING MARKET, BY TYPE, 2020-2027 (TONS) 98
      111. TABLE 110 AUSTRALIA & NEW ZEALAND TRIVALENT CHROMIUM FINISHING MARKET, BY APPLICATION, 2020-2027 (USD THOUSAND) 99
      112. TABLE 111 AUSTRALIA & NEW ZEALAND TRIVALENT CHROMIUM FINISHING MARKET, BY APPLICATION, 2020-2027 (TONS) 99
      113. TABLE 112 THAILAND TRIVALENT CHROMIUM FINISHING MARKET, BY TYPE, 2020-2027 (USD THOUSAND) 100
      114. TABLE 113 THAILAND TRIVALENT CHROMIUM FINISHING MARKET, BY TYPE, 2020-2027 (TONS) 100
      115. TABLE 114 THAILAND TRIVALENT CHROMIUM FINISHING MARKET, BY APPLICATION, 2020-2027 (USD THOUSAND) 101
      116. TABLE 115 THAILAND TRIVALENT CHROMIUM FINISHING MARKET, BY APPLICATION, 2020-2027 (TONS) 101
      117. TABLE 116 REST OF ASIA PACIFIC TRIVALENT CHROMIUM FINISHING MARKET, BY TYPE, 2020-2027 (USD THOUSAND) 102
      118. TABLE 117 REST OF ASIA PACIFIC TRIVALENT CHROMIUM FINISHING MARKET, BY TYPE, 2020-2027 (TONS) 102
      119. TABLE 118 REST OF ASIA PACIFIC TRIVALENT CHROMIUM FINISHING MARKET, BY APPLICATION, 2020-2027 (USD THOUSAND) 103
      120. TABLE 119 REST OF ASIA PACIFIC TRIVALENT CHROMIUM FINISHING MARKET, BY APPLICATION, 2020-2027 (TONS) 103
      121. TABLE 120 LATIN AMERICA TRIVALENT CHROMIUM FINISHING MARKET, BY COUNTRY, 2020-2027 (USD THOUSAND) 104
      122. TABLE 121 LATIN AMERICA TRIVALENT CHROMIUM FINISHING MARKET, BY COUNTRY, 2020-2027 (TONS) 104
      123. TABLE 122 LATIN AMERICA TRIVALENT CHROMIUM FINISHING MARKET, BY TYPE, 2020-2027 (USD THOUSAND) 105
      124. TABLE 123 LATIN AMERICA TRIVALENT CHROMIUM FINISHING MARKET, BY TYPE, 2020-2027 (TONS) 105
      125. TABLE 124 LATIN AMERICA TRIVALENT CHROMIUM FINISHING MARKET, BY APPLICATION, 2020-2027 (USD THOUSAND) 106
      126. TABLE 125 LATIN AMERICA TRIVALENT CHROMIUM FINISHING MARKET, BY APPLICATION, 2020-2027 (TONS) 106
      127. TABLE 126 MEXICO TRIVALENT CHROMIUM FINISHING MARKET, BY TYPE, 2020-2027 (USD THOUSAND) 107
      128. TABLE 127 MEXICO TRIVALENT CHROMIUM FINISHING MARKET, BY TYPE, 2020-2027 (TONS) 107
      129. TABLE 128 MEXICO TRIVALENT CHROMIUM FINISHING MARKET, BY APPLICATION, 2020-2027 (USD THOUSAND) 108
      130. TABLE 129 MEXICO TRIVALENT CHROMIUM FINISHING MARKET, BY APPLICATION, 2020-2027 (TONS) 108
      131. TABLE 130 BRAZIL TRIVALENT CHROMIUM FINISHING MARKET, BY TYPE, 2020-2027 (USD THOUSAND) 109
      132. TABLE 131 BRAZIL TRIVALENT CHROMIUM FINISHING MARKET, BY TYPE, 2020-2027 (TONS) 109
      133. TABLE 132 BRAZIL TRIVALENT CHROMIUM FINISHING MARKET, BY APPLICATION, 2020-2027 (USD THOUSAND) 110
      134. TABLE 133 BRAZIL TRIVALENT CHROMIUM FINISHING MARKET, BY APPLICATION, 2020-2027 (TONS) 110
      135. TABLE 134 ARGENTINA TRIVALENT CHROMIUM FINISHING MARKET, BY TYPE, 2020-2027 (USD THOUSAND) 111
      136. TABLE 135 ARGENTINA TRIVALENT CHROMIUM FINISHING MARKET, BY TYPE, 2020-2027 (TONS) 111
      137. TABLE 136 ARGENTINA TRIVALENT CHROMIUM FINISHING MARKET, BY APPLICATION, 2020-2027 (USD THOUSAND) 112
      138. TABLE 137 ARGENTINA TRIVALENT CHROMIUM FINISHING MARKET, BY APPLICATION, 2020-2027 (TONS) 112
      139. TABLE 138 REST OF LATIN AMERICA TRIVALENT CHROMIUM FINISHING MARKET, BY TYPE, 2020-2027 (USD THOUSAND) 113
      140. TABLE 139 REST OF LATIN AMERICA TRIVALENT CHROMIUM FINISHING MARKET, BY TYPE, 2020-2027 (TONS) 113
      141. TABLE 140 REST OF LATIN AMERICA TRIVALENT CHROMIUM FINISHING MARKET, BY APPLICATION, 2020-2027 (USD THOUSAND) 114
      142. TABLE 141 REST OF LATIN AMERICA TRIVALENT CHROMIUM FINISHING MARKET, BY APPLICATION, 2020-2027 (TONS) 114
      143. TABLE 142 THE MIDDLE EAST AND AFRICA TRIVALENT CHROMIUM FINISHING MARKET, BY COUNTRY, 2020-2027 (USD THOUSAND) 115
      144. TABLE 143 THE MIDDLE EAST AND AFRICA TRIVALENT CHROMIUM FINISHING MARKET, BY COUNTRY, 2020-2027 (TONS) 115
      145. TABLE 144 THE MIDDLE EAST AND AFRICA TRIVALENT CHROMIUM FINISHING MARKET, BY TYPE, 2020-2027 (USD THOUSAND) 116
      146. TABLE 145 THE MIDDLE EAST AND AFRICA TRIVALENT CHROMIUM FINISHING MARKET, BY TYPE, 2020-2027 (TONS) 116
      147. TABLE 146 THE MIDDLE EAST AND AFRICA TRIVALENT CHROMIUM FINISHING MARKET, BY APPLICATION, 2020-2027 (USD THOUSAND) 117
      148. TABLE 147 THE MIDDLE EAST AND AFRICA TRIVALENT CHROMIUM FINISHINGMARKET, BY APPLICATION, 2020-2027 (TONS) 117
      149. TABLE 148 TURKEY TRIVALENT CHROMIUM FINISHING MARKET, BY TYPE, 2020-2027 (USD THOUSAND) 118
      150. TABLE 149 TURKEY TRIVALENT CHROMIUM FINISHING MARKET, BY TYPE, 2020-2027 (TONS) 118
      151. TABLE 150 TURKEY TRIVALENT CHROMIUM FINISHING MARKET, BY APPLICATION, 2020-2027 (USD THOUSAND) 119
      152. TABLE 151 TURKEY TRIVALENT CHROMIUM FINISHING MARKET, BY APPLICATION, 2020-2027 (TONS) 119
      153. TABLE 152 SOUTH KOREA TRIVALENT CHROMIUM FINISHING MARKET, BY TYPE, 2020-2027 (USD THOUSAND) 120
      154. TABLE 153 SOUTH KOREA TRIVALENT CHROMIUM FINISHING MARKET, BY TYPE, 2020-2027 (TONS) 120
      155. TABLE 154 SOUTH KOREA TRIVALENT CHROMIUM FINISHINGMARKET, BY APPLICATION, 2020-2027 (USD THOUSAND) 121
      156. TABLE 155 SOUTH KOREA TRIVALENT CHROMIUM FINISHINGMARKET, BY APPLICATION, 2020-2027 (TONS) 121
      157. TABLE 156 GCC COUNTRIES TRIVALENT CHROMIUM FINISHING MARKET, BY TYPE, 2020-2027 (USD THOUSAND) 122
      158. TABLE 157 GCC COUNTRIES TRIVALENT CHROMIUM FINISHING MARKET, BY TYPE, 2020-2027 (TONS) 122
      159. TABLE 158 GCC COUNTRIES TRIVALENT CHROMIUM FINISHING MARKET, BY APPLICATION, 2020-2027 (USD THOUSAND) 123
      160. TABLE 159 GCC COUNTRIES TRIVALENT CHROMIUM FINISHING MARKET, BY APPLICATION, 2020-2027 (TONS) 123
      161. TABLE 160 EGYPT TRIVALENT CHROMIUM FINISHING MARKET, BY TYPE, 2020-2027 (USD THOUSAND) 124
      162. TABLE 161 EGYPT. TRIVALENT CHROMIUM FINISHING MARKET, BY TYPE, 2020-2027 (TONS) 124
      163. TABLE 162 EGYPT TRIVALENT CHROMIUM FINISHING MARKET, BY APPLICATION, 2020-2027 (USD THOUSAND) 125
      164. TABLE 163 EGYPT TRIVALENT CHROMIUM FINISHING MARKET, BY APPLICATION, 2020-2027 (TONS) 125
      165. TABLE 164 REST OF THE MIDDLE EAST AND AFRICA TRIVALENT CHROMIUM FINISHING MARKET, BY TYPE, 2020-2027 (USD THOUSAND) 126
      166. TABLE 165 REST OF THE MIDDLE EAST AND AFRICA TRIVALENT CHROMIUM FINISHING MARKET, BY TYPE, 2020-2027 (TONS) 126
      167. TABLE 166 REST OF THE MIDDLE EAST AND AFRICA TRIVALENT CHROMIUM FINISHING MARKET, BY APPLICATION, 2020-2027 (USD THOUSAND) 127
      168. TABLE 167 REST OF THE MIDDLE EAST AND AFRICA TRIVALENT CHROMIUM FINISHING MARKET, BY APPLICATION, 2020-2027 (TONS) 127
      169. TABLE 168 KEY DEVELOPMENT ANALYSIS 129   14 List Of Figures
      170. FIGURE 1 GLOBAL TRIVALENT CHROMIUM FINISHING MARKET: MARKET STRUCTURE 19
      171. FIGURE 2 KEY TAKEAWAYS OF THE GLOBAL TRIVALENT CHROMIUM FINISHING MARKET 19
      172. FIGURE 3 NORTH AMERICA: MARKET SIZE AND MARKET SHARE, BY COUNTRY (2020 VS 2027) 21
      173. FIGURE 4 EUROPE: MARKET SIZE AND MARKET SHARE, BY COUNTRY (2020 VS 2027) 21
      174. FIGURE 5 ASIA-PACIFIC: MARKET SIZE AND MARKET SHARE, BY COUNTRY (2020 VS 2027) 22
      175. FIGURE 6 LATIN AMERICA: MARKET SIZE AND MARKET SHARE, BY COUNTRY (2020 VS 2027) 22
      176. FIGURE 7 MIDDLE EAST & AFRICA: MARKET SIZE AND MARKET SHARE, BY COUNTRY (2020 VS 2025) 23
      177. FIGURE 8 TRIVALENT CHROMIUM FINISHING MARKET, BY REGION, 2020 23
      178. FIGURE 9 RESEARCH PROCESS OF MRFR 25
      179. FIGURE 10 TOP-DOWN & Bottom-up ApproachES 27
      180. FIGURE 11 MARKET DYNAMICS OVERVIEW 30
      181. FIGURE 12 GLOBAL AUTOMOTIVE PRODUCTION (2015—2022) 32
      182. FIGURE 13 DRIVERS IMPACT ANALYSIS 32
      183. FIGURE 14 RESTRAINTS IMPACT ANALYSIS 33
      184. FIGURE 15 SUPPLY CHAIN ANALYSIS 36
      185. FIGURE 16 Porter's Five Forces Analysis OF THE GLOBAL TRIVALENT CHROMIUM FINISHING MARKET 37
      186. FIGURE 17 GLOBAL TRIVALENT CHROMIUM FINISHING MARKET, BY TYPE, 2020-2027 (USD THOUSAND) 43
      187. FIGURE 18 GLOBAL TRIVALENT CHROMIUM FINISHING MARKET, BY TYPE, 2020-2027 (TONS) 44
      188. FIGURE 19 GLOBAL TRIVALENT CHROMIUM FINISHING MARKET, BY APPLICATION, 2020-2027 (USD THOUSAND) 49
      189. FIGURE 20 GLOBAL TRIVALENT CHROMIUM FINISHING MARKET, BY APPLICATION, 2020-2027 (TONS) 50
      190. FIGURE 21 GLOBAL TRIVALENT CHROMIUM FINISHING MARKET BY REGION, 2020 (VALUE%) 57
      191. FIGURE 22 GLOBAL TRIVALENT CHROMIUM FINISHING MARKET BY REGION, 2020-2027 (TONS) 58

    Trivalent Chromium Finishing Market Segmentation

    Market Segmentation Overview

    • Detailed segmentation data will be available in the full report
    • Comprehensive analysis by multiple parameters
    • Regional and country-level breakdowns
    • Market size forecasts by segment
    Infographic

    Free Sample Request

    Kindly complete the form below to receive a free sample of this Report

    Get Free Sample

    Customer Strories

    “I am very pleased with how market segments have been defined in a relevant way for my purposes (such as "Portable Freezers & refrigerators" and "last-mile"). In general the report is well structured. Thanks very much for your efforts.”

    Victoria Milne

    Founder
    Case Study
    Chemicals and Materials