Segmentation Quick Reference
| Dimension | Sub-Segments | Dominant Segment | Fastest Growing Segment |
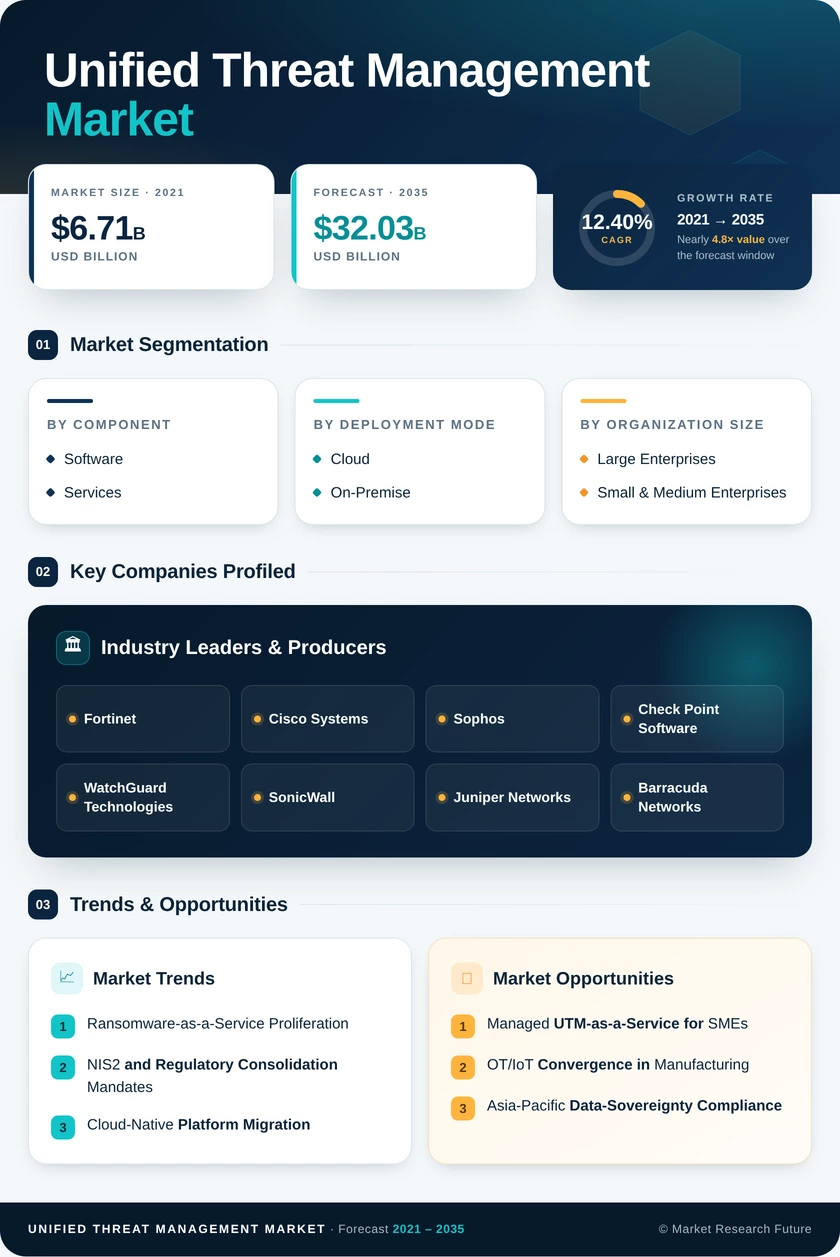
| Component | Software, Services | Software (70.5% share, 2025) | Services (13.6% CAGR) |
| Deployment Mode | Cloud, On-Premise | Cloud (61.7% share, 2025) | Cloud (14.89% CAGR) |
| Organization Size | Large Enterprises, Small & Medium Enterprises | Large Enterprises (65.1% share, 2025) | SMEs (13.42% CAGR) |
| End-User Industry | BFSI, IT & Telecom, Unified Threat Management Market, Government & Defense, Manufacturing, Retail & E-Commerce | BFSI (22.0% share, 2025) | IT & Telecom (13.48% CAGR) |
| Geography | North America, Europe, Asia-Pacific, South America, Middle East & Africa | North America (39.2% share, 2025) | Asia-Pacific (16.8% CAGR) |
Market Segmentation Overview
By Component
| Sub-Segment | Key Trend |
| Software | Subscription-licensed engines with continuous threat-intelligence updates dominate procurement |
| Services | Managed detection and response bundles drive growth as lean IT teams outsource UTM operations |
Software remains the revenue anchor as organizations shift to auto-updating, cloud-orchestrated engines that eliminate hardware dependency. Services are accelerating as MSSPs package monitoring, tuning, and incident response into turnkey monthly subscriptions.
By Deployment Mode
| Sub-Segment | Key Trend |
| Cloud | Elastic compute eliminates inspection-throughput ceilings; ideal for distributed workforces |
| On-Premise | Retains relevance in air-gapped environments and data-residency-mandated verticals |
Cloud deployments are growing fastest as branch-office and remote-worker architectures demand security that scales without shipping physical appliances. On-premise remains critical for defense, healthcare, and regulated financial environments.
By Organization Size
| Sub-Segment | Key Trend |
| Large Enterprises | Multi-year platform contracts tied to regulatory compliance programs sustain spending |
| Small & Medium Enterprises | Channel-partner bundles and cyber-insurance incentives unlock previously unprotected buyer segments |
Large enterprises generate the majority of revenue through complex, multi-site deployments. SMEs represent the expansion frontier, converting from unmanaged consumer-grade routers to professionally managed UTM platforms.
By End-User Industry
| Sub-Segment | Key Trend |
| Financial Services (BFSI) | PCI-DSS and central-bank cybersecurity mandates drive consolidated-platform adoption |
| IT & Telecommunications | 5G infrastructure protection and network-function virtualization create new security perimeters |
| Unified Threat Management Market | HIPAA enforcement and patient-data breach liabilities accelerate security spending |
| Government & Defense | Zero-trust executive orders and classified-network segmentation mandate converged appliances |
| Manufacturing | OT/IT convergence forces plant-gateway security upgrades |
| Retail & E-Commerce | PCI compliance and omni-channel expansion widen the attack surface |
Financial services lead adoption driven by stringent prudential regulation. IT and telecommunications are the fastest-growing verticals as 5G rollout and edge computing redefine network perimeters.
By Geography
| Sub-Segment | Key Trend |
| North America | Federal zero-trust mandates and dense MSSP ecosystem sustain market leadership |
| Europe | NIS2 transposition through 2027 drives converged-security procurement |
| Asia-Pacific | Data-sovereignty laws, manufacturing digitalization, and maritime cybersecurity rules fuel rapid expansion |
| South America | Banking-regulation enforcement and cloud-infrastructure build-outs drive adoption |
| Middle East & Africa | Smart-city programs, Vision 2030, and oil & gas OT security investment accelerate growth |
North America holds the largest revenue share, anchored by federal procurement and a mature channel ecosystem. Asia-Pacific is poised to narrow the gap through 2035 as regulatory mandates proliferate across India, China, ASEAN, and Oceania.