Request Free Sample ×

Kindly complete the form below to receive a free sample of this Report

* Please use a valid business email

Leading companies partner with us for data-driven Insights

clients tt-cursor
Hero Background

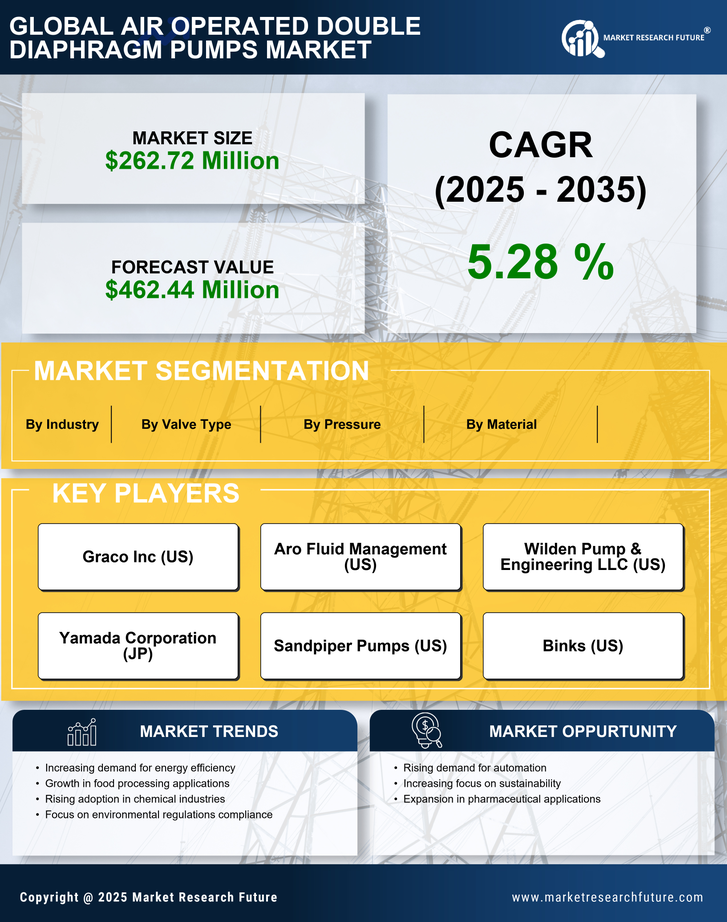
US Air Operated Double Diaphragm Pumps Market

ID: MRFR/EnP/16724-HCR
100 Pages
Garvit Vyas
Last Updated: April 06, 2026
US Diaphragm Pumps Market Research Report By Operation (Single, Double), By Mechanism (Air Operated, Electrically Operated), By Pressure (Up to 80, 80-200, > 200 bar) and By End-Use (Oil & Gas, Food & Beverages, Water & Wastewater, Chemicals) – United States Market Forecast Till 2035
Download PDF ×

We do not share your information with anyone. However, we may send you emails based on your report interest from time to time. You may contact us at any time to opt-out.

  1. 1 SECTION I: EXECUTIVE SUMMARY AND KEY HIGHLIGHTS
    1. 1.1 EXECUTIVE SUMMARY
      1. 1.1.1 Market Overview
      2. 1.1.2 Key Findings
      3. 1.1.3 Market Segmentation
      4. 1.1.4 Competitive Landscape
      5. 1.1.5 Challenges and Opportunities
      6. 1.1.6 Future Outlook
  2. 2 SECTION II: SCOPING, METHODOLOGY AND MARKET STRUCTURE
    1. 2.1 MARKET INTRODUCTION
      1. 2.1.1 Definition
      2. 2.1.2 Scope of the study
        1. 2.1.2.1 Research Objective
        2. 2.1.2.2 Assumption
        3. 2.1.2.3 Limitations
    2. 2.2 RESEARCH METHODOLOGY
      1. 2.2.1 Overview
      2. 2.2.2 Data Mining
      3. 2.2.3 Secondary Research
      4. 2.2.4 Primary Research
        1. 2.2.4.1 Primary Interviews and Information Gathering Process
        2. 2.2.4.2 Breakdown of Primary Respondents
      5. 2.2.5 Forecasting Model
      6. 2.2.6 Market Size Estimation
        1. 2.2.6.1 Bottom-Up Approach
        2. 2.2.6.2 Top-Down Approach
      7. 2.2.7 Data Triangulation
      8. 2.2.8 Validation
  3. 3 SECTION III: QUALITATIVE ANALYSIS
    1. 3.1 MARKET DYNAMICS
      1. 3.1.1 Overview
      2. 3.1.2 Drivers
      3. 3.1.3 Restraints
      4. 3.1.4 Opportunities
    2. 3.2 MARKET FACTOR ANALYSIS
      1. 3.2.1 Value chain Analysis
      2. 3.2.2 Porter's Five Forces Analysis
        1. 3.2.2.1 Bargaining Power of Suppliers
        2. 3.2.2.2 Bargaining Power of Buyers
        3. 3.2.2.3 Threat of New Entrants
        4. 3.2.2.4 Threat of Substitutes
        5. 3.2.2.5 Intensity of Rivalry
      3. 3.2.3 COVID-19 Impact Analysis
        1. 3.2.3.1 Market Impact Analysis
        2. 3.2.3.2 Regional Impact
        3. 3.2.3.3 Opportunity and Threat Analysis
  4. 4 SECTION IV: QUANTITATIVE ANALYSIS
    1. 4.1 Industrial Automation & Equipment, BY Valve Type (USD Million)
      1. 4.1.1 Ball Valve
      2. 4.1.2 Flap Valve
    2. 4.2 Industrial Automation & Equipment, BY Material (USD Million)
      1. 4.2.1 Aluminum
      2. 4.2.2 Stainless Steel
      3. 4.2.3 Cast Iron
    3. 4.3 Industrial Automation & Equipment, BY Pressure (USD Million)
      1. 4.3.1 Up to 5 bar
      2. 4.3.2 5 bar - 10 bar
      3. 4.3.3 Above 10 bar
    4. 4.4 Industrial Automation & Equipment, BY Industry (USD Million)
      1. 4.4.1 Food & Beverage
      2. 4.4.2 Pharmaceutical
      3. 4.4.3 Chemical
      4. 4.4.4 Water & Wastewater
      5. 4.4.5 Oil & Gas
      6. 4.4.6 Paper & Pulp
      7. 4.4.7 Electronics
      8. 4.4.8 Marine
  5. 5 SECTION V: COMPETITIVE ANALYSIS
    1. 5.1 Competitive Landscape
      1. 5.1.1 Overview
      2. 5.1.2 Competitive Analysis
      3. 5.1.3 Market share Analysis
      4. 5.1.4 Major Growth Strategy in the Industrial Automation & Equipment
      5. 5.1.5 Competitive Benchmarking
      6. 5.1.6 Leading Players in Terms of Number of Developments in the Industrial Automation & Equipment
      7. 5.1.7 Key developments and growth strategies
        1. 5.1.7.1 New Product Launch/Service Deployment
        2. 5.1.7.2 Merger & Acquisitions
        3. 5.1.7.3 Joint Ventures
      8. 5.1.8 Major Players Financial Matrix
        1. 5.1.8.1 Sales and Operating Income
        2. 5.1.8.2 Major Players R&D Expenditure. 2023
    2. 5.2 Company Profiles
      1. 5.2.1 Graco Inc (US)
        1. 5.2.1.1 Financial Overview
        2. 5.2.1.2 Products Offered
        3. 5.2.1.3 Key Developments
        4. 5.2.1.4 SWOT Analysis
        5. 5.2.1.5 Key Strategies
      2. 5.2.2 Aro Fluid Management (US)
        1. 5.2.2.1 Financial Overview
        2. 5.2.2.2 Products Offered
        3. 5.2.2.3 Key Developments
        4. 5.2.2.4 SWOT Analysis
        5. 5.2.2.5 Key Strategies
      3. 5.2.3 Wilden Pump & Engineering LLC (US)
        1. 5.2.3.1 Financial Overview
        2. 5.2.3.2 Products Offered
        3. 5.2.3.3 Key Developments
        4. 5.2.3.4 SWOT Analysis
        5. 5.2.3.5 Key Strategies
      4. 5.2.4 Yamada Corporation (JP)
        1. 5.2.4.1 Financial Overview
        2. 5.2.4.2 Products Offered
        3. 5.2.4.3 Key Developments
        4. 5.2.4.4 SWOT Analysis
        5. 5.2.4.5 Key Strategies
      5. 5.2.5 Sandpiper Pumps (US)
        1. 5.2.5.1 Financial Overview
        2. 5.2.5.2 Products Offered
        3. 5.2.5.3 Key Developments
        4. 5.2.5.4 SWOT Analysis
        5. 5.2.5.5 Key Strategies
      6. 5.2.6 Binks (US)
        1. 5.2.6.1 Financial Overview
        2. 5.2.6.2 Products Offered
        3. 5.2.6.3 Key Developments
        4. 5.2.6.4 SWOT Analysis
        5. 5.2.6.5 Key Strategies
      7. 5.2.7 Almatec Maschinenbau GmbH (DE)
        1. 5.2.7.1 Financial Overview
        2. 5.2.7.2 Products Offered
        3. 5.2.7.3 Key Developments
        4. 5.2.7.4 SWOT Analysis
        5. 5.2.7.5 Key Strategies
      8. 5.2.8 Versa-Matic Pump Company (US)
        1. 5.2.8.1 Financial Overview
        2. 5.2.8.2 Products Offered
        3. 5.2.8.3 Key Developments
        4. 5.2.8.4 SWOT Analysis
        5. 5.2.8.5 Key Strategies
      9. 5.2.9 Parker Hannifin Corporation (US)
        1. 5.2.9.1 Financial Overview
        2. 5.2.9.2 Products Offered
        3. 5.2.9.3 Key Developments
        4. 5.2.9.4 SWOT Analysis
        5. 5.2.9.5 Key Strategies
    3. 5.3 Appendix
      1. 5.3.1 References
      2. 5.3.2 Related Reports
  6. 6 LIST OF FIGURES
    1. 6.1 MARKET SYNOPSIS
    2. 6.2 US MARKET ANALYSIS BY VALVE TYPE
    3. 6.3 US MARKET ANALYSIS BY MATERIAL
    4. 6.4 US MARKET ANALYSIS BY PRESSURE
    5. 6.5 US MARKET ANALYSIS BY INDUSTRY
    6. 6.6 KEY BUYING CRITERIA OF INDUSTRIAL AUTOMATION & EQUIPMENT
    7. 6.7 RESEARCH PROCESS OF MRFR
    8. 6.8 DRO ANALYSIS OF INDUSTRIAL AUTOMATION & EQUIPMENT
    9. 6.9 DRIVERS IMPACT ANALYSIS: INDUSTRIAL AUTOMATION & EQUIPMENT
    10. 6.10 RESTRAINTS IMPACT ANALYSIS: INDUSTRIAL AUTOMATION & EQUIPMENT
    11. 6.11 SUPPLY / VALUE CHAIN: INDUSTRIAL AUTOMATION & EQUIPMENT
    12. 6.12 INDUSTRIAL AUTOMATION & EQUIPMENT, BY VALVE TYPE, 2024 (% SHARE)
    13. 6.13 INDUSTRIAL AUTOMATION & EQUIPMENT, BY VALVE TYPE, 2024 TO 2035 (USD Million)
    14. 6.14 INDUSTRIAL AUTOMATION & EQUIPMENT, BY MATERIAL, 2024 (% SHARE)
    15. 6.15 INDUSTRIAL AUTOMATION & EQUIPMENT, BY MATERIAL, 2024 TO 2035 (USD Million)
    16. 6.16 INDUSTRIAL AUTOMATION & EQUIPMENT, BY PRESSURE, 2024 (% SHARE)
    17. 6.17 INDUSTRIAL AUTOMATION & EQUIPMENT, BY PRESSURE, 2024 TO 2035 (USD Million)
    18. 6.18 INDUSTRIAL AUTOMATION & EQUIPMENT, BY INDUSTRY, 2024 (% SHARE)
    19. 6.19 INDUSTRIAL AUTOMATION & EQUIPMENT, BY INDUSTRY, 2024 TO 2035 (USD Million)
    20. 6.20 BENCHMARKING OF MAJOR COMPETITORS
  7. 7 LIST OF TABLES
    1. 7.1 LIST OF ASSUMPTIONS
  8. 7.1.1
    1. 7.2 US MARKET SIZE ESTIMATES; FORECAST
      1. 7.2.1 BY VALVE TYPE, 2025-2035 (USD Million)
      2. 7.2.2 BY MATERIAL, 2025-2035 (USD Million)
      3. 7.2.3 BY PRESSURE, 2025-2035 (USD Million)
      4. 7.2.4 BY INDUSTRY, 2025-2035 (USD Million)
    2. 7.3 PRODUCT LAUNCH/PRODUCT DEVELOPMENT/APPROVAL
  9. 7.3.1
    1. 7.4 ACQUISITION/PARTNERSHIP
  10. 7.4.1

US Industrial Automation & Equipment Market Segmentation

Industrial Automation & Equipment By Valve Type (USD Million, 2025-2035)

  • Ball Valve
  • Flap Valve

Industrial Automation & Equipment By Material (USD Million, 2025-2035)

  • Aluminum
  • Stainless Steel
  • Cast Iron

Industrial Automation & Equipment By Pressure (USD Million, 2025-2035)

  • Up to 5 bar
  • 5 bar - 10 bar
  • Above 10 bar

Industrial Automation & Equipment By Industry (USD Million, 2025-2035)

  • Food & Beverage
  • Pharmaceutical
  • Chemical
  • Water & Wastewater
  • Oil & Gas
  • Paper & Pulp
  • Electronics
  • Marine