US Bio process Technology Market Segmentation
US Bio process Technology Market By Application (USD Billion, 2025-2035)
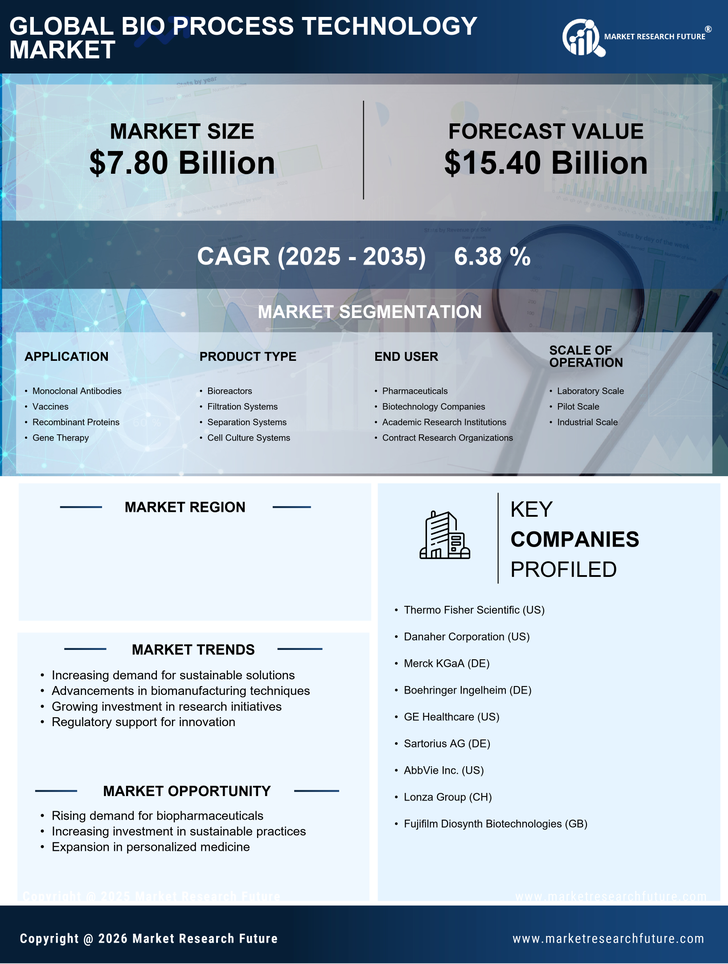
- Monoclonal Antibodies
- Vaccines
- Recombinant Proteins
- Gene Therapy
US Bio process Technology Market By Product Type (USD Billion, 2025-2035)
- Bioreactors
- Filtration Systems
- Separation Systems
- Cell Culture Systems
US Bio process Technology Market By End User (USD Billion, 2025-2035)
- US Bio process Technology Markets
- Biotechnology Companies
- Academic Research Institutions
- Contract Research Organizations
US Bio process Technology Market By Scale of Operation (USD Billion, 2025-2035)
- Laboratory Scale
- Pilot Scale
- Industrial Scale