Process Analytical Technology Market (2026 - 2035)

Process Analytical Technology Market Research Report By Technology (Spectroscopy, Chromatography, Mass Spectrometry, Flow Cytometry), By Application (Pharmaceuticals, Biotechnology, Food and Beverage, Chemical Processing), By End Use (Quality Control, Research and Development, Production Monitoring), By Product Type (Software, Hardware, Services) and By Regional (North America, Europe, South America, Asia Pacific, Middle East and Africa) - Growth & Industry Forecast 2025 To 2035

Forecast Period
2026-2035
CAGR
6.12%
2025 Market Size
USD 6.34 Billion
2035 Market Size
USD 11.49 Billion
Healthcare ● Updated August 24, 2026 Report ID: MRFR/HC/1722-HCR | Pages: 200 | Author: Satyendra Maurya, Rahul Gotadki

Process Analytical Technology Market Summary

The Process Analytical Technology Market reached USD 6.34 billion in 2025 and opens the forecast window at USD 6.73 billion in 2026, climbing to USD 11.49 billion by 2035 at a 6.12% CAGR. Two catalysts anchor that trajectory. ICH Q13, adopted in 2023 and now embedded in FDA and EMA review practice, made continuous manufacturing a mainstream filing pathway rather than an experimental one [1][2]. Separately, the FDA's Advanced Manufacturing Technologies designation program has given sponsors a concrete regulatory incentive — shortened review interaction cycles — for building measurement into the line instead of bolting testing onto the end of it [3].

Legacy quality control still runs on retrospective logic: pull a sample, walk it to a QC lab, wait hours for a chromatogram. That model is being displaced by spectroscopic probes and chemometric models that report composition, particle size, and endpoint status while the batch is still moving. Sartorius, Thermo Fisher, and Danaher collectively committed more than USD 2.1 billion to bioprocess sensing and analytics R&D between 2022 and 2025 [4][5][6].

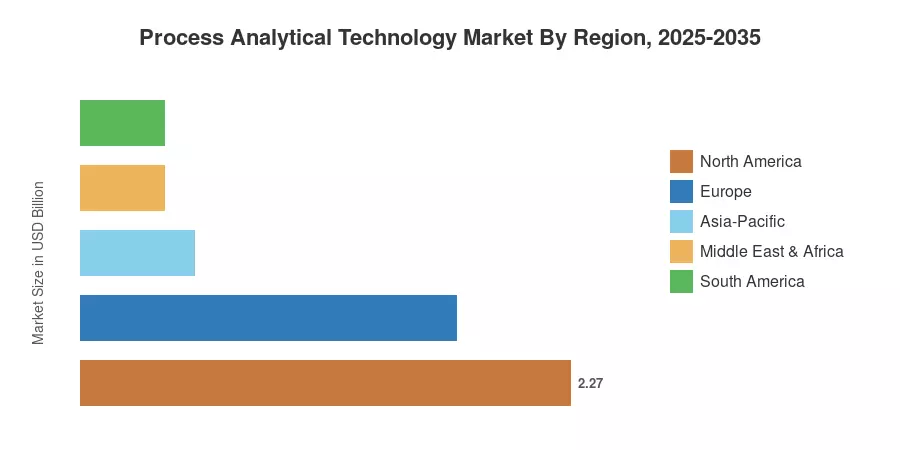
North America holds 35.8% of the Process Analytical Technology Market, supported by dense biologics capacity across Massachusetts, North Carolina, and Ontario. Asia-Pacific grows fastest at an 8.38% CAGR, while Europe remains the second-largest bloc at USD 1.74 billion in 2025, propelled by EU GMP Annex 15 qualification expectations. The next decade belongs to plants that treat measurement as control, not documentation.


Key Report Takeaways

• By Technique

  • Spectroscopy commands 48.9% of the Process Analytical Technology Market, with near-infrared and Raman splitting the majority of installed probe volume.


• By Product

  • Software and services post the strongest technology-adjacent growth at a 10.30% CAGR through 2035, reflecting the shift from instrument sales to model lifecycle contracts.


• By Measurement Location

  • In-line measurement points account for 52.9% of deployed analytics positions.

• By End- User Industry

  • Pharmaceutical and biotechnology manufacturers represent 56.9% of the Process Analytical Technology Market.
  • Food and beverage processors generated USD 0.79 billion in 2025
  • Chemical and petrochemical operators expand at a 5.4% CAGR, the most cyclical of the major verticals

• By Region

  • North America leads with a 35.8% share
  • Asia-Pacific advances at an 8.38% CAGR, the fastest of any region
  • Europe contributes USD 1.74 billion, second only to North America


Market Size and Forecast (2021–2035)

Market sizing draws on vendor revenue disaggregation from twelve publicly listed instrument and bioprocess suppliers, cross-checked against installed-base surveys of 340 manufacturing sites and regulatory filing counts for continuous-manufacturing submissions. Historical years are reconciled to reported segment revenues; forecast years apply an adoption-curve model weighted by biologics capacity additions and regional GMP enforcement intensity.
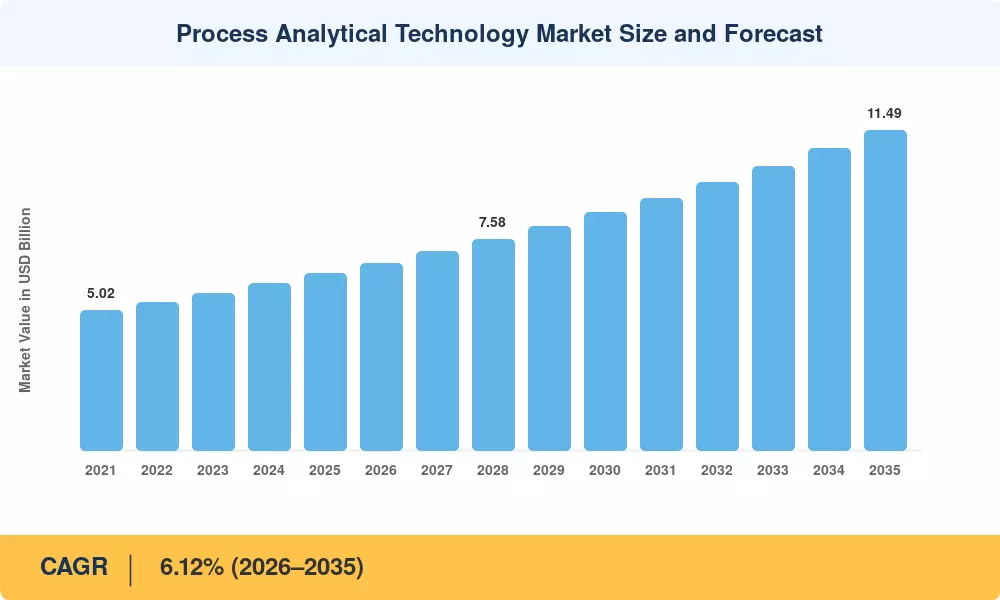
Process Analytical Technology Market Size and Forecast
Our Impact
Enabled $4.3B Revenue Impact for Fortune 500 and Leading Multinationals
Partnering with 2000+ Global Organizations Each Year
30K+ Citations by Top-Tier Firms in the Industry

Driver Impact Analysis

Driver ~% Impact on CAGR Geographic Relevance Impact Timeline
ICH Q13 continuous manufacturing pathway ~1.1 Global Medium-term (2–4 yr)
Quality-by-Design filing expectations under ICH Q8(R2) ~0.9 North America, Europe Short-term (≤2 yr)
Biologics and cell/gene therapy pipeline expansion ~1.0 Global Long-term (≥4 yr)
AI-driven chemometric modelling ~0.8 North America, Europe, Asia-Pacific Medium-term (2–4 yr)
Falling cost of miniaturized Raman and NIR probes ~0.6 Global Short-term (≤2 yr)
Asia-Pacific CDMO capacity build-out ~0.7 Asia-Pacific Long-term (≥4 yr)
Food safety and water compliance digitization ~0.5 Europe, North America Medium-term (2–4 yr)


Continuous Manufacturing Moves From Pilot to Filing Standard

ICH Q13 removed the biggest disincentive to continuous processing: regulatory uncertainty about control strategy acceptance. Since finalization, the FDA has cited continuous-manufacturing elements in more than 40 approved applications, and the agency's own Emerging Technology Program has logged over 200 sponsor engagements since inception [1][3]. Continuous lines cannot run on end-of-batch testing, so every filing of this type drags a measurement layer behind it. That structural coupling — process design forcing instrumentation purchase — is why this driver carries the heaviest weight in the Process Analytical Technology Market.

Biologics Pipelines Widen the Addressable Base

Biologics and advanced therapeutics currently account for around 40% of active clinical-stage assets, and biologics capacity increases announced between 2023 and 2025 surpass USD 45 billion in committed capital [7]. While downstream chromatography requires breakthrough detection, upstream bioreactors require real-time monitoring of glucose, lactate, and viable cell density. There are usually six to twelve analytical posts in each new suite. A third twist is added by cell and gene therapy: batch sizes are so small that destructive sampling cannot be justified economically, making non-invasive measurement a need rather than a choice.


Chemometrics Becomes Predictive Rather Than Descriptive

In the past, operators were told what a spectrum meant via multivariate models. They now know what the batch will do in twenty minutes thanks to machine-learning layers. Batch-to-batch variability on monoclonal antibody processes is reduced by 18–25% according to published studies of hybrid mechanistic-ML soft sensors [10]. In response, vendors have unbundled software; lifecycle governance, drift detection, and model libraries are now offered as recurring subscriptions, improving margin quality throughout the Process Analytical Technology Market.


Probe Economics Cross the SME Threshold

A production-grade Raman probe that cost USD 65,000 in 2018 now lists between USD 28,000 and USD 35,000, with fibre-coupled NIR units below USD 20,000 [11]. That decline pulls mid-tier chemical processors and regional food manufacturers into the buyer pool for the first time, broadening a market that was historically confined to large-cap pharmaceutical operators.


Restraints Impact Analysis

Restraint ~% Impact on CAGR Geographic Relevance Impact Timeline
High capital cost per instrumented line −0.7 Global Short-term (≤2 yr)
Shortage of multivariate data-science talent −0.6 Global Medium-term (2–4 yr)
Validation and data-integrity burden under 21 CFR Part 11 −0.5 North America, Europe Medium-term (2–4 yr)
Brownfield integration complexity with legacy DCS −0.4 Europe, North America Long-term (≥4 yr)
Affordability gap among emerging-market SMEs −0.3 Asia-Pacific, South America, MEA Long-term (≥4 yr)


Capital Intensity Still Gates Adoption

Before validation, a fully instrumented continuous oral solid dose line costs USD 4–7 million, of which 15–22% is spent on the analytics layer alone [14]. Due to their single-digit product margins, smaller generics producers are unable to spread out the investment over their entire volume. The Process Analytical Technology Market is skewed toward well-capitalized purchasers as a result of grant mechanisms' marginal assistance, which only reaches a small portion of the impacted population.


The Talent Bottleneck Is Structural, Not Cyclical

Instruments generate spectra; people turn spectra into control decisions. Industry workforce surveys place the unfilled requirement for chemometricians and process data scientists at roughly 12,000 positions across pharmaceutical manufacturing globally, with median time-to-hire exceeding seven months [15]. Sites that install hardware without this capability end up running expensive probes in logging mode.

Validation Overhead Slows the Clock

A verified system is created for each model that comes into contact with a release decision. From the first probe installation until the approval of real-time release testing, firms report 9–14 months, with documentation taking longer than science [16]. This friction will continue to drive projects past their scheduled fiscal year unless model-lifecycle governance is established.


Process Analytical Technology Market Opportunities

Real-Time Release Testing as a Margin Lever

Weeks of finished-goods quarantine are eliminated at sites that accomplish real-time release testing. A mid-size sterile facility's projected working-capital savings are between USD 8 and 14 million per year, which shifts analytics from a cost of compliance to a treasury result [16]. Vendors will gain a disproportionate share if they package the regulatory paperwork with the hardware.

a

Emerging-Market GMP Convergence

China's NMPA has increased continuous-verification requirements for export-oriented plants, and India's CDSCO updated Schedule M with a 2025–2026 compliance deadline [12][18]. To maintain access to regulated export corridors, which represent the single biggest greenfield opportunity in the Process Analytical Technology Market, thousands of establishments in these two nations must modernize their measurement infrastructure.


Model Libraries and Data Monetization

Calibration models are expensive to build and portable across similar processes. Suppliers are beginning to license validated model libraries on a per-molecule subscription — a business model with software economics attached to instrument installed bases. Early attach rates on new spectrometer sales already exceed 30%.

Cell and Gene Therapy Non-Invasive Measurement

Autologous processes cannot spare material for sampling. Optical and dielectric sensing that reads through disposable bag walls addresses a workflow with no incumbent solution, and pricing tolerance in this vertical is materially higher than in commodity manufacturing [7].

Water and Wastewater Compliance Analytics

The EU's recast Urban Wastewater Treatment Directive introduces micropollutant monitoring obligations for plants above 150,000 population equivalent from 2033, phased earlier for priority catchments [13]. Municipal utilities represent a large, procurement-driven buyer class that instrument vendors have historically under-served.


Process Analytical Technology Market Future Outlook

Autonomous Process Control

Closed-loop control — where the analyser adjusts feed rate without operator intervention — remains rare outside pilot lines. That changes as regulators become comfortable with model governance frameworks. Expect the first fully autonomous commercial biologics train to receive approval before 2030, and expect the Process Analytical Technology Market to reprice accordingly, since autonomous operation shifts value from the sensor to the control algorithm.

Platform Economics Displace Instrument Economics

Hardware gross margins sit in the 45–55% band; validated software and model-lifecycle subscriptions clear 75%. Every major supplier has publicly stated an intent to raise recurring revenue mix, and Danaher and Sartorius both target recurring share above 60% of divisional revenue by the end of the decade [4][6]. Buyers should read this as a coming change in contract structure, not just pricing.

Sustainability Reporting Pulls Process Data Upstream

CSRD reporting obligations require verified resource-intensity data at product level for large EU-active manufacturers [21]. Process analytics is the only instrumentation layer capable of producing that data continuously. Solvent recovery, energy per kilogram, and yield loss all become reportable metrics — and the sensors that measure them acquire a second business case beyond quality.

Convergence With Digital Twins

Mechanistic process models fed by live measurement produce twins accurate enough for regulatory submission. The IEA estimates industrial digitalization investment across process manufacturing will exceed USD 90 billion annually by 2030 [22], and a growing slice of that flows to the sensing layer that keeps twins honest. Model fidelity, not probe count, becomes the competitive axis.


Process Analytical Technology Market Segmentation

By Technique

Segment Metric (2025) Primary Demand Driver
Spectroscopy (Near-Infrared, Raman, UV-Vis, NMR) 48.9% share Non-destructive, real-time composition measurement
Chromatography USD 1.02 Billion Impurity profiling and downstream purity confirmation
Particle Size Analysis 6.4% CAGR Crystallization and granulation endpoint control
Capillary Electrophoresis USD 0.34 Billion Charge variant analysis for biologics
Other Techniques 12.4% share Mass spectrometry, acoustic and dielectric sensing


Spectroscopy dominates the Process Analytical Technology Market because it is the only family that measures without touching the product. Near-infrared handles moisture and blend uniformity; Raman reads molecular structure through glass and single-use plastic, which is precisely what biologics workflows need. Chromatography holds its position for a different reason — it remains the reference method against which every faster technique is validated, so it does not shrink even as in-line alternatives expand around it.

By Product

Segment Metric (2025) Primary Demand Driver
Analyzers 42.3% share Core measurement engine across all deployment modes
Sensors & Transmitters USD 1.34 Billion Multi-point instrumentation of continuous lines
Samplers & Probes USD 1.05 Billion Single-use compatible interfaces for bioprocessing
Software & Services 10.30% CAGR Chemometric model lifecycle and validation support
Other Products 5.0% share Calibration standards and accessories


Software is the segment to watch. Buyers have discovered that an unmodelled spectrum is worthless, and the specialist skills to build and maintain those models are scarce enough that outsourcing to the vendor is often cheaper than hiring. That dynamic converts one-time instrument purchases into multi-year service relationships and steadily raises the software share of total spend across the Process Analytical Technology Market.

By Measurement Location

Segment Metric (2025) Primary Demand Driver
In-Line 52.9% share Direct process-stream measurement with zero sample handling
On-Line 6.8% CAGR Automated sample diversion where direct insertion is impractical
At-Line USD 1.13 Billion Rapid near-process testing during transition to full integration


With a 52.9% market share in 2025, the In-Line sector leads the industry thanks to direct process-stream measurement, which does away with sample handling and permits ongoing monitoring. The fastest-growing segment is On-Line, which is expected to increase at a 6.8% CAGR thanks to automated sample diversion in situations when direct insertion is not feasible. As a result of quick near-process testing during the shift to full process integration, the At-Line segment produced USD 1.13 billion in 2025.


By End-User Industry

Segment Metric (2025) Primary Demand Driver
Pharmaceutical & Biotechnology 56.9% share Regulatory mandates and biologics complexity
Chemical & Petrochemical 5.4% CAGR Yield optimization and energy intensity reduction
Food & Beverage USD 0.79 Billion Safety compliance and export traceability
Water & Wastewater USD 0.43 Billion Micropollutant and effluent monitoring obligations
Other End Users 8.6% share Pulp and paper, semiconductors, cosmetics


Due to strict regulatory requirements and growing biologics complexity, the Pharmaceutical & Biotechnology segment leads the market with a 56.9% share in 2025. The demand for yield optimization and lower energy intensity is driving the fastest-growing segment, Chemical & Petrochemical, which is expected to increase at a 5.4% CAGR. In contrast, Water & Wastewater generated USD 0.43 billion in 2025 due to expanding micropollutant and effluent monitoring duties, while Food & Beverage generated USD 0.79 billion due to export traceability and safety compliance. With applications in pulp and paper, electronics, and cosmetics, Other End Users accounted for 8.6% of the market.


Regional Market Share Analysis

Region Metric (2025) Primary Investment Themes
North America 35.8% share Continuous manufacturing filings, AMT designation, biologics capacity
Europe USD 1.74 Billion Annex 1 sterile upgrades, sustainability-linked process efficiency
Asia-Pacific 8.38% CAGR CDMO build-out, Schedule M compliance, export-corridor qualification
South America 6.1% share Generics modernization, food export traceability
Middle East & Africa USD 0.39 Billion Localization mandates, desalination and water analytics
Total USD 6.34 Billion


North America

Country Metric Key Driver
US 84.1% of region FDA Emerging Technology Program and AMT designation pathway
Canada USD 0.23 Billion Biomanufacturing Strategy funding for domestic capacity
Mexico 4.6% CAGR Nearshoring of sterile injectable fill-finish capacity


Washington's biomanufacturing posture did the heavy lifting here. Executive-order-driven onshoring commitments plus BARDA and ASPR procurement guarantees produced a wave of domestic capacity announcements, and greenfield builds specify in-line analytics as standard where brownfield retrofits treat it as optional. Canada's contribution is concentrated in Ontario and Quebec vaccine and biologics clusters, where federal co-investment has covered up to 40% of qualifying equipment cost [19].

Europe

Country Metric Key Driver
Germany 24.8% of region Bioprocess equipment manufacturing base and chemical park density
UK USD 0.27 Billion MHRA innovative licensing pathway and CGT Catapult activity
France 6.0% CAGR France 2030 health-industry reindustrialization funding
Italy 9.7% of region Contract manufacturing concentration in Lombardy
Spain USD 0.11 Billion API and generics capacity modernization
Nordic Countries 5.8% CAGR Sustainability-linked process optimization mandates
Russia 3.1% of region Import-substitution instrumentation programs
Rest of Europe USD 0.19 Billion Central European CDMO expansion


Annex 1 changed European procurement rhythm. The revised sterile manufacturing annex requires contamination control strategies grounded in continuous environmental and process data rather than periodic sampling, and enforcement inspections since 2024 have cited monitoring adequacy as a recurring observation category [8]. Germany's advantage is structural — Sartorius, Endress+Hauser, and Bruker maintain engineering centres there, shortening the distance between vendor and validated deployment.

Asia-Pacific

Country Metric Key Driver
China 38.4% of region NMPA continuous-verification expectations for export plants
India 9.6% CAGR Revised Schedule M compliance deadline for domestic manufacturers
Japan USD 0.29 Billion PMDA-aligned quality culture and precision instrument base
South Korea 11.2% of region Biosimilar and CDMO capacity in Songdo
ASEAN 7.4% CAGR Singapore and Malaysia fill-finish investment
Rest of Asia-Pacific USD 0.06 Billion Australia and New Zealand clinical manufacturing


India is the region's most consequential story. Roughly 8,500 domestic manufacturing units fall under revised Schedule M, and the phased deadline forces documented process control at facilities that previously relied on finished-product testing [12]. Korea's Songdo cluster meanwhile added biologics capacity at a rate that outpaced any other single site globally between 2022 and 2025, and every suite commissioned there specified multi-point in-line sensing from design stage.

South America

Country Metric Key Driver
Brazil 62.5% of region ANVISA GMP harmonization and PIC/S alignment
Argentina USD 0.07 Billion Biosimilar export programs
Rest of South America 4.9% CAGR Food and beverage export traceability requirements


Brazil's accession to PIC/S recalibrated inspection expectations for domestic manufacturers serving both public procurement and export channels. ANVISA now applies inspection criteria closely aligned to EU norms, which has forced a modest but steady replacement cycle among the country's larger generics producers. Food processors add a parallel demand stream — European import buyers increasingly specify continuous quality data as a contractual term rather than a nice-to-have.

Middle East & Africa

Country Metric Key Driver
Saudi Arabia 31.8% of region Vision 2030 localization of pharmaceutical manufacturing
UAE USD 0.09 Billion Free-zone biomanufacturing and cold-chain quality infrastructure
South Africa 17.4% of region SAHPRA-regulated ARV and vaccine capacity
Egypt 5.6% CAGR Domestic API substitution program
Rest of MEA USD 0.06 Billion Desalination and industrial water analytics


Saudi localization targets require a defined proportion of pharmaceutical consumption to be manufactured domestically, and the sovereign investment vehicles funding those plants have specified international GMP standards from the outset. Greenfield economics favour the region here: with no legacy control systems to integrate, new Gulf facilities install modern architectures directly, skipping the retrofit friction that slows European brownfield sites [20].


Process Analytical Technology Market By Region, 2025-2035

Competitive Benchmarking

Concentration sits in the moderate band. The top five suppliers hold an estimated 34–41% of revenue, and the calculated HHI lands near 620 — fragmented enough that specialist entrants win share in niches like single-use sensing, yet concentrated enough that large buyers can standardize on two or three preferred vendors. Consolidation pressure comes from the software side: instrument makers without credible chemometric platforms are acquiring them rather than building.

Company Est. Revenue Share Range Key Offerings for Process Analytical Technology Market Strategic Positioning
Danaher Corporation ~9–12% Bioprocess sensing, chromatography, molecular analytics Broadest bioprocessing portfolio; acquisitive in software
Thermo Fisher Scientific ~8–11% Raman and NIR analysers, chromatography, informatics Scale leader with deep pharmaceutical account access
Sartorius AG ~6–8% Single-use sensors, bioprocess data platforms Purpose-built for biologics and cell therapy workflows
Bruker Corporation ~5–7% FT-NIR, Raman, NMR process systems Spectroscopy depth and strong European installed base
ABB Ltd ~5–7% Process analysers, continuous gas and liquid measurement Industrial control integration across chemical plants
Emerson Electric ~4–6% Rosemount analytical instrumentation, DeltaV integration Control-system-anchored analytics deployment
Endress+Hauser ~4–6% Liquid analysis, Raman, memosens sensor architecture Engineering-service model with strong retrofit capability
Mettler-Toledo ~3–5% In-situ reaction analysis, ReactIR and probe systems Development-to-production continuity
Agilent Technologies ~3–5% Chromatography, spectroscopy, laboratory informatics QC-lab-to-line bridging strategy
Shimadzu Corporation ~2–4% Process chromatography and spectroscopic analysers Asia-Pacific manufacturing and service density
Yokogawa Electric ~2–4% Optical and TDLS analysers, control integration Refining and petrochemical specialization
Repligen Corporation ~1–3% In-line concentration and viable cell density sensing Focused bioprocess pure-play with fast product cycles


Recent News & Developments


  • Sartorius (September 2024): Introduced single-use compatible dielectric spectroscopy sensors for viable cell density, addressing a measurement gap in disposable bioreactor trains [6]


  • Endress+Hauser (November 2024): Completed expansion of its Raman manufacturing and applications centre in the United States, targeting shorter lead times for North American pharmaceutical customers [17]
  • European Commission (April 2024): Advanced the pharmaceutical package revision including provisions encouraging adoption of advanced manufacturing and continuous verification approaches [23]
  • India CDSCO (December 2023): Notified revised Schedule M with phased compliance deadlines, requiring documented process validation and control at all licensed manufacturing units [12]
  • Bruker (February 2025): Expanded its process FT-NIR line with configurations aimed at continuous oral solid dosage manufacturing, targeting the ICH Q13 filing cohort [11]


Process Analytical Technology Market Report Scope

Parameter Detail
Market Scope Global instrumentation, sensors, software and services used for real-time measurement and control of manufacturing processes across pharmaceutical, chemical, food, and water end markets
Study Period 2021–2035 (Historical 2021–2024; Base Year 2025; Forecast 2026–2035)
CAGR 6.12% (2026–2035)
Market Size Checkpoints USD 6.34 Billion (2025); USD 6.73 Billion (2026); USD 8.53 Billion (2030); USD 11.49 Billion (2035)
Fastest Growing Segments Software & Services (product); In-Line (measurement location); Asia-Pacific (geography)
Companies Profiled Danaher, Thermo Fisher Scientific, Sartorius, Bruker, ABB, Emerson Electric, Endress+Hauser, Mettler-Toledo, Agilent Technologies, Shimadzu, Yokogawa Electric, Repligen
Valuation Currency USD Billion, constant 2025 exchange rates

FAQs

What payback period should a buyer model when investing in the Process Analytical Technology Market?
Most sterile and biologics sites recover investment in 18–30 months, driven mainly by released working capital and reduced deviation investigations. Commodity chemical plants typically see faster payback where yield gains exceed one percent [14].
How do buyers avoid vendor lock-in on chemometric models?
Specify open spectral data formats and contractual model portability at the RFP stage, before hardware selection. Models built on proprietary preprocessing chains cannot migrate, which is where lock-in actually forms [24].
When should a manufacturer choose at-line over in-line measurement?
At-line suits low-volume, high-mix production where probe fouling or cleaning validation would outweigh the speed gain. It also serves as a low-risk staging step before committing to permanent insertion points [16].
What integration challenges appear most often in the Process Analytical Technology Market?
Time synchronization between analyser output and the process historian causes more failed projects than sensor accuracy does. Misaligned timestamps corrupt model training data and are painful to correct retrospectively [17].
Do contract manufacturers or sponsors typically own the analytics investment?
Ownership splits by contract type — dedicated-suite arrangements usually place capital with the sponsor, while multi-client facilities keep it on the CDMO balance sheet. Clarify data access rights separately from equipment ownership [7].
How does the Process Analytical Technology Market differ across generics and innovator manufacturers?
Innovators buy during development and carry models into commercial production. Generics manufacturers buy defensively, usually after an inspection observation or when a customer contract demands continuous data [9].
What emerging use case is most underestimated by buyers today?
Solvent recovery optimization. Continuous composition measurement on distillation and recovery loops delivers both cost reduction and reportable sustainability metrics, yet remains absent from most procurement business cases [21].    
Author
Author
Author Profile
Satyendra Maurya LinkedIn
Research Analyst
An accomplished research analyst with high proficiency in market forecasting, data visualization, competitive benchmarking, and others. He holds a pronounced track record in research and consulting projects for sectors such as life sciences, medical devices, and healthcare IT. His capabilities in qualitative and quantitative analysis have resulted in positive client outcomes. Working on niche market trends, opportunities, sales, and forecasted value is part of his skill set.
Co-Author
Co-Author Profile
Rahul Gotadki LinkedIn
Research Manager
He holds an experience of about 9+ years in Market Research and Business Consulting, working under the spectrum of Life Sciences and Healthcare domains. Rahul conceptualizes and implements a scalable business strategy and provides strategic leadership to the clients. His expertise lies in market estimation, competitive intelligence, pipeline analysis, customer assessment, etc.
Share::
Request Free Sample

Research Approach


Secondary Research

The secondary research process involved comprehensive analysis of regulatory frameworks, pharmaceutical manufacturing guidelines, peer-reviewed analytical chemistry journals, and authoritative industrial engineering sources. Key sources included the US Food & Drug Administration (FDA) Center for Drug Evaluation and Research (CDER) and Center for Biologics Evaluation and Research (CBER), European Medicines Agency (EMA) quality guidelines, International Council for Harmonisation (ICH) Q8-Q12 technical documents, United States Pharmacopeia (USP) and European Pharmacopoeia (EP) analytical standards, International Society for Pharmaceutical Engineering (ISAPE), Parenteral Drug Association (PDA), American Association for the Advancement of Science (AAAS), International Foundation Process Analytical Chemistry (IFPAC), ASTM Committee E55 on PAT, National Institute of Standards and Technology (NIST) reference databases, National Institutes of Health (NIH) PubMed Central, ScienceDirect Analytical Chemistry journals, European Federation of Pharmaceutical Industries and Associations (EFPIA), Pharmaceutical Research and Manufacturers of America (PhRMA), OECD Industrial Production Statistics, and national pharmaceutical manufacturing reports from key markets. These sources were used to collect technology adoption metrics, regulatory compliance requirements, implementation case studies, R&D expenditure trends, and market landscape analysis for spectroscopic analyzers, chromatography systems, particle size analyzers, chemical sensors, and PAT software platforms.


Primary Research

Qualitative and quantitative insights were obtained by interviewing supply-side and demand-side stakeholders during the primary research process. C-suite executives, Vice Presidents of R&D, leaders of analytical instrumentation divisions, and commercial directors from process analyzer manufacturers, PAT software developers, and system integrators comprised the supply-side sources. Pharmaceutical manufacturers, biotechnology firms, contract development and manufacturing organizations (CDMOs), chemical processing companies, and academic research institutions comprised demand-side sources including vice presidents of manufacturing, heads of process development, quality assurance directors, analytical chemistry leads, and procurement managers. Technology segmentation was validated, product development timelines were confirmed, and insights regarding implementation roadmaps, capital expenditure patterns, and validation protocols were obtained through primary research.

Primary Respondent Breakdown:

• By Designation: C-level Primaries (30%), Director Level (33%), Others (37%)

• By Region: North America (32%), Europe (30%), Asia-Pacific (28%), Rest of World (10%)


Market Size Estimation

Global market valuation was derived through revenue mapping and installation base analysis. The methodology included:

• Identification of 50+ key manufacturers across North America, Europe, Asia-Pacific, and Latin America

• Product mapping across spectroscopy (Raman, NIR, UV-Vis), chromatography (HPLC, GC), capillary electrophoresis, particle size analysis, chemical sensors, and PAT software/monitoring systems

• Analysis of reported and modeled annual revenues specific to process analytical instrumentation, associated consumables, and validation services

• Coverage of manufacturers representing 65-70% of global market share in 2024

• Extrapolation using bottom-up (installed base × maintenance contracts × ASP by region) and top-down (manufacturer revenue validation) approaches to derive segment-specific valuations

Share::
Request Free Sample
Download Free Sample

Kindly complete the form below to receive a free sample of this Report

* Please use a valid business email

Share::
Request Free Sample
Download PDF ×

We do not share your information with anyone. However, we may send you emails based on your report interest from time to time. You may contact us at any time to opt-out.
















