Life Science & Analytical Instruments Market (2026 - 2035)

Life Science & Analytical Instruments Market Research Report Information By Type (Microscopy, Chromatography, Cell Counting, Spectroscopy, PCR, Electrophoresis, Flow Cytometry, Centrifuges, Next-Generation Sequencing, Others), By Application (Clinical and Diagnostics Applications, Research Applications, Others), By End User (Pharmaceutical and Biotechnology Companies, Hospitals and Diagnostic Laboratories, Others) And By Region (North America, Europe, Asia-Pacific, And Rest Of The World) –Market Forecast Till 2035
ID: MRFR/LS/0329-CR
78 Pages
Rahul Gotadki, Snehal Singh
Last Updated: July 06, 2026
Life Science & Analytical Instruments Market
Market Size
Forecast Period2026-2035
CAGR (2026-2035)8.15%
2025 Market SizeUSD 21.68 Billion
2035 Market SizeUSD 47.26 Billion
Key Players
Agilent Technologies
Thermo Fisher Scientific
Waters Corporation
Danaher Corporation
Shimadzu Corporation
Bruker Corporation
Opportunities
  • Multi-Omics Integration Platforms
  • Instrument-as-a-Service Business Models
  • Emerging-Market Regulatory Modernization

Life Science & Analytical Instruments Market Summary

The Life Science and Analytical Instruments Market size was valued at USD 21.68 Billion in 2025, and the market is projected to grow from USD 23.35 Billion in 2026 to USD 47.26 Billion by 2035, registering a CAGR of 8.15% during the forecast period 2026–2035. Accelerating biologics pipelines — the FDA approved 17 novel biological therapies in 2024 alone — and tightening real-time process-analytical-technology (PAT) mandates under ICH Q13 have created sustained demand for high-resolution analytical platforms [1]. Global pharmaceutical R&D spending exceeded USD 265 Billion in 2024, funneling capital directly into instrument procurement cycles [2].

A pronounced technology shift is underway within the Life Science and Analytical Instruments Market. Legacy single-technique benchtop units are giving way to integrated workflow platforms that couple separation science with AI-driven data interpretation. Thermo Fisher's 2024 launch of cloud-connected Orbitrap systems illustrates the trend: instruments now stream analytical data into centralized LIMS environments, cutting method-development timelines by 30–40% according to vendor benchmarks [3]. The European Commission's Horizon Europe program allocated EUR 1.8 Billion to health-research infrastructure between 2024 and 2027, much of it earmarked for next-generation instrumentation [4].

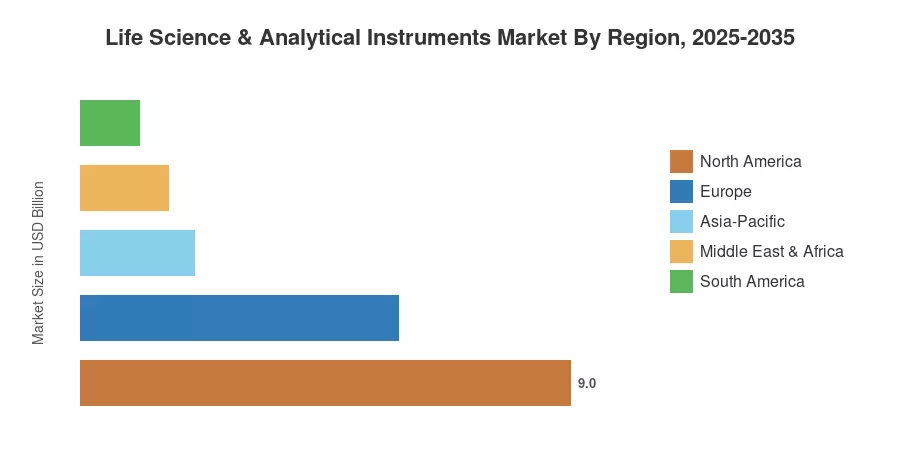
North America commands roughly 41.5% of the Life Science and Analytical Instruments Market, anchored by NIH funding that topped USD 48 Billion in fiscal year 2025 [5]. Asia-Pacific is the fastest-growing region, advancing at a 9.67% CAGR as Chinese and Indian CDMOs standardize high-throughput screening capabilities. Europe holds the second-largest share at approximately 27%, driven by Germany's BioPharma cluster and pan-EU regulatory harmonization. The convergence of precision-medicine programs and continuous-manufacturing adoption positions this market for sustained double-digit instrument refresh cycles through the early 2030s.


Key Report Takeaways

• By Product Type

  • Chromatographs captured 31.2% revenue share of the Life Science and Analytical Instruments Market in 2025, underpinned by continuous-manufacturing validation requirements.
  • Spectrometers are projected to record the fastest segment CAGR of 8.65% through 2035, propelled by multi-omics research expansion.
  • Liquid analyzers generated approximately USD 3.14 Billion in 2025 revenue, reflecting growing inline process-control adoption.

• By End User

  • The pharmaceutical vertical held 63.5% of the Life Science and Analytical Instruments Market in 2025.
  • Biopharmaceutical and nutraceutical applications are expanding at a 9.35% CAGR, the fastest end-user growth trajectory.

• By Region

  • North America contributed 41.5% of global revenue for the Life Science and Analytical Instruments Market in 2025.
  • Asia-Pacific is tracking a 9.67% CAGR, the highest among all regions, fueled by CDMO capacity build-outs.


Life Science and Analytical Instruments Market Size and Forecast (2021–2035)

Market Research Future employs a bottom-up estimation model that aggregates instrument shipment data, vendor revenue disclosures, and end-user procurement surveys across 42 countries. Historical figures (2021–2024) are validated against customs-trade databases and public financial filings; forecast projections (2026–2035) incorporate regression analysis calibrated to R&D expenditure trends, regulatory pipeline activity, and installed-base replacement cycles.
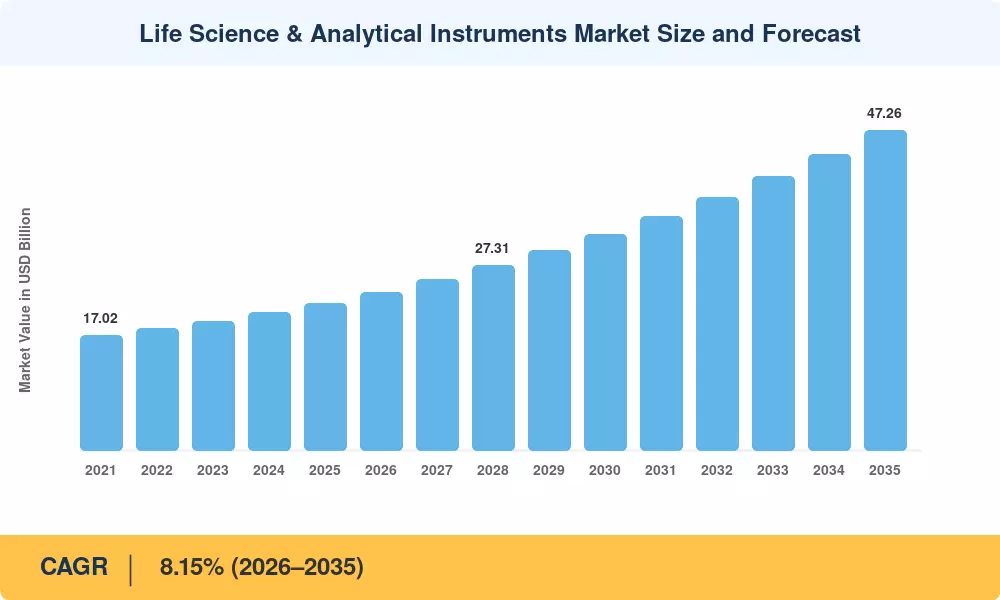
Life Science & Analytical Instruments Market Size and Forecast
Our Impact
Enabled $4.3B Revenue Impact for Fortune 500 and Leading Multinationals
Partnering with 2000+ Global Organizations Each Year
30K+ Citations by Top-Tier Firms in the Industry

Driver Impact Analysis

Driver ~% Impact on CAGR Geographic Relevance Impact Timeline
Biologics & biosimilar pipeline growth ~22% Global Short-term (≤2 yr)
Continuous-manufacturing PAT mandates ~18% North America, Europe Medium-term (2–4 yr)
Precision-medicine & multi-omics programs ~16% North America, APAC Long-term (≥4 yr)
AI-powered analytical data platforms ~14% Global Medium-term (2–4 yr)
CDMO capacity expansion in Asia-Pacific ~12% Asia-Pacific Short-term (≤2 yr)
Regulatory tightening for real-time release testing ~10% Europe, North America Medium-term (2–4 yr)
Rising food-safety and nutraceutical testing ~8% Global Long-term (≥4 yr)


Biologics Pipeline Acceleration

The global biologics pipeline topped 8,500 active candidates in 2024, a 14% growth year-over-year [1]. Every biologic entering Phase II or later requires analytical characterisation employing liquid chromatography–mass spectrometry (LC-MS) procedures, driving recurring instrument demand across the Life Science and Analytical Instruments Market. The FDA's 2024 guidance on cell-therapy IND filings expressly promotes orthogonal analytical methodologies, promoting multi-instrument procurement at sponsor and contract labs [1].


Continuous-Manufacturing Regulatory Push

ICH Q13, finalized in 2023, established harmonized expectations for continuous-manufacturing processes, mandating real-time PAT monitoring across critical quality attributes [7]. Pfizer's continuous-manufacturing facility in Freiburg, Germany — operational since late 2024 — deploys over 40 inline analytical sensors per production line, illustrating the instrument density this paradigm requires. The Life Science and Analytical Instruments Market stands to benefit as legacy batch-process plants retrofit PAT instrumentation to comply with updated inspection protocols [10].

AI-Powered Analytical Platforms

Machine-learning algorithms embedded in chromatography data systems can now auto-select optimal separation conditions, reducing method-development time from weeks to hours [3]. Agilent's OpenLab CDS 2.8 update, released in Q3 2024, integrates predictive retention-time modeling that achieved 97% first-pass accuracy in validation studies. This capability expands addressable use cases for the Life Science and Analytical Instruments Market by lowering the skill barrier for complex assays and enabling smaller labs to perform tier-one analytics [3].

Asia-Pacific CDMO Build-Out

ISPE's 2024 Asia-Pacific report documented over 120 CDMO facility expansions announced across China, India, and South Korea between 2022 and 2024 [9]. Samsung Biologics alone committed USD 5.5 Billion to its Songdo campus expansion, which includes fully instrumented analytical suites. This regional capital cycle directly benefits the Life Science and Analytical Instruments Market, as each new CDMO line requires a full complement of chromatographs, spectrometers, and dissolution analyzers before regulatory qualification.


Restraints Impact Analysis

Restraint ~% Impact on CAGR Geographic Relevance Impact Timeline
High capital cost of advanced instruments ~–20% Emerging markets Long-term (≥4 yr)
Skilled-operator shortage ~–18% Global Medium-term (2–4 yr)
Lengthy regulatory validation cycles ~–15% North America, Europe Medium-term (2–4 yr)
Data-integrity and cybersecurity concerns ~–12% Global Short-term (≤2 yr)
Instrument commoditization pressure ~–10% Asia-Pacific Long-term (≥4 yr)


Capital-Cost Barriers

A high-resolution Orbitrap mass spectrometer bears a list price above USD 800,000, and entire LC-MS/MS suites can approach USD 1.5 Million if software licensing and service contracts are added in [12]. For mid-size pharmaceutical enterprises in Latin America and Africa, these capital barriers force reliance on older-generation equipment, restricting the untapped market within the Life Science and Analytical Instruments Market in those areas. Vendor-financed leasing programs have begun to ease this barrier, although uptake remains uneven.


Skilled-Operator Shortage

The American Chemical Society's 2024 workforce survey indicated that 38% of analytical laboratories reported unfilled instrument-scientist positions for more than six months [13]. University programs have been hesitant to provide operators with the specialized training needed for complex hyphenated techniques like 2D-LC coupled to high-resolution mass spectrometry. In the Life Science and Analytical Instruments Market, especially in academic and governmental contexts, this talent gap slows purchase decisions and limits throughput at current installations.


Regulatory Validation Complexity

Each new instrument model introduced into a GMP environment must undergo Installation Qualification, Operational Qualification, and Performance Qualification — a process that averages 14–18 months for complex platforms [10]. This timeline discourages rapid upgrade cycles and anchors laboratories to incumbent vendor ecosystems, creating friction in the Life Science and Analytical Instruments Market that can slow the adoption of genuinely superior technologies.


Life Science & Analytical Instruments Market Opportunities

Multi-Omics Integration Platforms

Converging genomics, proteomics, and metabolomics datasets onto unified analytical platforms creates a high-value product category within the Life Science and Analytical Instruments Market. Vendors that deliver end-to-end workflows — from sample preparation through AI-assisted data interpretation — can capture premium price points. The NIH's All of Us program, with over 500,000 enrolled participants, is generating demand for precisely this kind of integrated capability [8].

Instrument-as-a-Service Business Models

Subscription-based access to high-end analytical instruments eliminates capital-expenditure barriers, particularly in emerging markets. Waters Corporation piloted its "Connect" leasing program in 2024, bundling hardware, software updates, and remote diagnostics into a per-sample pricing model. If widely adopted, such models could expand the total addressable opportunity of the Life Science and Analytical Instruments Market by pulling cost-sensitive end users into the active customer base.

Emerging-Market Regulatory Modernization

India's CDSCO implemented revised pharmaceutical testing standards in 2024 that align with WHO prequalification requirements, mandating instrumented dissolution and impurity profiling for all generic drug filings [16]. Similar harmonization is underway in Brazil (ANVISA) and Nigeria (NAFDAC). These regulatory upgrades compel local manufacturers to invest in modern analytical infrastructure, unlocking greenfield demand for the Life Science and Analytical Instruments Market across South America, Africa, and Southeast Asia.

Data Monetization and Cloud-Analytics Ecosystems

Instrument vendors are building recurring-revenue streams around cloud-hosted data platforms that aggregate analytical results across enterprise networks. Agilent's CrossLab and Thermo Fisher's Conecta platforms already manage over 100,000 connected instruments globally [3]. The Life Science and Analytical Instruments Market can leverage this installed-base connectivity to generate SaaS revenue layers — predictive maintenance, compliance dashboards, and benchmarking analytics — that decouple growth from hardware shipment cycles.

Point-of-Need and Miniaturized Analytical Devices

Portable Raman and near-infrared spectroscopy devices are moving analytical testing from centralized labs to manufacturing floors, field-research sites, and even point-of-care clinical settings. 908 Devices raised USD 80 Million in its 2024 Series E to scale handheld mass-spectrometry platforms [17]. This miniaturization trend broadens the application envelope of the Life Science and Analytical Instruments Market beyond traditional laboratory walls.


Life Science & Analytical Instruments Market Future Outlook

AI-Autonomous Laboratories

Fully autonomous "self-driving" laboratories — where robotic sample handlers, AI-controlled instruments, and closed-loop optimization algorithms operate with minimal human oversight — represent a paradigm shift for the Life Science and Analytical Instruments Market. MIT's Accelerated Materials Discovery Lab demonstrated 10× throughput gains using autonomous LC-MS workflows in 2024 [3]. By 2030, autonomous analytical systems could constitute 15–20% of new instrument installations in high-throughput pharma environments, reshaping procurement criteria from individual instrument performance toward platform interoperability.

Platform Economics and Ecosystem Lock-In

Instrument vendors are transitioning from discrete-hardware sales toward platform-centric models that bundle consumables, software subscriptions, and service contracts. Danaher's Cytiva division already derives 65% of life-science revenue from recurring streams [15]. This shift will reshape competitive dynamics within the Life Science and Analytical Instruments Market: vendors that build the most integrated ecosystems will command higher customer lifetime values, while single-instrument specialists face margin compression.

Sustainability and Green Chemistry Mandates

The EU's Green Deal and the EPA's updated solvent-management guidelines are pressuring laboratories to adopt lower-waste analytical methods. Supercritical-fluid chromatography (SFC) reduces organic-solvent consumption by up to 80% compared to conventional HPLC, making it attractive for ESG-conscious procurement decisions [19]. The Life Science and Analytical Instruments Market will see growing demand for SFC systems, micro-flow LC, and solvent-recycling accessories as sustainability reporting becomes a laboratory KPI by 2028.

Decentralized and Point-of-Need Analytics

The migration of analytical testing from centralized core facilities to manufacturing floors, clinical wards, and field-deployment scenarios will expand the Life Science and Analytical Instruments Market into new use cases. IEA health-sector projections estimate that decentralized testing endpoints will double between 2025 and 2032 [20]. Miniaturized spectrometry, portable PCR-coupled analytical devices, and paper-based sensor arrays are all enabling categories that will drive volume growth at lower per-unit price points.


Life Science & Analytical Instruments Market Segmentation

By Product Type

Segment Key Metric Primary Demand Driver
Chromatographs (Gas, Liquid, Ion) 31.2% share (2025) Continuous-manufacturing and impurity testing
Spectrometers (Mass, NMR, Optical) 8.65% CAGR Multi-omics and structural-biology research
Liquid Analyzers USD 3.14 Billion (2025) Inline process-analytical technology
Analytical X-Ray & Microscopy 7.40% CAGR Materials characterization in drug-device combos


Chromatographs remain the backbone of the Life Science and Analytical Instruments Market because every pharmaceutical release test, stability study, and bioprocessing quality check depends on separation-based assays. Gas chromatography retains dominance in residual-solvent analysis, while ultra-high-performance liquid chromatography (UHPLC) is gaining share for intact-protein and peptide-mapping workflows. The segment benefits from large installed bases that generate recurring consumable and column revenue.

Spectrometers represent the fastest-expanding product category as high-resolution mass spectrometry becomes essential for proteomic, metabolomic, and lipidomic research programs. Orbitrap and time-of-flight architectures now achieve sub-ppm mass accuracy, enabling single-shot identification of thousands of analytes. Demand is further amplified by structural-biology applications in cryo-EM-adjacent workflows where mass spectrometry provides complementary structural validation for the Life Science and Analytical Instruments Market.

By End User

Segment Key Metric Primary Demand Driver
Pharmaceutical 63.5% share (2025) GMP release testing, stability, impurity profiling
Biopharmaceutical & Nutraceutical 9.35% CAGR Biologics characterization and dietary-supplement QC


The pharmaceutical vertical anchors the Life Science and Analytical Instruments Market with the highest absolute spend, driven by mandatory ICH-compliant analytical methods for every stage of drug development, from discovery screening through post-market surveillance. Large pharma companies typically operate 200–400 analytical instruments per major R&D site, and each instrument undergoes scheduled requalification that ties customers to vendor service programs.

Biopharmaceutical and nutraceutical end users are growing faster because biologics require more complex analytical characterization than small-molecule drugs — a single monoclonal antibody demands 15–20 distinct analytical tests versus 5–8 for a traditional tablet formulation. This analytical intensity directly multiplies instrument procurement within the Life Science and Analytical Instruments Market for contract and in-house biologics laboratories alike.


Regional Market Share Analysis

Region Key Metric Primary Investment Themes
North America 41.5% revenue share (2025) NIH funding, FDA PAT mandates, precision medicine
Europe USD 5.85 Billion (2025) Horizon Europe, pharma harmonization
Asia-Pacific 9.67% CAGR (2026–2035) CDMO expansion, regulatory modernization
South America USD 1.08 Billion (2025) ANVISA alignment, generic-drug testing
Middle East & Africa 7.45% CAGR (2026–2035) Saudi Vision 2030, local-manufacturing mandates
Total USD 21.68 Billion (2025)

The Life Science and Analytical Instruments Market follows a geography-weighted distribution pattern where established R&D ecosystems in North America and Europe account for the majority of current revenue, while Asia-Pacific drives incremental growth through manufacturing-capacity expansion and regulatory catch-up.


North America

Country Key Metric Key Driver
US 78% of regional share NIH and BARDA funding pipelines [5]
Canada CAGR 7.92% National Research Council instrument grants
Mexico USD 0.41 Billion (2025) Nearshoring pharmaceutical manufacturing


The US dominates the Life Science and Analytical Instruments Market in North America thanks to an unmatched density of pharma headquarters, academic medical centers, and FDA-regulated contract laboratories. NIH appropriations reached USD 48.3 Billion in FY 2025, directly funding analytical-instrument acquisitions across 2,500+ extramural research institutions [5]. Canada benefits from the National Research Council's Strategic Innovation Fund, while Mexico is attracting pharma nearshoring investments that require GMP-grade analytical suites.

Europe

Country Key Metric Key Driver
Germany 24% of regional share BioPharma cluster, Fraunhofer infrastructure [4]
UK CAGR 8.05% Life Sciences Vision 2030 initiative
France USD 0.88 Billion (2025) Sanofi and Servier domestic investment
Italy CAGR 7.68% Generics manufacturing modernization
Spain USD 0.42 Billion (2025) Biosimilar production growth
Nordic Countries 8.20% CAGR Academic-research intensity
Russia USD 0.29 Billion (2025) Import-substitution policies
Rest of Europe 7.50% CAGR EU harmonization compliance


Germany anchors the European Life Science and Analytical Instruments Market through its dense network of pharma manufacturers and Fraunhofer research institutes. The UK's 2024 Life Sciences Vision committed GBP 2 Billion to research-infrastructure modernization, including analytical core-facility upgrades [18]. Horizon Europe's Health Cluster has directed over EUR 1.8 Billion toward instrumentation-intensive research programs between 2024 and 2027 [4].

Asia-Pacific

Country Key Metric Key Driver
China 38% of regional share "Made in China 2025" pharma instrumentation targets [9]
India CAGR 10.45% CDSCO regulatory upgrades and generic-drug testing [16]
Japan USD 1.12 Billion (2025) Aging-society drug development
South Korea CAGR 9.80% Samsung Biologics, Celltrion CDMO growth
ASEAN 9.15% CAGR Vietnam and Indonesia facility build-outs
Rest of Asia-Pacific USD 0.38 Billion (2025) Australia and New Zealand academic labs


Asia-Pacific represents the highest-growth corridor for the Life Science and Analytical Instruments Market. China's instrument self-sufficiency push under the 14th Five-Year Plan has prompted domestic manufacturers like Shimadzu China and local entrants to expand production, while multinational vendors intensify localization efforts [9]. India's revised CDSCO standards now require instrumental impurity profiling for all ANDA-equivalent filings, catalyzing a nationwide instrument-procurement cycle [16].

South America

Country Key Metric Key Driver
Brazil 58% of regional share ANVISA harmonization with ICH standards
Argentina CAGR 7.85% Agricultural-biotech testing demand
Rest of South America USD 0.18 Billion (2025) Colombia and Chile pharma growth


Brazil leads the South American Life Science and Analytical Instruments Market as ANVISA's 2024 regulatory updates mandate modern chromatographic and spectroscopic methods for all new drug applications. Argentina's expanding agricultural-biotechnology sector requires analytical verification of genetically modified traits, adding a non-pharmaceutical demand stream that diversifies regional instrument sales.

Middle East & Africa

Country Key Metric Key Driver
Saudi Arabia 32% of regional share Vision 2030 pharma-cluster investment
UAE CAGR 8.10% Dubai Healthcare City expansion
South Africa USD 0.14 Billion (2025) Generic-drug manufacturing base
Egypt 7.55% CAGR Local pharmaceutical production growth
Rest of MEA USD 0.21 Billion (2025) NGO-funded laboratory programs


Saudi Arabia's Vision 2030 has earmarked USD 3.2 Billion for domestic pharmaceutical manufacturing, including analytical-laboratory infrastructure at the King Abdullah Financial District health hub. The UAE's free-zone incentives continue to attract CRO and CDMO operations that require GMP-validated analytical instruments, supporting steady demand growth for the Life Science and Analytical Instruments Market across the Gulf region.


Life Science & Analytical Instruments Market By Region, 2025-2035

Competitive Benchmarking

The Life Science and Analytical Instruments Market exhibits moderate concentration, with an estimated Herfindahl-Hirschman Index (HHI) of approximately 1,200–1,400. The top five companies hold a combined 55–60% revenue share, while the remaining market is fragmented across regional distributors, specialty manufacturers, and emerging Chinese domestic brands. Competition centers on workflow integration — bundling instruments with proprietary software, consumables, and service agreements to maximize customer lock-in.

Company Est. Revenue Share Range Key Offerings Strategic Positioning
Agilent Technologies ~12–15% LC, GC, mass spectrometry, CrossLab services Broad portfolio leader, strong pharma relationships
Thermo Fisher Scientific ~14–17% Orbitrap MS, chromatography, laboratory informatics End-to-end workflow integration across discovery and QC
Waters Corporation ~7–9% UPLC, QTof mass spectrometry, Empower CDS Separation-science specialist with deep pharma penetration
Danaher Corporation ~8–11% Cytiva bioprocessing analytics, Beckman Coulter Platform economics via recurring consumable revenue
Shimadzu Corporation ~6–8% LC-MS, GC-MS, spectrophotometry Strong Asia-Pacific market position, value-price segment
Bruker Corporation ~5–7% NMR, mass spectrometry, X-ray diffraction Academic and structural-biology specialization
PerkinElmer (Revvity) ~4–6% Atomic spectroscopy, plate readers, informatics Life-sciences diagnostics and food-testing pivot
Bio-Rad Laboratories ~3–5% Chromatography media, droplet digital PCR Niche leadership in bioproduction analytics
Merck KGaA (MilliporeSigma) ~3–5% Reference standards, LC columns, sample prep Consumables-led strategy complementing third-party hardware
Horiba Ltd. ~2–4% Fluorescence spectroscopy, particle characterization Automotive-to-life-science diversification
Mettler-Toledo ~2–3% Analytical balances, titration, thermal analysis Laboratory infrastructure ancillary instruments


Recent News & Developments

  • June 2025: Thermo Fisher launched Orbitrap Astral Zoom and Orbitrap Excedion Pro, improving scan speeds by 35% and multiplexing by 50%, targeting biopharma and omics processes.
  • In June 2025: Waters released BioResolve Protein A columns with MaxPeak Premier to enable aggregate analysis and increase antibody-titer sensitivity by 7×.In June 2025, Bruker expanded routine clinical and environmental applications by showcasing timsMetabo for PFAS detection and DART integration.
  • April 2025: Thermo Fisher allocated USD 500 million for research and development of next-generation analytical systems as part of its USD 2 billion commitment to American innovation.
  • April 2025: To improve lab automation and cut down on plastic waste, QIAGEN announced three sample-prep device deployments by 2026.


Life Science & Analytical Instruments Market Report Scope

Parameter Detail
Market Scope Life Science and Analytical Instruments Market — global coverage across chromatographs, spectrometers, liquid analyzers, X-ray and microscopy instruments
Study Period 2021–2035
CAGR 8.15% (2026–2035)
Base Year Size USD 21.68 Billion (2025)
Forecast Endpoint USD 47.26 Billion (2035)
Fastest Growing Segment Spectrometers (by product); Biopharmaceutical & Nutraceutical (by end user); Asia-Pacific (by region)
Companies Profiled Agilent Technologies, Thermo Fisher Scientific, Waters Corporation, Danaher, Shimadzu, Bruker, PerkinElmer/Revvity, Bio-Rad, Merck KGaA, Horiba, Mettler-Toledo
Valuation Currency USD Billion


FAQs

How do instrument-as-a-service pricing models affect procurement decisions for mid-size pharma companies?
Subscription-based pricing shifts instrument spending from CapEx to OpEx, lowering approval thresholds and shortening procurement cycles. Mid-size firms can access top-tier platforms without committing USD 1–2 Million upfront [12].
What cybersecurity risks should laboratories consider when connecting analytical instruments to cloud platforms?
Networked instruments create attack surfaces for data tampering and intellectual-property theft. NIST's 2024 laboratory-LIMS cybersecurity framework recommends role-based access, encrypted data transit, and audit-trail integrity verification [14].
How does the shift to continuous manufacturing change instrument-maintenance schedules?
Continuous-production environments run instruments 24/7, compressing service intervals from annual to quarterly. Predictive-maintenance software tied to real-time sensor data helps avoid unplanned downtime [7].
Which analytical technique offers the best cost-per-sample for biologics characterization?
Capillary electrophoresis provides the lowest reagent and consumable cost per sample for charge-variant and size-exclusion analyses of monoclonal antibodies. It complements but does not replace LC-MS for primary-structure confirmation [22].
How are refurbished-instrument markets impacting new-equipment sales within the Life Science and Analytical Instruments Market?
Certified pre-owned programs from vendors like Agilent and Waters now capture roughly 8–10% of annual instrument transactions. These programs protect margins while extending vendor ecosystem reach into price-sensitive segments [21].
What role do reference-standard libraries play in vendor lock-in across the Life Science and Analytical Instruments Market?
Proprietary spectral and chromatographic reference libraries create switching costs because migrating validated methods to a competitor's platform requires full revalidation. Vendors invest heavily in expanding these libraries [25].
How will single-cell proteomics reshape instrument specifications in the Life Science and Analytical Instruments Market?
Single-cell workflows demand sub-attomole sensitivity and 200+ Hz scan speeds, pushing mass-spectrometry hardware beyond current mainstream specifications. Early adopters in academic settings are already driving premium-tier instrument sales [3].    
What is the current size of the life science & analytical instruments market?
The life science & analytical instruments market reached USD 21.68 billion in 2025 and is projected to reach USD 47.26 billion by 2035.
What is the CAGR of the life science & analytical instruments market?
The life science & analytical instruments market is projected to grow at a CAGR of 8.15% during the forecast period 2026–2035.
Which region leads the life science & analytical instruments market?
North America holds the largest share at 41.5%, while Asia-Pacific is the fastest-growing region at 9.67% CAGR.
Author
Author
Author Profile
Rahul Gotadki LinkedIn
Research Manager
He holds an experience of about 9+ years in Market Research and Business Consulting, working under the spectrum of Life Sciences and Healthcare domains. Rahul conceptualizes and implements a scalable business strategy and provides strategic leadership to the clients. His expertise lies in market estimation, competitive intelligence, pipeline analysis, customer assessment, etc.
Co-Author
Co-Author Profile
Snehal Singh LinkedIn
Manager - Research
High acumen in analyzing complex macro & micro markets with more than 6 years of work experience in the field of market research. By implementing her analytical skills in forecasting and estimation into market research reports, she has expertise in Packaging, Construction, and Equipment domains. She handles a team size of 20-25 resources and ensures smooth running of the projects, associated marketing activities, and client servicing.
Download Free Sample

Kindly complete the form below to receive a free sample of this Report

Download PDF ×

We do not share your information with anyone. However, we may send you emails based on your report interest from time to time. You may contact us at any time to opt-out.
















