US Frequency Converter Market Segmentation
US Frequency Converter Market By Type (USD Million, 2025-2035)
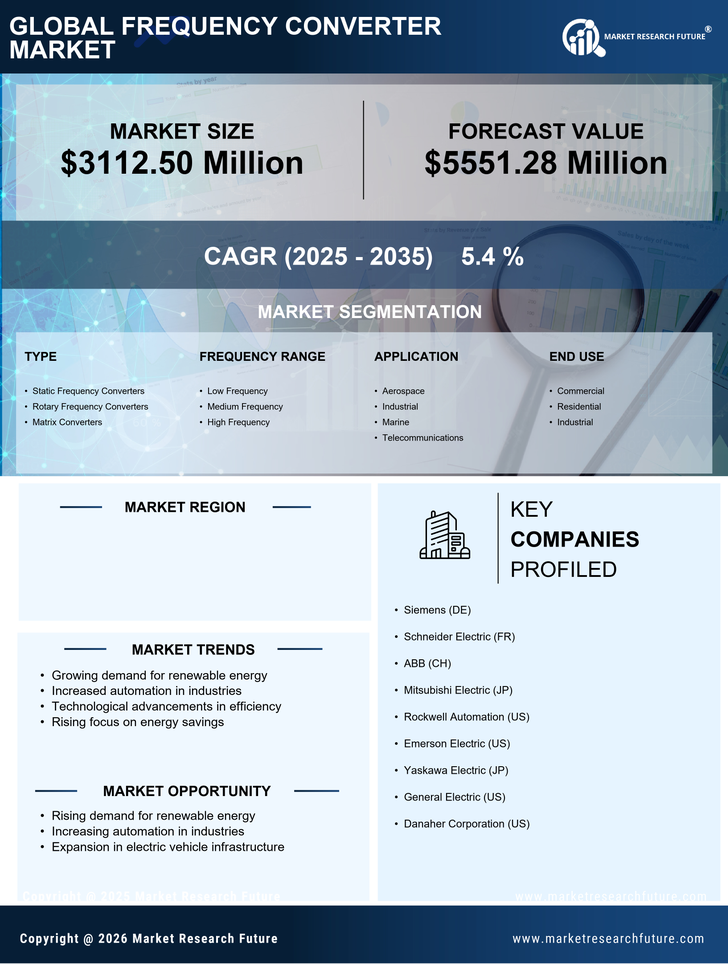
- Static Frequency Converters
- Rotary Frequency Converters
- Matrix Converters
US Frequency Converter Market By Frequency Range (USD Million, 2025-2035)
- Low Frequency
- Medium Frequency
- High Frequency
US Frequency Converter Market By Application (USD Million, 2025-2035)
- Aerospace
- Industrial
- Marine
- Telecommunications
US Frequency Converter Market By End Use (USD Million, 2025-2035)
- Commercial
- Residential
- Industrial