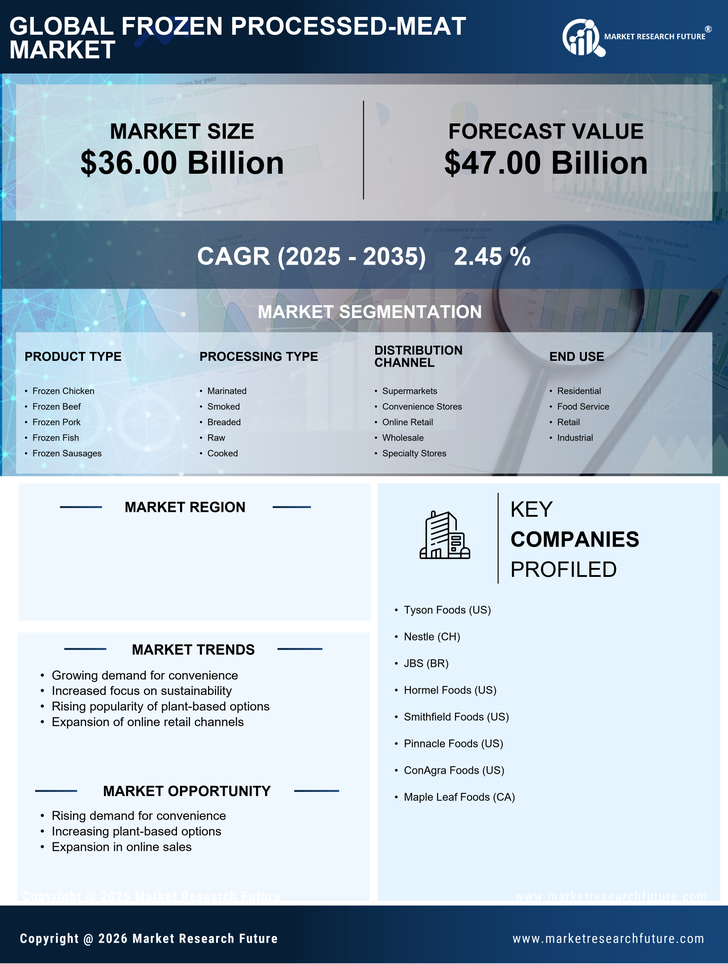
Request Free Sample ×

Kindly complete the form below to receive a free sample of this Report

* Please use a valid business email

Leading companies partner with us for data-driven Insights

clients tt-cursor
Hero Background

US Frozen Processed Meat Market

ID: MRFR/FnB/12756-HCR
129 Pages
Snehal Singh
Last Updated: April 06, 2026
US Frozen Meat Market Size, Share, Industry Trend & Analysis Research Report: By Product Type (Frozen Processed Meat, Frozen Whole Cut), By End User (Food Service, Retail Customers) andBy Distribution Channel (Store Based, Non-Store Based)- Forecast to 2035
Download PDF ×

We do not share your information with anyone. However, we may send you emails based on your report interest from time to time. You may contact us at any time to opt-out.

  1. 1 SECTION I: EXECUTIVE SUMMARY AND KEY HIGHLIGHTS
    1. 1.1 EXECUTIVE SUMMARY
      1. 1.1.1 Market Overview
      2. 1.1.2 Key Findings
      3. 1.1.3 Market Segmentation
      4. 1.1.4 Competitive Landscape
      5. 1.1.5 Challenges and Opportunities
      6. 1.1.6 Future Outlook
  2. 2 SECTION II: SCOPING, METHODOLOGY AND MARKET STRUCTURE
    1. 2.1 MARKET INTRODUCTION
      1. 2.1.1 Definition
      2. 2.1.2 Scope of the study
        1. 2.1.2.1 Research Objective
        2. 2.1.2.2 Assumption
        3. 2.1.2.3 Limitations
    2. 2.2 RESEARCH METHODOLOGY
      1. 2.2.1 Overview
      2. 2.2.2 Data Mining
      3. 2.2.3 Secondary Research
      4. 2.2.4 Primary Research
        1. 2.2.4.1 Primary Interviews and Information Gathering Process
        2. 2.2.4.2 Breakdown of Primary Respondents
      5. 2.2.5 Forecasting Model
      6. 2.2.6 Market Size Estimation
        1. 2.2.6.1 Bottom-Up Approach
        2. 2.2.6.2 Top-Down Approach
      7. 2.2.7 Data Triangulation
      8. 2.2.8 Validation
  3. 3 SECTION III: QUALITATIVE ANALYSIS
    1. 3.1 MARKET DYNAMICS
      1. 3.1.1 Overview
      2. 3.1.2 Drivers
      3. 3.1.3 Restraints
      4. 3.1.4 Opportunities
    2. 3.2 MARKET FACTOR ANALYSIS
      1. 3.2.1 Value chain Analysis
      2. 3.2.2 Porter's Five Forces Analysis
        1. 3.2.2.1 Bargaining Power of Suppliers
        2. 3.2.2.2 Bargaining Power of Buyers
        3. 3.2.2.3 Threat of New Entrants
        4. 3.2.2.4 Threat of Substitutes
        5. 3.2.2.5 Intensity of Rivalry
      3. 3.2.3 COVID-19 Impact Analysis
        1. 3.2.3.1 Market Impact Analysis
        2. 3.2.3.2 Regional Impact
        3. 3.2.3.3 Opportunity and Threat Analysis
  4. 4 SECTION IV: QUANTITATIVE ANALYSIS
    1. 4.1 Chemicals and Materials, BY Product Type (USD Billion)
      1. 4.1.1 Frozen Chicken
      2. 4.1.2 Frozen Beef
      3. 4.1.3 Frozen Pork
      4. 4.1.4 Frozen Fish
      5. 4.1.5 Frozen Sausages
    2. 4.2 Chemicals and Materials, BY Processing Type (USD Billion)
      1. 4.2.1 Marinated
      2. 4.2.2 Smoked
      3. 4.2.3 Breaded
      4. 4.2.4 Raw
      5. 4.2.5 Cooked
    3. 4.3 Chemicals and Materials, BY Distribution Channel (USD Billion)
      1. 4.3.1 Supermarkets
      2. 4.3.2 Convenience Stores
      3. 4.3.3 Online Retail
      4. 4.3.4 Wholesale
      5. 4.3.5 Specialty Stores
    4. 4.4 Chemicals and Materials, BY End Use (USD Billion)
      1. 4.4.1 Residential
      2. 4.4.2 Food Service
      3. 4.4.3 Retail
      4. 4.4.4 Industrial
  5. 5 SECTION V: COMPETITIVE ANALYSIS
    1. 5.1 Competitive Landscape
      1. 5.1.1 Overview
      2. 5.1.2 Competitive Analysis
      3. 5.1.3 Market share Analysis
      4. 5.1.4 Major Growth Strategy in the Chemicals and Materials
      5. 5.1.5 Competitive Benchmarking
      6. 5.1.6 Leading Players in Terms of Number of Developments in the Chemicals and Materials
      7. 5.1.7 Key developments and growth strategies
        1. 5.1.7.1 New Product Launch/Service Deployment
        2. 5.1.7.2 Merger & Acquisitions
        3. 5.1.7.3 Joint Ventures
      8. 5.1.8 Major Players Financial Matrix
        1. 5.1.8.1 Sales and Operating Income
        2. 5.1.8.2 Major Players R&D Expenditure. 2023
    2. 5.2 Company Profiles
      1. 5.2.1 Tyson Foods (US)
        1. 5.2.1.1 Financial Overview
        2. 5.2.1.2 Products Offered
        3. 5.2.1.3 Key Developments
        4. 5.2.1.4 SWOT Analysis
        5. 5.2.1.5 Key Strategies
      2. 5.2.2 Nestle (CH)
        1. 5.2.2.1 Financial Overview
        2. 5.2.2.2 Products Offered
        3. 5.2.2.3 Key Developments
        4. 5.2.2.4 SWOT Analysis
        5. 5.2.2.5 Key Strategies
      3. 5.2.3 JBS (BR)
        1. 5.2.3.1 Financial Overview
        2. 5.2.3.2 Products Offered
        3. 5.2.3.3 Key Developments
        4. 5.2.3.4 SWOT Analysis
        5. 5.2.3.5 Key Strategies
      4. 5.2.4 Hormel Foods (US)
        1. 5.2.4.1 Financial Overview
        2. 5.2.4.2 Products Offered
        3. 5.2.4.3 Key Developments
        4. 5.2.4.4 SWOT Analysis
        5. 5.2.4.5 Key Strategies
      5. 5.2.5 Smithfield Foods (US)
        1. 5.2.5.1 Financial Overview
        2. 5.2.5.2 Products Offered
        3. 5.2.5.3 Key Developments
        4. 5.2.5.4 SWOT Analysis
        5. 5.2.5.5 Key Strategies
      6. 5.2.6 Pinnacle Foods (US)
        1. 5.2.6.1 Financial Overview
        2. 5.2.6.2 Products Offered
        3. 5.2.6.3 Key Developments
        4. 5.2.6.4 SWOT Analysis
        5. 5.2.6.5 Key Strategies
      7. 5.2.7 ConAgra Foods (US)
        1. 5.2.7.1 Financial Overview
        2. 5.2.7.2 Products Offered
        3. 5.2.7.3 Key Developments
        4. 5.2.7.4 SWOT Analysis
        5. 5.2.7.5 Key Strategies
      8. 5.2.8 Maple Leaf Foods (CA)
        1. 5.2.8.1 Financial Overview
        2. 5.2.8.2 Products Offered
        3. 5.2.8.3 Key Developments
        4. 5.2.8.4 SWOT Analysis
        5. 5.2.8.5 Key Strategies
    3. 5.3 Appendix
      1. 5.3.1 References
      2. 5.3.2 Related Reports
  6. 6 LIST OF FIGURES
    1. 6.1 MARKET SYNOPSIS
    2. 6.2 US MARKET ANALYSIS BY PRODUCT TYPE
    3. 6.3 US MARKET ANALYSIS BY PROCESSING TYPE
    4. 6.4 US MARKET ANALYSIS BY DISTRIBUTION CHANNEL
    5. 6.5 US MARKET ANALYSIS BY END USE
    6. 6.6 KEY BUYING CRITERIA OF CHEMICALS AND MATERIALS
    7. 6.7 RESEARCH PROCESS OF MRFR
    8. 6.8 DRO ANALYSIS OF CHEMICALS AND MATERIALS
    9. 6.9 DRIVERS IMPACT ANALYSIS: CHEMICALS AND MATERIALS
    10. 6.10 RESTRAINTS IMPACT ANALYSIS: CHEMICALS AND MATERIALS
    11. 6.11 SUPPLY / VALUE CHAIN: CHEMICALS AND MATERIALS
    12. 6.12 CHEMICALS AND MATERIALS, BY PRODUCT TYPE, 2024 (% SHARE)
    13. 6.13 CHEMICALS AND MATERIALS, BY PRODUCT TYPE, 2024 TO 2035 (USD Billion)
    14. 6.14 CHEMICALS AND MATERIALS, BY PROCESSING TYPE, 2024 (% SHARE)
    15. 6.15 CHEMICALS AND MATERIALS, BY PROCESSING TYPE, 2024 TO 2035 (USD Billion)
    16. 6.16 CHEMICALS AND MATERIALS, BY DISTRIBUTION CHANNEL, 2024 (% SHARE)
    17. 6.17 CHEMICALS AND MATERIALS, BY DISTRIBUTION CHANNEL, 2024 TO 2035 (USD Billion)
    18. 6.18 CHEMICALS AND MATERIALS, BY END USE, 2024 (% SHARE)
    19. 6.19 CHEMICALS AND MATERIALS, BY END USE, 2024 TO 2035 (USD Billion)
    20. 6.20 BENCHMARKING OF MAJOR COMPETITORS
  7. 7 LIST OF TABLES
    1. 7.1 LIST OF ASSUMPTIONS
  8. 7.1.1
    1. 7.2 US MARKET SIZE ESTIMATES; FORECAST
      1. 7.2.1 BY PRODUCT TYPE, 2025-2035 (USD Billion)
      2. 7.2.2 BY PROCESSING TYPE, 2025-2035 (USD Billion)
      3. 7.2.3 BY DISTRIBUTION CHANNEL, 2025-2035 (USD Billion)
      4. 7.2.4 BY END USE, 2025-2035 (USD Billion)
    2. 7.3 PRODUCT LAUNCH/PRODUCT DEVELOPMENT/APPROVAL
  9. 7.3.1
    1. 7.4 ACQUISITION/PARTNERSHIP
  10. 7.4.1

US Chemicals and Materials Market Segmentation

Chemicals and Materials By Product Type (USD Billion, 2025-2035)

  • Frozen Chicken
  • Frozen Beef
  • Frozen Pork
  • Frozen Fish
  • Frozen Sausages

Chemicals and Materials By Processing Type (USD Billion, 2025-2035)

  • Marinated
  • Smoked
  • Breaded
  • Raw
  • Cooked

Chemicals and Materials By Distribution Channel (USD Billion, 2025-2035)

  • Supermarkets
  • Convenience Stores
  • Online Retail
  • Wholesale
  • Specialty Stores

Chemicals and Materials By End Use (USD Billion, 2025-2035)

  • Residential
  • Food Service
  • Retail
  • Industrial