US Industrial Display System Market Segmentation
US Industrial Display System Market By Type (USD Million, 2025-2035)
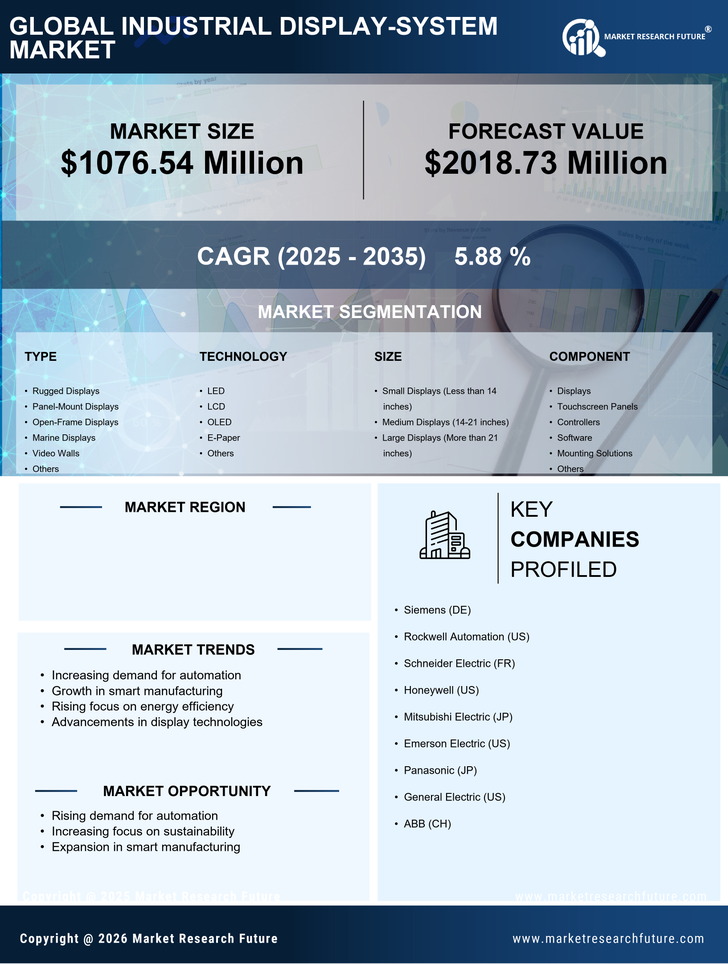
- Rugged Displays
- Panel-Mount Displays
- Open-Frame Displays
- Marine Displays
- Video Walls
- Others
US Industrial Display System Market By Technology (USD Million, 2025-2035)
- LED
- LCD
- OLED
- E-Paper
- Others
US Industrial Display System Market By Size (USD Million, 2025-2035)
- Small Displays (Less than 14 inches)
- Medium Displays (14-21 inches)
- Large Displays (More than 21 inches)
US Industrial Display System Market By Component (USD Million, 2025-2035)
- Displays
- Touchscreen Panels
- Controllers
- Software
- Mounting Solutions
- Others
US Industrial Display System Market By Application Area (USD Million, 2025-2035)
- Human-Machine Interface (HMI)
- Remote Monitoring
- Interactive Display Systems
- Digital Signage
- Kiosks
- Others
US Industrial Display System Market By End-Use Industry (USD Million, 2025-2035)
- Healthcare
- Avionics
- Military
- US Industrial Display System Market
- Transportation
- Food & Beverage
- Retail
- Others