US Intelligent Motor Controller Market Segmentation
US Intelligent Motor Controller Market By Application (USD Million, 2025-2035)
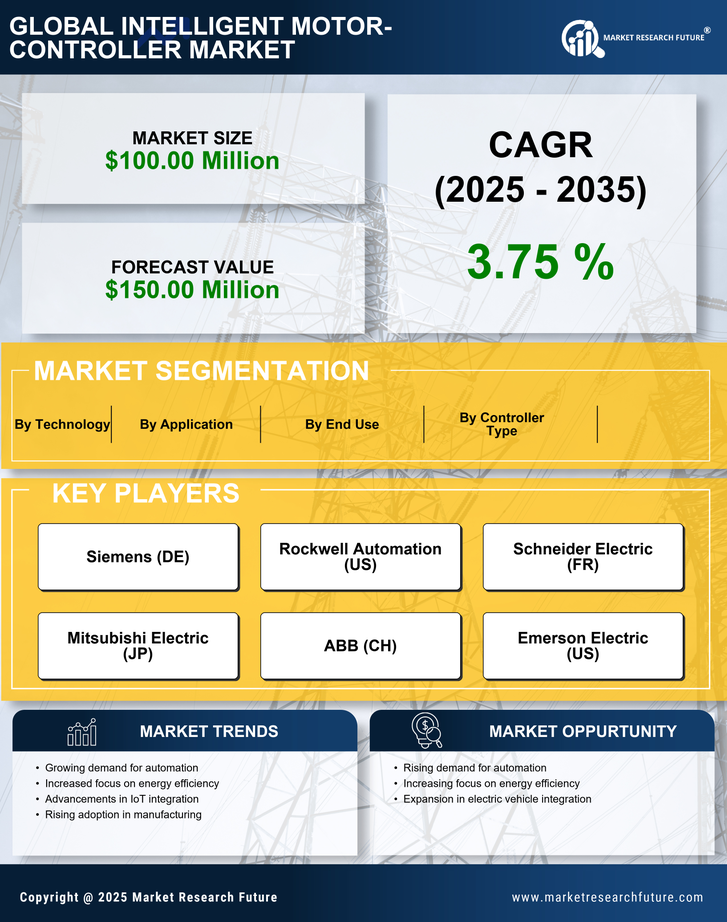
- Industrial Automation
- Electric Vehicles
- Home Appliances
- Robotics
US Intelligent Motor Controller Market By Controller Type (USD Million, 2025-2035)
- Programmable Logic Controller
- Servo Motor Controller
- Variable Frequency Drive
- Soft Starter
US Intelligent Motor Controller Market By End Use (USD Million, 2025-2035)
- Manufacturing
- Healthcare
- Consumer Electronics
- Transportation
US Intelligent Motor Controller Market By Technology (USD Million, 2025-2035)
- Digital Control
- Analog Control
- Closed Loop Control
- Open Loop Control