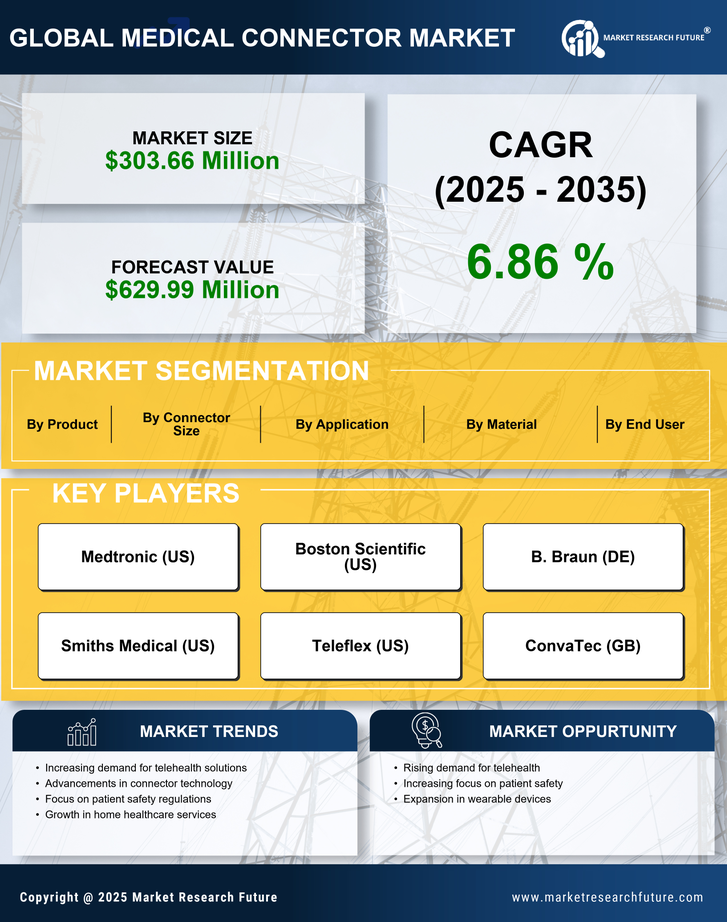
Request Free Sample ×

Kindly complete the form below to receive a free sample of this Report

* Please use a valid business email

Leading companies partner with us for data-driven Insights

clients tt-cursor
Hero Background

US Medical Connector Market

ID: MRFR/SEM/13677-HCR
200 Pages
Apoorva Priyadarshi
Last Updated: April 06, 2026
US Medical Connector Market Size, Share and Research Report: By Connector Size (=10mm, >20mm, 11mm20mm), By Material (Plastic, Metal), By Application (Electrosurgical Devices, Enteral Devices, Diagnostic Imaging Devices, Other), By Product (Embedded Electronics Connectors, Circular Connector & Receptacle Systems, Flat Silicone Surgical Cables, Disposable Electronics Connectors, Magnetic Medical Connectors, Other) and By End User (Hospitals & Clinics, Imaging Centres & Diagnostic Laboratories, Other) - Industry Forecast Till 2035
Download PDF ×

We do not share your information with anyone. However, we may send you emails based on your report interest from time to time. You may contact us at any time to opt-out.

  1. 1 SECTION I: EXECUTIVE SUMMARY AND KEY HIGHLIGHTS
    1. 1.1 EXECUTIVE SUMMARY
      1. 1.1.1 Market Overview
      2. 1.1.2 Key Findings
      3. 1.1.3 Market Segmentation
      4. 1.1.4 Competitive Landscape
      5. 1.1.5 Challenges and Opportunities
      6. 1.1.6 Future Outlook
  2. 2 SECTION II: SCOPING, METHODOLOGY AND MARKET STRUCTURE
    1. 2.1 MARKET INTRODUCTION
      1. 2.1.1 Definition
      2. 2.1.2 Scope of the study
        1. 2.1.2.1 Research Objective
        2. 2.1.2.2 Assumption
        3. 2.1.2.3 Limitations
    2. 2.2 RESEARCH METHODOLOGY
      1. 2.2.1 Overview
      2. 2.2.2 Data Mining
      3. 2.2.3 Secondary Research
      4. 2.2.4 Primary Research
        1. 2.2.4.1 Primary Interviews and Information Gathering Process
        2. 2.2.4.2 Breakdown of Primary Respondents
      5. 2.2.5 Forecasting Model
      6. 2.2.6 Market Size Estimation
        1. 2.2.6.1 Bottom-Up Approach
        2. 2.2.6.2 Top-Down Approach
      7. 2.2.7 Data Triangulation
      8. 2.2.8 Validation
  3. 3 SECTION III: QUALITATIVE ANALYSIS
    1. 3.1 MARKET DYNAMICS
      1. 3.1.1 Overview
      2. 3.1.2 Drivers
      3. 3.1.3 Restraints
      4. 3.1.4 Opportunities
    2. 3.2 MARKET FACTOR ANALYSIS
      1. 3.2.1 Value chain Analysis
      2. 3.2.2 Porter's Five Forces Analysis
        1. 3.2.2.1 Bargaining Power of Suppliers
        2. 3.2.2.2 Bargaining Power of Buyers
        3. 3.2.2.3 Threat of New Entrants
        4. 3.2.2.4 Threat of Substitutes
        5. 3.2.2.5 Intensity of Rivalry
      3. 3.2.3 COVID-19 Impact Analysis
        1. 3.2.3.1 Market Impact Analysis
        2. 3.2.3.2 Regional Impact
        3. 3.2.3.3 Opportunity and Threat Analysis
  4. 4 SECTION IV: QUANTITATIVE ANALYSIS
    1. 4.1 Semiconductor & Electronics, BY Connector Size (USD Million)
      1. 4.1.1 20mm
      2. 4.1.3 11mm—20mm
    2. 4.2 Semiconductor & Electronics, BY Material (USD Million)
      1. 4.2.1 Plastic
      2. 4.2.2 Metal
    3. 4.3 Semiconductor & Electronics, BY Application (USD Million)
      1. 4.3.1 Electrosurgical Devices
      2. 4.3.2 Enteral Devices
      3. 4.3.3 Analyzers and Processing Equipment
      4. 4.3.4 Diagnostic Imaging Devices
      5. 4.3.5 Cardiology Devices
      6. 4.3.6 Dental Instruments
    4. 4.4 Semiconductor & Electronics, BY Product (USD Million)
      1. 4.4.1 Embedded Electronics Connectors
      2. 4.4.2 Circular Connector and Receptacle Systems
      3. 4.4.3 Lighted Hospital Grade Cords
      4. 4.4.4 Flat silicone Surgical Cables
      5. 4.4.5 Disposable Electronics Connectors
      6. 4.4.6 Magnetic Medical Connectors
      7. 4.4.7 Radio Frequency Connectors
    5. 4.5 Semiconductor & Electronics, BY End User (USD Million)
      1. 4.5.1 Hospitals & Clinics
      2. 4.5.2 Imaging Centres and Diagnostic Laboratories
      3. 4.5.3 Ambulatory Surgical Centres
  5. 5 SECTION V: COMPETITIVE ANALYSIS
    1. 5.1 Competitive Landscape
      1. 5.1.1 Overview
      2. 5.1.2 Competitive Analysis
      3. 5.1.3 Market share Analysis
      4. 5.1.4 Major Growth Strategy in the Semiconductor & Electronics
      5. 5.1.5 Competitive Benchmarking
      6. 5.1.6 Leading Players in Terms of Number of Developments in the Semiconductor & Electronics
      7. 5.1.7 Key developments and growth strategies
        1. 5.1.7.1 New Product Launch/Service Deployment
        2. 5.1.7.2 Merger & Acquisitions
        3. 5.1.7.3 Joint Ventures
      8. 5.1.8 Major Players Financial Matrix
        1. 5.1.8.1 Sales and Operating Income
        2. 5.1.8.2 Major Players R&D Expenditure. 2023
    2. 5.2 Company Profiles
      1. 5.2.1 Medtronic (US)
        1. 5.2.1.1 Financial Overview
        2. 5.2.1.2 Products Offered
        3. 5.2.1.3 Key Developments
        4. 5.2.1.4 SWOT Analysis
        5. 5.2.1.5 Key Strategies
      2. 5.2.2 Boston Scientific (US)
        1. 5.2.2.1 Financial Overview
        2. 5.2.2.2 Products Offered
        3. 5.2.2.3 Key Developments
        4. 5.2.2.4 SWOT Analysis
        5. 5.2.2.5 Key Strategies
      3. 5.2.3 B. Braun (DE)
        1. 5.2.3.1 Financial Overview
        2. 5.2.3.2 Products Offered
        3. 5.2.3.3 Key Developments
        4. 5.2.3.4 SWOT Analysis
        5. 5.2.3.5 Key Strategies
      4. 5.2.4 Smiths Medical (US)
        1. 5.2.4.1 Financial Overview
        2. 5.2.4.2 Products Offered
        3. 5.2.4.3 Key Developments
        4. 5.2.4.4 SWOT Analysis
        5. 5.2.4.5 Key Strategies
      5. 5.2.5 Teleflex (US)
        1. 5.2.5.1 Financial Overview
        2. 5.2.5.2 Products Offered
        3. 5.2.5.3 Key Developments
        4. 5.2.5.4 SWOT Analysis
        5. 5.2.5.5 Key Strategies
      6. 5.2.6 ConvaTec (GB)
        1. 5.2.6.1 Financial Overview
        2. 5.2.6.2 Products Offered
        3. 5.2.6.3 Key Developments
        4. 5.2.6.4 SWOT Analysis
        5. 5.2.6.5 Key Strategies
      7. 5.2.7 Fresenius Kabi (DE)
        1. 5.2.7.1 Financial Overview
        2. 5.2.7.2 Products Offered
        3. 5.2.7.3 Key Developments
        4. 5.2.7.4 SWOT Analysis
        5. 5.2.7.5 Key Strategies
      8. 5.2.8 Terumo (JP)
        1. 5.2.8.1 Financial Overview
        2. 5.2.8.2 Products Offered
        3. 5.2.8.3 Key Developments
        4. 5.2.8.4 SWOT Analysis
        5. 5.2.8.5 Key Strategies
      9. 5.2.9 Halyard Health (US)
        1. 5.2.9.1 Financial Overview
        2. 5.2.9.2 Products Offered
        3. 5.2.9.3 Key Developments
        4. 5.2.9.4 SWOT Analysis
        5. 5.2.9.5 Key Strategies
    3. 5.3 Appendix
      1. 5.3.1 References
      2. 5.3.2 Related Reports
  6. 6 LIST OF FIGURES
    1. 6.1 MARKET SYNOPSIS
    2. 6.2 US MARKET ANALYSIS BY CONNECTOR SIZE
    3. 6.3 US MARKET ANALYSIS BY MATERIAL
    4. 6.4 US MARKET ANALYSIS BY APPLICATION
    5. 6.5 US MARKET ANALYSIS BY PRODUCT
    6. 6.6 US MARKET ANALYSIS BY END USER
    7. 6.7 KEY BUYING CRITERIA OF SEMICONDUCTOR & ELECTRONICS
    8. 6.8 RESEARCH PROCESS OF MRFR
    9. 6.9 DRO ANALYSIS OF SEMICONDUCTOR & ELECTRONICS
    10. 6.10 DRIVERS IMPACT ANALYSIS: SEMICONDUCTOR & ELECTRONICS
    11. 6.11 RESTRAINTS IMPACT ANALYSIS: SEMICONDUCTOR & ELECTRONICS
    12. 6.12 SUPPLY / VALUE CHAIN: SEMICONDUCTOR & ELECTRONICS
    13. 6.13 SEMICONDUCTOR & ELECTRONICS, BY CONNECTOR SIZE, 2024 (% SHARE)
    14. 6.14 SEMICONDUCTOR & ELECTRONICS, BY CONNECTOR SIZE, 2024 TO 2035 (USD Million)
    15. 6.15 SEMICONDUCTOR & ELECTRONICS, BY MATERIAL, 2024 (% SHARE)
    16. 6.16 SEMICONDUCTOR & ELECTRONICS, BY MATERIAL, 2024 TO 2035 (USD Million)
    17. 6.17 SEMICONDUCTOR & ELECTRONICS, BY APPLICATION, 2024 (% SHARE)
    18. 6.18 SEMICONDUCTOR & ELECTRONICS, BY APPLICATION, 2024 TO 2035 (USD Million)
    19. 6.19 SEMICONDUCTOR & ELECTRONICS, BY PRODUCT, 2024 (% SHARE)
    20. 6.20 SEMICONDUCTOR & ELECTRONICS, BY PRODUCT, 2024 TO 2035 (USD Million)
    21. 6.21 SEMICONDUCTOR & ELECTRONICS, BY END USER, 2024 (% SHARE)
    22. 6.22 SEMICONDUCTOR & ELECTRONICS, BY END USER, 2024 TO 2035 (USD Million)
    23. 6.23 BENCHMARKING OF MAJOR COMPETITORS
  7. 7 LIST OF TABLES
    1. 7.1 LIST OF ASSUMPTIONS
  8. 7.1.1
    1. 7.2 US MARKET SIZE ESTIMATES; FORECAST
      1. 7.2.1 BY CONNECTOR SIZE, 2025-2035 (USD Million)
      2. 7.2.2 BY MATERIAL, 2025-2035 (USD Million)
      3. 7.2.3 BY APPLICATION, 2025-2035 (USD Million)
      4. 7.2.4 BY PRODUCT, 2025-2035 (USD Million)
      5. 7.2.5 BY END USER, 2025-2035 (USD Million)
    2. 7.3 PRODUCT LAUNCH/PRODUCT DEVELOPMENT/APPROVAL
  9. 7.3.1
    1. 7.4 ACQUISITION/PARTNERSHIP
  10. 7.4.1

US Semiconductor & Electronics Market Segmentation

Semiconductor & Electronics By Connector Size (USD Million, 2025-2035)

  • <=10mm
  • >20mm
  • 11mm—20mm

Semiconductor & Electronics By Material (USD Million, 2025-2035)

  • Plastic
  • Metal

Semiconductor & Electronics By Application (USD Million, 2025-2035)

  • Electrosurgical Devices
  • Enteral Devices
  • Analyzers and Processing Equipment
  • Diagnostic Imaging Devices
  • Cardiology Devices
  • Dental Instruments

Semiconductor & Electronics By Product (USD Million, 2025-2035)

  • Embedded Electronics Connectors
  • Circular Connector and Receptacle Systems
  • Lighted Hospital Grade Cords
  • Flat silicone Surgical Cables
  • Disposable Electronics Connectors
  • Magnetic Medical Connectors
  • Radio Frequency Connectors

Semiconductor & Electronics By End User (USD Million, 2025-2035)

  • Hospitals & Clinics
  • Imaging Centres and Diagnostic Laboratories
  • Ambulatory Surgical Centres