US Overhead Conveyor Systems Market Segmentation
US Overhead Conveyor Systems Market By Function (USD Million, 2025-2035)
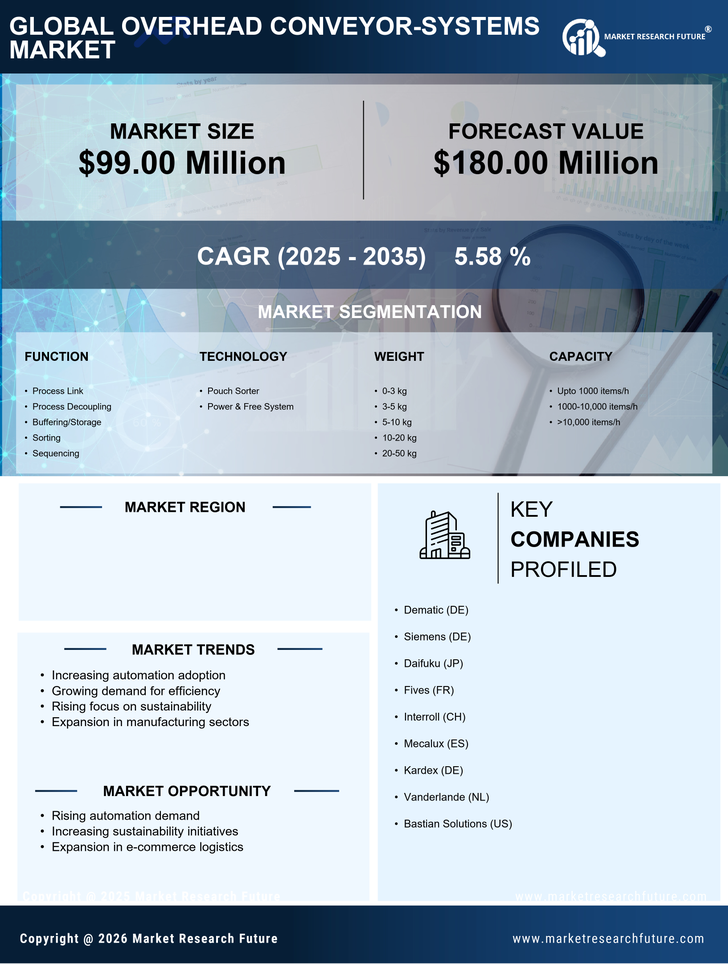
- Process Link
- Process Decoupling
- Buffering/Storage
- Sorting
- Sequencing
US Overhead Conveyor Systems Market By Technology (USD Million, 2025-2035)
- Pouch Sorter
- Power & Free System
US Overhead Conveyor Systems Market By Weight (USD Million, 2025-2035)
- 0-3 kg
- 3-5 kg
- 5-10 kg
- 10-20 kg
- 20-50 kg
US Overhead Conveyor Systems Market By Capacity (USD Million, 2025-2035)
- Upto 1000 items/h
- 1000-10,000 items/h
- >10,000 items/h
US Overhead Conveyor Systems Market By Sales Channel (USD Million, 2025-2035)
- Direct
- Via Main Contractors
US Overhead Conveyor Systems Market By Automation Grade (USD Million, 2025-2035)
- Manual
- Semi-Automatic
- Automatic
US Overhead Conveyor Systems Market By Application (USD Million, 2025-2035)
- E-commerce/Retail
- Logistics
- Production Processes