US Plastic Bottle Recycling Market Segmentation
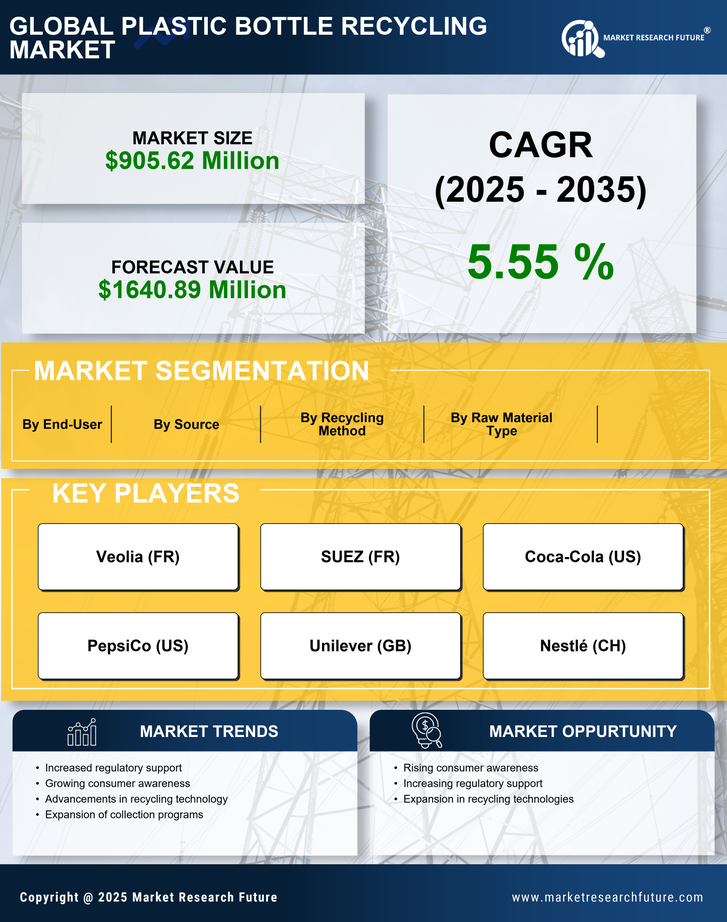
US Plastic Bottle Recycling Market By Source (USD Million, 2025-2035)
- Plastic Bottles
- Plastic Films
- Synthetic Fibers
- Rigid Plastics & Foams
- Others (auto-parts, electrical goods, furniture and others)
US Plastic Bottle Recycling Market By Raw Material Type (USD Million, 2025-2035)
- Polyethylene Terephthalate (PET)
- Polyethylene (PE) – LPDE & HDPE
- Polypropylene (PP)
- Polyvinyl Chloride (PVC)
- Polystyrene (PS)
- Polyamide (PA)
- Polycarbonate
- Acrylonitrile-butadiene Styrene
- Other plastics under SPI code 7
US Plastic Bottle Recycling Market By Recycling Method (USD Million, 2025-2035)
- Thermal decomposition
- Heat compression
- Distributed recycling
- Pyrolysis
- Others
US Plastic Bottle Recycling Market By End-User (USD Million, 2025-2035)
- Packaging (Bottles, Containers, Bags & Films, Strapping, Others)
- Building & Construction (Lumber, Pipe, Furnishings, and Carpets & Rugs and Others)
- Textiles
- Automotive (Batteries, Others)
- Electrical & Electronics
- Others (Agriculture, Aerospace and other industries)