US Tablet & Notebook Display Market Segmentation
US Tablet & Notebook Display Market By Product (USD Billion, 2025-2035)
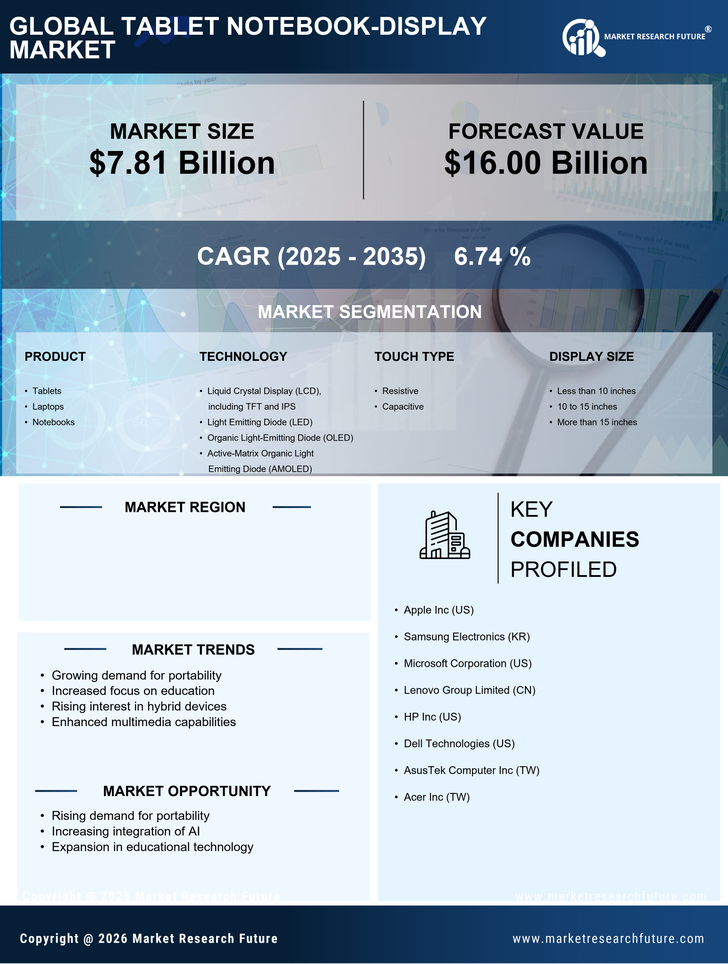
- Tablets
- Laptops
- Notebooks
US Tablet & Notebook Display Market By US Tablet & Notebook Display Market (USD Billion, 2025-2035)
- Liquid Crystal Display (LCD), including TFT and IPS
- Light Emitting Diode (LED)
- Organic Light-Emitting Diode (OLED)
- Active-Matrix Organic Light Emitting Diode (AMOLED)
US Tablet & Notebook Display Market By Touch Type (USD Billion, 2025-2035)
- Resistive
- Capacitive
US Tablet & Notebook Display Market By Display Size (USD Billion, 2025-2035)
- Less than 10 inches
- 10 to 15 inches
- More than 15 inches
US Tablet & Notebook Display Market By End Users (USD Billion, 2025-2035)
- Consumers
- Enterprises