US Temporary Power Market Segmentation
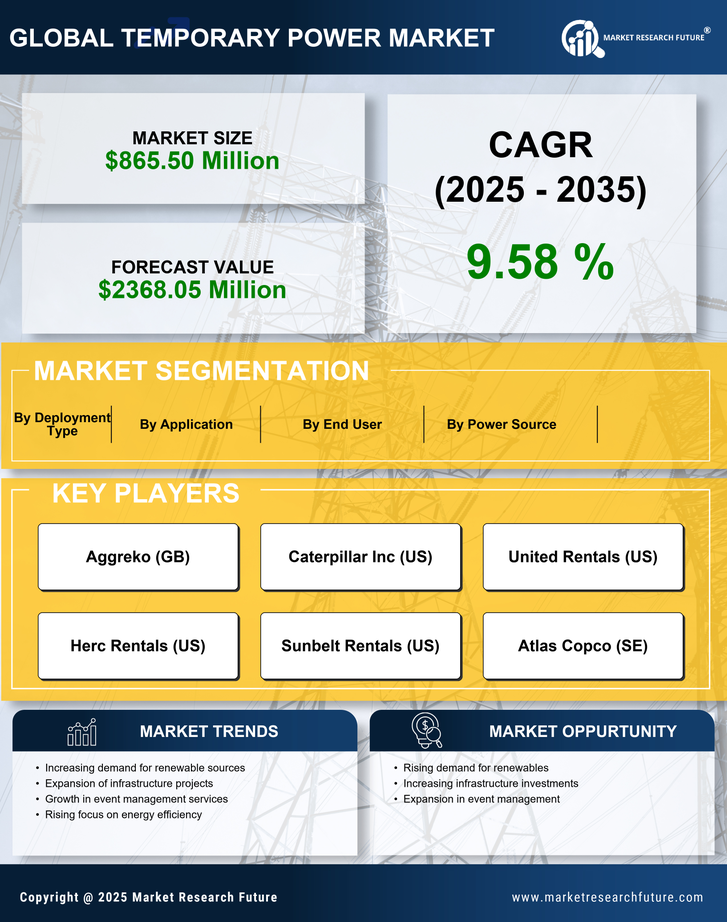
US Temporary Power Market By Application (USD Million, 2025-2035)
- Events
- Construction
- Emergency Services
- Industrial
US Temporary Power Market By Power Source (USD Million, 2025-2035)
- Diesel Generator
- Gas Generator
- Solar Generator
- Hybrid Generator
US Temporary Power Market By End User (USD Million, 2025-2035)
- Residential
- Commercial
- Government
US Temporary Power Market By Deployment Type (USD Million, 2025-2035)
- Portable
- Stationary
- Mobile