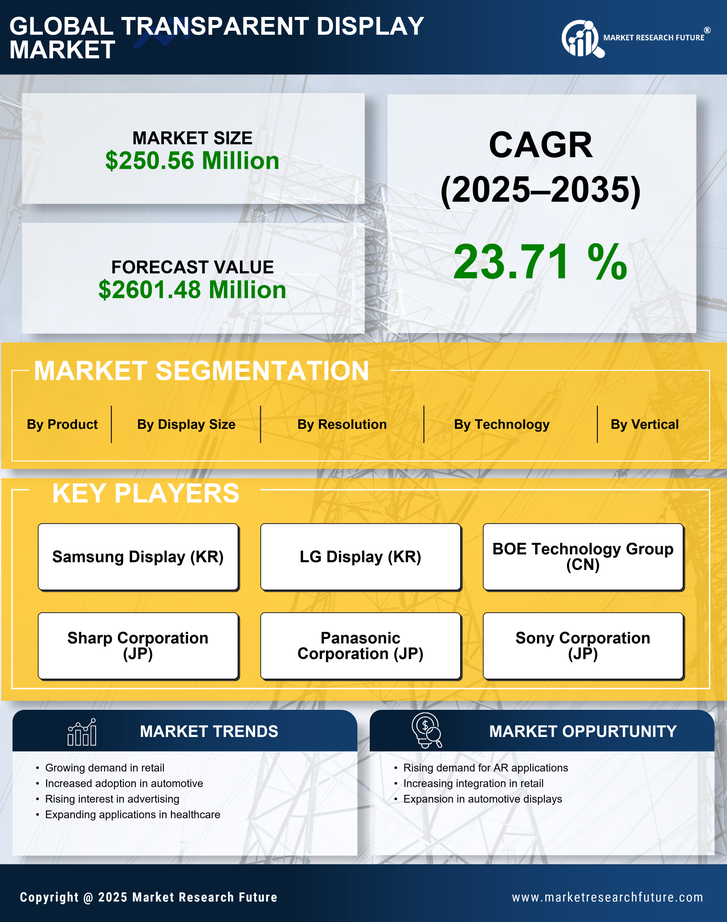
Request Free Sample ×

Kindly complete the form below to receive a free sample of this Report

* Please use a valid business email

Leading companies partner with us for data-driven Insights

clients tt-cursor
Hero Background

US Transparent Display Market

ID: MRFR/SEM/12783-HCR
100 Pages
Ankit Gupta
Last Updated: April 24, 2026
US Transparent Display Market Size, Share and Research Report By Technology (LCD, OLED, Others), By Display Size (Small & Medium, Large), and by Region- Industry Forecast Till 2035
Download PDF ×

We do not share your information with anyone. However, we may send you emails based on your report interest from time to time. You may contact us at any time to opt-out.

  1. 1 SECTION I: EXECUTIVE SUMMARY AND KEY HIGHLIGHTS
    1. 1.1 EXECUTIVE SUMMARY
      1. 1.1.1 Market Overview
      2. 1.1.2 Key Findings
      3. 1.1.3 Market Segmentation
      4. 1.1.4 Competitive Landscape
      5. 1.1.5 Challenges and Opportunities
      6. 1.1.6 Future Outlook
  2. 2 SECTION II: SCOPING, METHODOLOGY AND MARKET STRUCTURE
    1. 2.1 MARKET INTRODUCTION
      1. 2.1.1 Definition
      2. 2.1.2 Scope of the study
        1. 2.1.2.1 Research Objective
        2. 2.1.2.2 Assumption
        3. 2.1.2.3 Limitations
    2. 2.2 RESEARCH METHODOLOGY
      1. 2.2.1 Overview
      2. 2.2.2 Data Mining
      3. 2.2.3 Secondary Research
      4. 2.2.4 Primary Research
        1. 2.2.4.1 Primary Interviews and Information Gathering Process
        2. 2.2.4.2 Breakdown of Primary Respondents
      5. 2.2.5 Forecasting Model
      6. 2.2.6 Market Size Estimation
        1. 2.2.6.1 Bottom-Up Approach
        2. 2.2.6.2 Top-Down Approach
      7. 2.2.7 Data Triangulation
      8. 2.2.8 Validation
  3. 3 SECTION III: QUALITATIVE ANALYSIS
    1. 3.1 MARKET DYNAMICS
      1. 3.1.1 Overview
      2. 3.1.2 Drivers
      3. 3.1.3 Restraints
      4. 3.1.4 Opportunities
    2. 3.2 MARKET FACTOR ANALYSIS
      1. 3.2.1 Value chain Analysis
      2. 3.2.2 Porter's Five Forces Analysis
        1. 3.2.2.1 Bargaining Power of Suppliers
        2. 3.2.2.2 Bargaining Power of Buyers
        3. 3.2.2.3 Threat of New Entrants
        4. 3.2.2.4 Threat of Substitutes
        5. 3.2.2.5 Intensity of Rivalry
      3. 3.2.3 COVID-19 Impact Analysis
        1. 3.2.3.1 Market Impact Analysis
        2. 3.2.3.2 Regional Impact
        3. 3.2.3.3 Opportunity and Threat Analysis
  4. 4 SECTION IV: QUANTITATIVE ANALYSIS
    1. 4.1 Semiconductor & Electronics, BY Display Size (USD Million)
      1. 4.1.1 Small & Medium
      2. 4.1.2 Large
    2. 4.2 Semiconductor & Electronics, BY Technology (USD Million)
      1. 4.2.1 LCD
      2. 4.2.2 OLED
      3. 4.2.3 Others
    3. 4.3 Semiconductor & Electronics, BY Resolution (USD Million)
      1. 4.3.1 Ultra HD
      2. 4.3.2 Full HD
      3. 4.3.3 HD
    4. 4.4 Semiconductor & Electronics, BY Product (USD Million)
      1. 4.4.1 Head-Mounted Display
      2. 4.4.2 Head-Up Display
      3. 4.4.3 Digital Signage
      4. 4.4.4 Smart Appliance
      5. 4.4.5 Others
    5. 4.5 Semiconductor & Electronics, BY Vertical (USD Million)
      1. 4.5.1 Consumer
      2. 4.5.2 Retail & Hospitality
      3. 4.5.3 Sports & Entertainment
      4. 4.5.4 Healthcare
      5. 4.5.5 Aerospace & Defense
      6. 4.5.6 Automotive & Transportation
      7. 4.5.7 Others
  5. 5 SECTION V: COMPETITIVE ANALYSIS
    1. 5.1 Competitive Landscape
      1. 5.1.1 Overview
      2. 5.1.2 Competitive Analysis
      3. 5.1.3 Market share Analysis
      4. 5.1.4 Major Growth Strategy in the Semiconductor & Electronics
      5. 5.1.5 Competitive Benchmarking
      6. 5.1.6 Leading Players in Terms of Number of Developments in the Semiconductor & Electronics
      7. 5.1.7 Key developments and growth strategies
        1. 5.1.7.1 New Product Launch/Service Deployment
        2. 5.1.7.2 Merger & Acquisitions
        3. 5.1.7.3 Joint Ventures
      8. 5.1.8 Major Players Financial Matrix
        1. 5.1.8.1 Sales and Operating Income
        2. 5.1.8.2 Major Players R&D Expenditure. 2023
    2. 5.2 Company Profiles
      1. 5.2.1 Samsung Display (KR)
        1. 5.2.1.1 Financial Overview
        2. 5.2.1.2 Products Offered
        3. 5.2.1.3 Key Developments
        4. 5.2.1.4 SWOT Analysis
        5. 5.2.1.5 Key Strategies
      2. 5.2.2 LG Display (KR)
        1. 5.2.2.1 Financial Overview
        2. 5.2.2.2 Products Offered
        3. 5.2.2.3 Key Developments
        4. 5.2.2.4 SWOT Analysis
        5. 5.2.2.5 Key Strategies
      3. 5.2.3 BOE Technology Group (CN)
        1. 5.2.3.1 Financial Overview
        2. 5.2.3.2 Products Offered
        3. 5.2.3.3 Key Developments
        4. 5.2.3.4 SWOT Analysis
        5. 5.2.3.5 Key Strategies
      4. 5.2.4 Sharp Corporation (JP)
        1. 5.2.4.1 Financial Overview
        2. 5.2.4.2 Products Offered
        3. 5.2.4.3 Key Developments
        4. 5.2.4.4 SWOT Analysis
        5. 5.2.4.5 Key Strategies
      5. 5.2.5 Panasonic Corporation (JP)
        1. 5.2.5.1 Financial Overview
        2. 5.2.5.2 Products Offered
        3. 5.2.5.3 Key Developments
        4. 5.2.5.4 SWOT Analysis
        5. 5.2.5.5 Key Strategies
      6. 5.2.6 Sony Corporation (JP)
        1. 5.2.6.1 Financial Overview
        2. 5.2.6.2 Products Offered
        3. 5.2.6.3 Key Developments
        4. 5.2.6.4 SWOT Analysis
        5. 5.2.6.5 Key Strategies
      7. 5.2.7 Visionox Technology (CN)
        1. 5.2.7.1 Financial Overview
        2. 5.2.7.2 Products Offered
        3. 5.2.7.3 Key Developments
        4. 5.2.7.4 SWOT Analysis
        5. 5.2.7.5 Key Strategies
      8. 5.2.8 AU Optronics (TW)
        1. 5.2.8.1 Financial Overview
        2. 5.2.8.2 Products Offered
        3. 5.2.8.3 Key Developments
        4. 5.2.8.4 SWOT Analysis
        5. 5.2.8.5 Key Strategies
      9. 5.2.9 E Ink Holdings (TW)
        1. 5.2.9.1 Financial Overview
        2. 5.2.9.2 Products Offered
        3. 5.2.9.3 Key Developments
        4. 5.2.9.4 SWOT Analysis
        5. 5.2.9.5 Key Strategies
    3. 5.3 Appendix
      1. 5.3.1 References
      2. 5.3.2 Related Reports
  6. 6 LIST OF FIGURES
    1. 6.1 MARKET SYNOPSIS
    2. 6.2 US MARKET ANALYSIS BY DISPLAY SIZE
    3. 6.3 US MARKET ANALYSIS BY TECHNOLOGY
    4. 6.4 US MARKET ANALYSIS BY RESOLUTION
    5. 6.5 US MARKET ANALYSIS BY PRODUCT
    6. 6.6 US MARKET ANALYSIS BY VERTICAL
    7. 6.7 KEY BUYING CRITERIA OF SEMICONDUCTOR & ELECTRONICS
    8. 6.8 RESEARCH PROCESS OF MRFR
    9. 6.9 DRO ANALYSIS OF SEMICONDUCTOR & ELECTRONICS
    10. 6.10 DRIVERS IMPACT ANALYSIS: SEMICONDUCTOR & ELECTRONICS
    11. 6.11 RESTRAINTS IMPACT ANALYSIS: SEMICONDUCTOR & ELECTRONICS
    12. 6.12 SUPPLY / VALUE CHAIN: SEMICONDUCTOR & ELECTRONICS
    13. 6.13 SEMICONDUCTOR & ELECTRONICS, BY DISPLAY SIZE, 2024 (% SHARE)
    14. 6.14 SEMICONDUCTOR & ELECTRONICS, BY DISPLAY SIZE, 2024 TO 2035 (USD Million)
    15. 6.15 SEMICONDUCTOR & ELECTRONICS, BY TECHNOLOGY, 2024 (% SHARE)
    16. 6.16 SEMICONDUCTOR & ELECTRONICS, BY TECHNOLOGY, 2024 TO 2035 (USD Million)
    17. 6.17 SEMICONDUCTOR & ELECTRONICS, BY RESOLUTION, 2024 (% SHARE)
    18. 6.18 SEMICONDUCTOR & ELECTRONICS, BY RESOLUTION, 2024 TO 2035 (USD Million)
    19. 6.19 SEMICONDUCTOR & ELECTRONICS, BY PRODUCT, 2024 (% SHARE)
    20. 6.20 SEMICONDUCTOR & ELECTRONICS, BY PRODUCT, 2024 TO 2035 (USD Million)
    21. 6.21 SEMICONDUCTOR & ELECTRONICS, BY VERTICAL, 2024 (% SHARE)
    22. 6.22 SEMICONDUCTOR & ELECTRONICS, BY VERTICAL, 2024 TO 2035 (USD Million)
    23. 6.23 BENCHMARKING OF MAJOR COMPETITORS
  7. 7 LIST OF TABLES
    1. 7.1 LIST OF ASSUMPTIONS
  8. 7.1.1
    1. 7.2 US MARKET SIZE ESTIMATES; FORECAST
      1. 7.2.1 BY DISPLAY SIZE, 2025-2035 (USD Million)
      2. 7.2.2 BY TECHNOLOGY, 2025-2035 (USD Million)
      3. 7.2.3 BY RESOLUTION, 2025-2035 (USD Million)
      4. 7.2.4 BY PRODUCT, 2025-2035 (USD Million)
      5. 7.2.5 BY VERTICAL, 2025-2035 (USD Million)
    2. 7.3 PRODUCT LAUNCH/PRODUCT DEVELOPMENT/APPROVAL
  9. 7.3.1
    1. 7.4 ACQUISITION/PARTNERSHIP
  10. 7.4.1

US Semiconductor & Electronics Market Segmentation

Semiconductor & Electronics By Display Size (USD Million, 2025-2035)

  • Small & Medium
  • Large

Semiconductor & Electronics By Technology (USD Million, 2025-2035)

  • LCD
  • OLED
  • Others

Semiconductor & Electronics By Resolution (USD Million, 2025-2035)

  • Ultra HD
  • Full HD
  • HD

Semiconductor & Electronics By Product (USD Million, 2025-2035)

  • Head-Mounted Display
  • Head-Up Display
  • Digital Signage
  • Smart Appliance
  • Others

Semiconductor & Electronics By Vertical (USD Million, 2025-2035)

  • Consumer
  • Retail & Hospitality
  • Sports & Entertainment
  • Healthcare
  • Aerospace & Defense
  • Automotive & Transportation
  • Others