Request Free Sample ×

Kindly complete the form below to receive a free sample of this Report

* Please use a valid business email

Leading companies partner with us for data-driven Insights

clients tt-cursor
Hero Background

US Virtual Power Plant Market

ID: MRFR/EnP/14863-HCR
100 Pages
Snehal Singh
Last Updated: April 06, 2026
US Virtual Power Plant Market Research Report By Technology (Demand Response, Distributed Generation, Energy Storage, Renewable Energy Integration), By Type (Hybrid Virtual Power Plant, Conventional Virtual Power Plant, Software-Defined Virtual Power Plant), By End Use (Residential, Commercial, Industrial) and By Control Mechanism (Centralized Control, Decentralized Control, Cloud-Based Control) - Forecast to 2035
Download PDF ×

We do not share your information with anyone. However, we may send you emails based on your report interest from time to time. You may contact us at any time to opt-out.

  1. 1 SECTION I: EXECUTIVE SUMMARY AND KEY HIGHLIGHTS
    1. 1.1 EXECUTIVE SUMMARY
      1. 1.1.1 Market Overview
      2. 1.1.2 Key Findings
      3. 1.1.3 Market Segmentation
      4. 1.1.4 Competitive Landscape
      5. 1.1.5 Challenges and Opportunities
      6. 1.1.6 Future Outlook
  2. 2 SECTION II: SCOPING, METHODOLOGY AND MARKET STRUCTURE
    1. 2.1 MARKET INTRODUCTION
      1. 2.1.1 Definition
      2. 2.1.2 Scope of the study
        1. 2.1.2.1 Research Objective
        2. 2.1.2.2 Assumption
        3. 2.1.2.3 Limitations
    2. 2.2 RESEARCH METHODOLOGY
      1. 2.2.1 Overview
      2. 2.2.2 Data Mining
      3. 2.2.3 Secondary Research
      4. 2.2.4 Primary Research
        1. 2.2.4.1 Primary Interviews and Information Gathering Process
        2. 2.2.4.2 Breakdown of Primary Respondents
      5. 2.2.5 Forecasting Model
      6. 2.2.6 Market Size Estimation
        1. 2.2.6.1 Bottom-Up Approach
        2. 2.2.6.2 Top-Down Approach
      7. 2.2.7 Data Triangulation
      8. 2.2.8 Validation
  3. 3 SECTION III: QUALITATIVE ANALYSIS
    1. 3.1 MARKET DYNAMICS
      1. 3.1.1 Overview
      2. 3.1.2 Drivers
      3. 3.1.3 Restraints
      4. 3.1.4 Opportunities
    2. 3.2 MARKET FACTOR ANALYSIS
      1. 3.2.1 Value chain Analysis
      2. 3.2.2 Porter's Five Forces Analysis
        1. 3.2.2.1 Bargaining Power of Suppliers
        2. 3.2.2.2 Bargaining Power of Buyers
        3. 3.2.2.3 Threat of New Entrants
        4. 3.2.2.4 Threat of Substitutes
        5. 3.2.2.5 Intensity of Rivalry
      3. 3.2.3 COVID-19 Impact Analysis
        1. 3.2.3.1 Market Impact Analysis
        2. 3.2.3.2 Regional Impact
        3. 3.2.3.3 Opportunity and Threat Analysis
  4. 4 SECTION IV: QUANTITATIVE ANALYSIS
    1. 4.1 Construction, BY Technology (USD Million)
      1. 4.1.1 Demand Response
      2. 4.1.2 Distributed Generation
      3. 4.1.3 Energy Storage
      4. 4.1.4 Renewable Energy Integration
    2. 4.2 Construction, BY Type (USD Million)
      1. 4.2.1 Hybrid Virtual Power Plant
      2. 4.2.2 Conventional Virtual Power Plant
      3. 4.2.3 Software-Defined Virtual Power Plant
    3. 4.3 Construction, BY End Use (USD Million)
      1. 4.3.1 Residential
      2. 4.3.2 Commercial
      3. 4.3.3 Industrial
    4. 4.4 Construction, BY Control Mechanism (USD Million)
      1. 4.4.1 Centralized Control
      2. 4.4.2 Decentralized Control
      3. 4.4.3 Cloud-Based Control
  5. 5 SECTION V: COMPETITIVE ANALYSIS
    1. 5.1 Competitive Landscape
      1. 5.1.1 Overview
      2. 5.1.2 Competitive Analysis
      3. 5.1.3 Market share Analysis
      4. 5.1.4 Major Growth Strategy in the Construction
      5. 5.1.5 Competitive Benchmarking
      6. 5.1.6 Leading Players in Terms of Number of Developments in the Construction
      7. 5.1.7 Key developments and growth strategies
        1. 5.1.7.1 New Product Launch/Service Deployment
        2. 5.1.7.2 Merger & Acquisitions
        3. 5.1.7.3 Joint Ventures
      8. 5.1.8 Major Players Financial Matrix
        1. 5.1.8.1 Sales and Operating Income
        2. 5.1.8.2 Major Players R&D Expenditure. 2023
    2. 5.2 Company Profiles
      1. 5.2.1 NextEra Energy (US)
        1. 5.2.1.1 Financial Overview
        2. 5.2.1.2 Products Offered
        3. 5.2.1.3 Key Developments
        4. 5.2.1.4 SWOT Analysis
        5. 5.2.1.5 Key Strategies
      2. 5.2.2 Enel X (IT)
        1. 5.2.2.1 Financial Overview
        2. 5.2.2.2 Products Offered
        3. 5.2.2.3 Key Developments
        4. 5.2.2.4 SWOT Analysis
        5. 5.2.2.5 Key Strategies
      3. 5.2.3 Siemens AG (DE)
        1. 5.2.3.1 Financial Overview
        2. 5.2.3.2 Products Offered
        3. 5.2.3.3 Key Developments
        4. 5.2.3.4 SWOT Analysis
        5. 5.2.3.5 Key Strategies
      4. 5.2.4 Schneider Electric (FR)
        1. 5.2.4.1 Financial Overview
        2. 5.2.4.2 Products Offered
        3. 5.2.4.3 Key Developments
        4. 5.2.4.4 SWOT Analysis
        5. 5.2.4.5 Key Strategies
      5. 5.2.5 Engie (FR)
        1. 5.2.5.1 Financial Overview
        2. 5.2.5.2 Products Offered
        3. 5.2.5.3 Key Developments
        4. 5.2.5.4 SWOT Analysis
        5. 5.2.5.5 Key Strategies
      6. 5.2.6 RWE AG (DE)
        1. 5.2.6.1 Financial Overview
        2. 5.2.6.2 Products Offered
        3. 5.2.6.3 Key Developments
        4. 5.2.6.4 SWOT Analysis
        5. 5.2.6.5 Key Strategies
      7. 5.2.7 E.ON SE (DE)
        1. 5.2.7.1 Financial Overview
        2. 5.2.7.2 Products Offered
        3. 5.2.7.3 Key Developments
        4. 5.2.7.4 SWOT Analysis
        5. 5.2.7.5 Key Strategies
      8. 5.2.8 Octopus Energy (GB)
        1. 5.2.8.1 Financial Overview
        2. 5.2.8.2 Products Offered
        3. 5.2.8.3 Key Developments
        4. 5.2.8.4 SWOT Analysis
        5. 5.2.8.5 Key Strategies
    3. 5.3 Appendix
      1. 5.3.1 References
      2. 5.3.2 Related Reports
  6. 6 LIST OF FIGURES
    1. 6.1 MARKET SYNOPSIS
    2. 6.2 US MARKET ANALYSIS BY TECHNOLOGY
    3. 6.3 US MARKET ANALYSIS BY TYPE
    4. 6.4 US MARKET ANALYSIS BY END USE
    5. 6.5 US MARKET ANALYSIS BY CONTROL MECHANISM
    6. 6.6 KEY BUYING CRITERIA OF CONSTRUCTION
    7. 6.7 RESEARCH PROCESS OF MRFR
    8. 6.8 DRO ANALYSIS OF CONSTRUCTION
    9. 6.9 DRIVERS IMPACT ANALYSIS: CONSTRUCTION
    10. 6.10 RESTRAINTS IMPACT ANALYSIS: CONSTRUCTION
    11. 6.11 SUPPLY / VALUE CHAIN: CONSTRUCTION
    12. 6.12 CONSTRUCTION, BY TECHNOLOGY, 2024 (% SHARE)
    13. 6.13 CONSTRUCTION, BY TECHNOLOGY, 2024 TO 2035 (USD Million)
    14. 6.14 CONSTRUCTION, BY TYPE, 2024 (% SHARE)
    15. 6.15 CONSTRUCTION, BY TYPE, 2024 TO 2035 (USD Million)
    16. 6.16 CONSTRUCTION, BY END USE, 2024 (% SHARE)
    17. 6.17 CONSTRUCTION, BY END USE, 2024 TO 2035 (USD Million)
    18. 6.18 CONSTRUCTION, BY CONTROL MECHANISM, 2024 (% SHARE)
    19. 6.19 CONSTRUCTION, BY CONTROL MECHANISM, 2024 TO 2035 (USD Million)
    20. 6.20 BENCHMARKING OF MAJOR COMPETITORS
  7. 7 LIST OF TABLES
    1. 7.1 LIST OF ASSUMPTIONS
  8. 7.1.1
    1. 7.2 US MARKET SIZE ESTIMATES; FORECAST
      1. 7.2.1 BY TECHNOLOGY, 2025-2035 (USD Million)
      2. 7.2.2 BY TYPE, 2025-2035 (USD Million)
      3. 7.2.3 BY END USE, 2025-2035 (USD Million)
      4. 7.2.4 BY CONTROL MECHANISM, 2025-2035 (USD Million)
    2. 7.3 PRODUCT LAUNCH/PRODUCT DEVELOPMENT/APPROVAL
  9. 7.3.1
    1. 7.4 ACQUISITION/PARTNERSHIP
  10. 7.4.1

US Construction Market Segmentation

Construction By Technology (USD Million, 2025-2035)
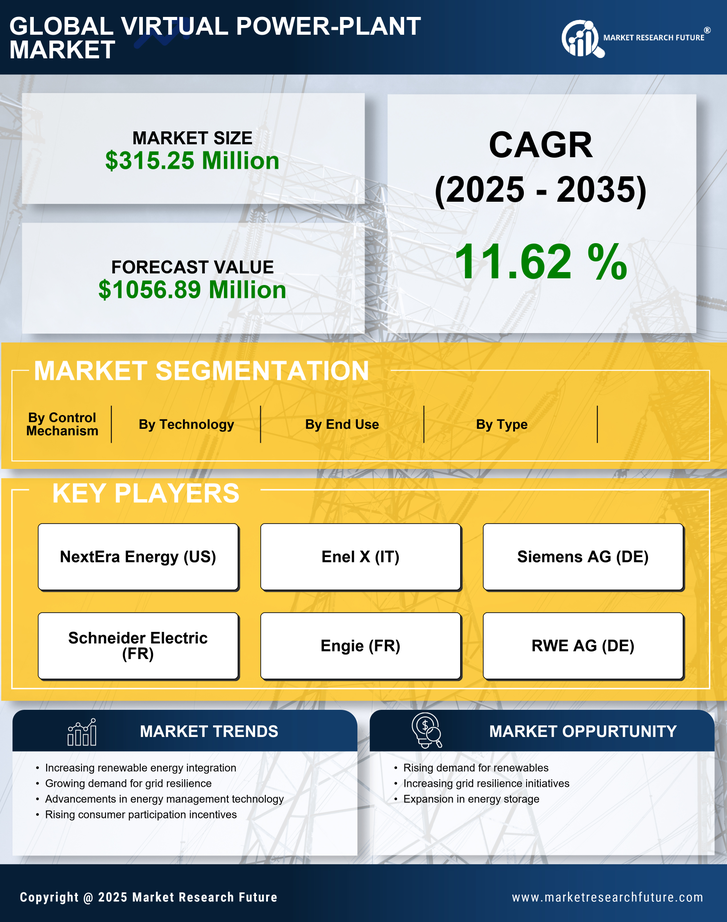
  • Demand Response
  • Distributed Generation
  • Energy Storage
  • Renewable Energy Integration

Construction By Type (USD Million, 2025-2035)

  • Hybrid Virtual Power Plant
  • Conventional Virtual Power Plant
  • Software-Defined Virtual Power Plant

Construction By End Use (USD Million, 2025-2035)

  • Residential
  • Commercial
  • Industrial

Construction By Control Mechanism (USD Million, 2025-2035)

  • Centralized Control
  • Decentralized Control
  • Cloud-Based Control