Utility Asset Management Market

ID: MRFR/ICT/3946-HCR
111 Pages
Ankit Gupta
Last Updated: June 22, 2026
Utility Asset Management Market Size, Share and Research Report: By Application (Transformer, Sub-Station, Transmission, and Distribution Lines), By Component (Hardware (sensors, infrared cameras, others) and Software (Equipment/component management, performance management, production management)), By Utility Type (Public Utility and Private Utility) And By Region (North America, Europe, Asia-Pacific, And Rest Of The World) –Market Forecast Till 2035
Download PDF ×

We do not share your information with anyone. However, we may send you emails based on your report interest from time to time. You may contact us at any time to opt-out.

  1. 1 Market Overview |
    1. 1.1 Study Assumptions & Market Definition |
    2. 1.2 Scope of the Study |
    3. 1.3 Research Methodology
  2. 2 Market Summary & Key Takeaways
  3. 3 Market Dynamics |
    1. 3.1 Market Drivers Analysis | |
      1. 3.1.1 Aging Grid Infrastructure Mandates | |
      2. 3.1.2 Performance-Based Ratemaking Incentives | |
      3. 3.1.3 IoT Sensor Proliferation and Real-Time Monitoring | |
      4. 3.1.4 AI/ML Predictive Maintenance Adoption | |
      5. 3.1.5 Renewable Integration Complexity | |
      6. 3.1.6 Cloud Migration Economics | |
      7. 3.1.7 Cybersecurity Compliance Requirements |
    2. 3.2 Market Restraints Analysis | |
      1. 3.2.1 Legacy OT/SCADA Integration Complexity | |
      2. 3.2.2 Data Governance & Interoperability Gaps | |
      3. 3.2.3 Skilled Workforce Shortage | |
      4. 3.2.4 Municipal/Co-op Budget Constraints | |
      5. 3.2.5 Cybersecurity Risks of Connected Assets |
    3. 3.3 Market Opportunity Analysis | |
      1. 3.3.1 Digital Twin Adoption for Substation Lifecycle Optimization | |
      2. 3.3.2 Emerging-Market Grid Build-Out in Southeast Asia and Africa | |
      3. 3.3.3 Data Monetization Through Asset Performance Benchmarking | |
      4. 3.3.4 Edge Computing for Real-Time Distribution Decisions | |
      5. 3.3.5 ESG-Driven Asset Transparency and Carbon Tracking |
    4. 3.4 Industry Value Chain Analysis |
    5. 3.5 Porter's Five Forces Analysis
  4. 4 Global Utility Asset Management Market Size & Forecast (2021–2035) |
    1. 4.1 Historical Market Size (2021–2025) |
    2. 4.2 Current & Forecast Market Size (2026–2035) |
    3. 4.3 Market Size by Revenue (USD Billion) |
    4. 4.4 Year-over-Year Growth Analysis
  5. 5 Segmentation Analysis |
    1. 5.1 By Component | |
      1. 5.1.1 Hardware | |
      2. 5.1.2 Software | |
      3. 5.1.3 Services |
    2. 5.2 By Deployment Mode | |
      1. 5.2.1 Cloud | |
      2. 5.2.2 On-Premise | |
      3. 5.2.3 Hybrid/Edge |
    3. 5.3 By Utility Type | |
      1. 5.3.1 Public Utilities | |
      2. 5.3.2 Private Utilities |
    4. 5.4 By Application | |
      1. 5.4.1 Transformers | |
      2. 5.4.2 Sub-Stations | |
      3. 5.4.3 Transmission and Distribution Network | |
      4. 5.4.4 Generation Assets
  6. 6 Regional Analysis |
    1. 6.1 North America | |
      1. 6.1.1 United States | |
      2. 6.1.2 Canada | |
      3. 6.1.3 Mexico |
    2. 6.2 Europe | |
      1. 6.2.1 Germany | |
      2. 6.2.2 United Kingdom | |
      3. 6.2.3 France | |
      4. 6.2.4 Italy | |
      5. 6.2.5 Spain | |
      6. 6.2.6 Nordic Countries | |
      7. 6.2.7 Russia | |
      8. 6.2.8 Rest of Europe |
    3. 6.3 Asia-Pacific | |
      1. 6.3.1 China | |
      2. 6.3.2 India | |
      3. 6.3.3 Japan | |
      4. 6.3.4 South Korea | |
      5. 6.3.5 ASEAN | |
      6. 6.3.6 Rest of Asia-Pacific |
    4. 6.4 South America | |
      1. 6.4.1 Brazil | |
      2. 6.4.2 Argentina | |
      3. 6.4.3 Rest of South America |
    5. 6.5 Middle East & Africa | |
      1. 6.5.1 Saudi Arabia | |
      2. 6.5.2 UAE | |
      3. 6.5.3 South Africa | |
      4. 6.5.4 Egypt | |
      5. 6.5.5 Rest of MEA
  7. 7 Competitive Landscape |
    1. 7.1 Market Share Analysis (2026) |
    2. 7.2 Competitive Benchmarking Matrix |
    3. 7.3 Company Profiles | |
      1. 7.3.1 ABB Ltd. | |
      2. 7.3.2 GE Vernova | |
      3. 7.3.3 Siemens Energy AG | |
      4. 7.3.4 Schneider Electric SE | |
      5. 7.3.5 Oracle Corporation | |
      6. 7.3.6 IBM Corporation | |
      7. 7.3.7 SAP SE | |
      8. 7.3.8 Hitachi Energy Ltd. | |
      9. 7.3.9 Emerson Electric Co. | |
      10. 7.3.10 Bentley Systems Inc.
  8. 8 Future Outlook & Strategic Recommendations (2026–2035) |
    1. 8.1 AI-Driven Autonomous Asset Operations |
    2. 8.2 Platform Economics and Vendor Consolidation |
    3. 8.3 Electrification Supercycle and Grid-Edge Complexity |
    4. 8.4 ESG Reporting as an Asset Management Catalyst
  9. 9 Recent Developments & News
  10. 10 Frequently Asked Questions (FAQs)
  11. 11 Report Scope & Methodology |
    1. 11.1 Study Period & Base Year |
    2. 11.2 Data Sources & Citations |
    3. 11.3 Abbreviations
  12. 12 LIST OF TABLES |
  13. TABLE 1 Global Utility Asset Management Market Size & Forecast, by Revenue (USD Billion), 2021–2035 |
  14. TABLE 2 Global Utility Asset Management Market — Year-over-Year Growth Analysis, 2021–2035 |
  15. TABLE 3 Driver Impact Analysis — Utility Asset Management Market |
  16. TABLE 4 Restraint Impact Analysis — Utility Asset Management Market |
  17. TABLE 5 Regional Market Share Summary, 2025 |
  18. TABLE 6 North America Utility Asset Management Market Size, by Country, 2021–2035 (USD Billion) |
  19. TABLE 7 Europe Utility Asset Management Market Size, by Country, 2021–2035 (USD Billion) |
  20. TABLE 8 Asia-Pacific Utility Asset Management Market Size, by Country, 2021–2035 (USD Billion) |
  21. TABLE 9 South America Utility Asset Management Market Size, by Country, 2021–2035 (USD Billion) |
  22. TABLE 10 Middle East & Africa Utility Asset Management Market Size, by Country, 2021–2035 (USD Billion) |
  23. TABLE 11 Global Utility Asset Management Market Size, by Component, 2021–2035 (USD Billion) |
  24. TABLE 12 Global Utility Asset Management Market Size, by Deployment Mode, 2021–2035 (USD Billion) |
  25. TABLE 13 Global Utility Asset Management Market Size, by Utility Type, 2021–2035 (USD Billion) |
  26. TABLE 14 Global Utility Asset Management Market Size, by Application, 2021–2035 (USD Billion) |
  27. TABLE 15 Competitive Benchmarking Matrix — Utility Asset Management Market, 2026 |
  28. TABLE 16 Company Profiles — Key Players, Utility Asset Management Market |
  29. TABLE 17 Recent Developments & Strategic Announcements, 2023–2025 |
  30. TABLE 18 North America Utility Asset Management Market Size, by Component, 2021–2035 (USD Billion) |
  31. TABLE 19 North America Utility Asset Management Market Size, by Deployment Mode, 2021–2035 (USD Billion) |
  32. TABLE 20 North America Utility Asset Management Market Size, by Utility Type, 2021–2035 (USD Billion) |
  33. TABLE 21 North America Utility Asset Management Market Size, by Application, 2021–2035 (USD Billion) |
  34. TABLE 22 Europe Utility Asset Management Market Size, by Component, 2021–2035 (USD Billion) |
  35. TABLE 23 Europe Utility Asset Management Market Size, by Deployment Mode, 2021–2035 (USD Billion) |
  36. TABLE 24 Europe Utility Asset Management Market Size, by Utility Type, 2021–2035 (USD Billion) |
  37. TABLE 25 Europe Utility Asset Management Market Size, by Application, 2021–2035 (USD Billion) |
  38. TABLE 26 Asia-Pacific Utility Asset Management Market Size, by Component, 2021–2035 (USD Billion) |
  39. TABLE 27 Asia-Pacific Utility Asset Management Market Size, by Deployment Mode, 2021–2035 (USD Billion) |
  40. TABLE 28 Asia-Pacific Utility Asset Management Market Size, by Utility Type, 2021–2035 (USD Billion) |
  41. TABLE 29 Asia-Pacific Utility Asset Management Market Size, by Application, 2021–2035 (USD Billion) |
  42. TABLE 30 South America Utility Asset Management Market Size, by Component, 2021–2035 (USD Billion) |
  43. TABLE 31 South America Utility Asset Management Market Size, by Deployment Mode, 2021–2035 (USD Billion) |
  44. TABLE 32 South America Utility Asset Management Market Size, by Utility Type, 2021–2035 (USD Billion) |
  45. TABLE 33 South America Utility Asset Management Market Size, by Application, 2021–2035 (USD Billion) |
  46. TABLE 34 Middle East & Africa Utility Asset Management Market Size, by Component, 2021–2035 (USD Billion) |
  47. TABLE 35 Middle East & Africa Utility Asset Management Market Size, by Deployment Mode, 2021–2035 (USD Billion) |
  48. TABLE 36 Middle East & Africa Utility Asset Management Market Size, by Utility Type, 2021–2035 (USD Billion) |
  49. TABLE 37 Middle East & Africa Utility Asset Management Market Size, by Application, 2021–2035 (USD Billion) |
  50. TABLE 38 Report Scope & Methodology Summary |
  51. TABLE 39 Detailed Sources and Citations
  52. 13 LIST OF FIGURES |
  53. FIGURE 1 Utility Asset Management Market Dynamics — Drivers, Restraints, Opportunities |
  54. FIGURE 2 Industry Value Chain Analysis — Utility Asset Management Market |
  55. FIGURE 3 Porter's Five Forces Analysis — Utility Asset Management Market |
  56. FIGURE 4 Global Utility Asset Management Market Size Trend, 2021–2035 (USD Billion) |
  57. FIGURE 5 Utility Asset Management Market Share, by Component, 2025 (%) |
  58. FIGURE 6 Utility Asset Management Market Share, by Deployment Mode, 2025 (%) |
  59. FIGURE 7 Utility Asset Management Market Share, by Utility Type, 2025 (%) |
  60. FIGURE 8 Utility Asset Management Market Share, by Application, 2025 (%) |
  61. FIGURE 9 Utility Asset Management Market Share, by Region, 2025 (%) |
  62. FIGURE 10 North America Utility Asset Management Market Size, 2021–2035 (USD Billion) |
  63. FIGURE 11 Europe Utility Asset Management Market Size, 2021–2035 (USD Billion) |
  64. FIGURE 12 Asia-Pacific Utility Asset Management Market Size, 2021–2035 (USD Billion) |
  65. FIGURE 13 South America Utility Asset Management Market Size, 2021–2035 (USD Billion) |
  66. FIGURE 14 Middle East & Africa Utility Asset Management Market Size, 2021–2035 (USD Billion) |
  67. FIGURE 15 Competitive Landscape — Market Share Analysis, 2026

Segmentation Quick Reference

DimensionSub-SegmentsDominant SegmentFastest Growing Segment
ComponentHardware, Software, ServicesHardware (48% share, 2025)Software (11.2% CAGR)
Deployment ModeCloud, On-Premise, Hybrid/EdgeCloud (52% share, 2025)Hybrid/Edge (13.8% CAGR)
Utility TypePublic Utilities, Private UtilitiesPublic Utilities (70% share, 2025)Private Utilities (11.9% CAGR)
ApplicationTransformers, Sub-Stations, Transmission & Distribution Network, Generation AssetsTransformers (38% share, 2025)Transmission & Distribution Network (10.6% CAGR)
RegionNorth America, Europe, Asia-Pacific, South America, Middle East & AfricaNorth America (41% share, 2025)Asia-Pacific (12.5% CAGR)


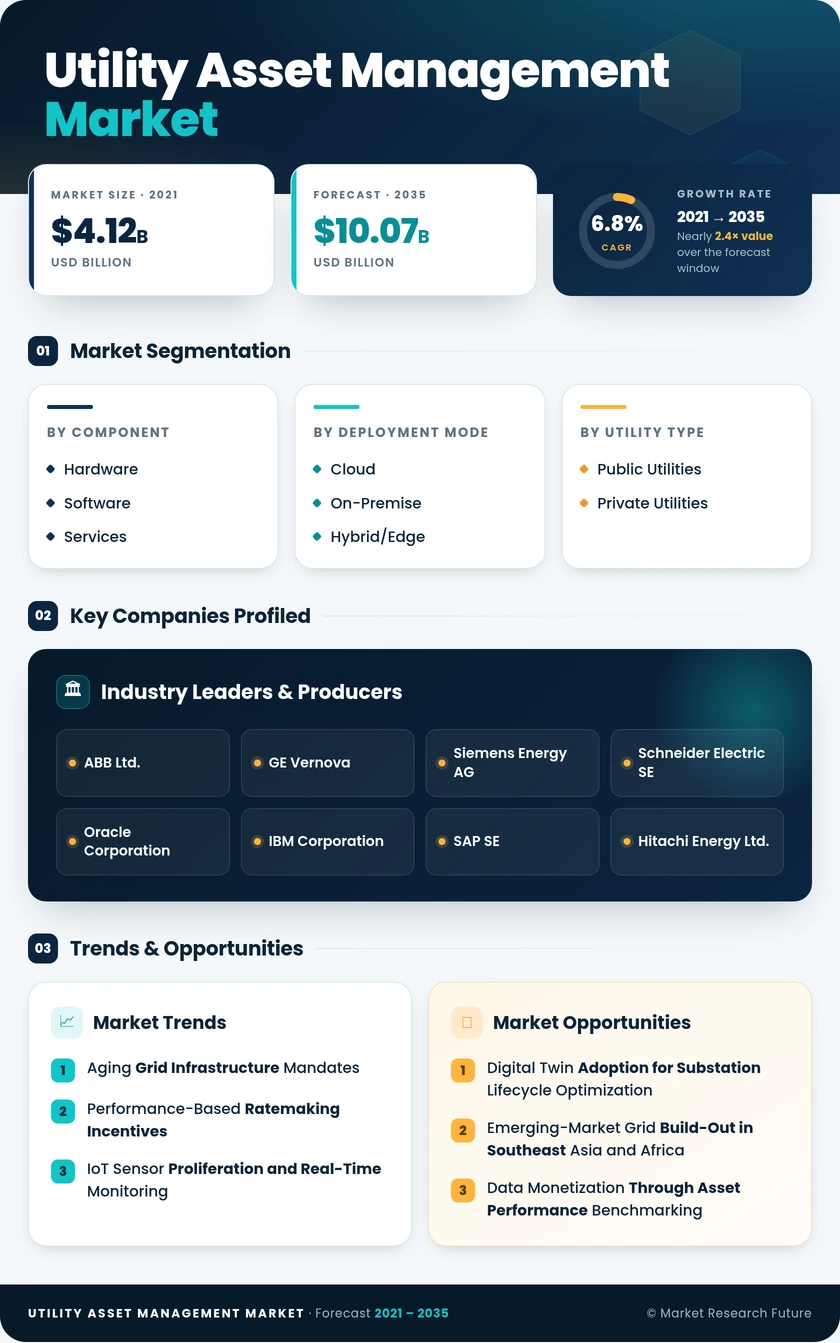
Market Segmentation Overview

By Component

Sub-SegmentKey Trend
HardwareSensor miniaturization and cost reduction driving volume deployment across aging transformer fleets
SoftwareCloud-native analytics platforms replacing legacy spreadsheet-based inspection scheduling
ServicesOutcome-based managed-service contracts linking vendor fees to avoided outage metrics


Hardware spending remains foundational as every digital asset management initiative begins with a physical sensing layer. Software is rapidly gaining share as AI-driven analytics platforms demonstrate measurable O&M savings and enable condition-based capital deferral across utility networks.

By Deployment Mode

Sub-SegmentKey Trend
CloudSaaS pricing and elastic compute attracting mid-tier and cooperative utilities
On-PremisePersistent demand from defense-adjacent and air-gapped utility environments
Hybrid/EdgeEdge gateways enabling sub-second inference at distribution-level assets


Cloud deployment dominates new procurements, but hybrid/edge architectures are emerging as the growth frontier as distribution grids absorb bidirectional power flows from DERs and EV charging.

By Utility Type

Sub-SegmentKey Trend
Public UtilitiesRate-case mandates requiring asset health index evidence fuel steady procurement
Private UtilitiesROI-driven decision-making and shorter procurement cycles accelerate adoption


Public utilities account for the majority of spend due to regulatory compliance obligations, while private operators demonstrate the fastest adoption curves driven by profit-maximization incentives.

By Application

Sub-SegmentKey Trend
TransformersDissolved-gas and bushing-capacitance monitoring deferring high-cost replacements
Sub-StationsDigital substation programs integrating protection, control, and condition monitoring
Transmission & Distribution NetworkDynamic line ratings and conductor sag analytics, unlocking latent grid capacity
Generation AssetsThermal fleet life extension and renewable O&M analytics gaining traction


Transformer monitoring leads by application share owing to the high replacement cost and long lead time of large power transformers. Transmission and distribution network monitoring is the fastest-growing application, driven by renewable interconnection queue pressures and regulatory mandates for dynamic line ratings.

By Region

Sub-SegmentKey Trend
North AmericaFERC mandates and state PBR incentives sustaining the dominant spend position
EuropeENTSO-E codes and RIIO frameworks driving steady asset-health investment
Asia-PacificMassive transmission build-outs in China and India fueling the fastest regional growth
South AmericaANEEL concession renewals and privatization creating new procurement cycles
Middle East & AfricaVision 2030 programs and smart grid pilots expanding addressable market


North America retains the largest market share, anchored by federal and state regulatory incentives, while Asia-Pacific is poised to grow fastest as emerging economies prioritize grid reliability alongside capacity expansion.