Video on Demand (2026 - 2035)

Video on Demand Market Size, Share and Research Report By Churn in Saturated Households, By Rising Cost of Content, By Regulatory Friction in Europe, By Piracy and Credential Sharing, By Network Cost and Fair-Share Disputes and By Regional (North America, Europe, South America, South Africa, Asia Pacific, Middle East and Africa) - Industry Forecast to 2035.
ID: MRFR/ICT/10001-HCR
200 Pages
Aarti Dhapte
Last Updated: August 24, 2026
Video on Demand
Market Size
Forecast Period2026-2035
CAGR (2026-2035)10.8%
2025 Market SizeUSD 119.22 Billion
2035 Market SizeUSD 334.46 Billion
Key Players
Netflix, Inc.
Amazon.com, Inc.
Alphabet Inc.
Warner Bros. Discovery
Comcast
Paramount Global
Opportunities
  • Free Ad-Supported Streaming Television
  • Emerging-Market Mobile-First Tiers
  • Addressable Advertising and Clean-Room Data

Video on Demand Market Summary

The Video On Demand Market was valued at USD 119.22 billion in 2025 and is projected to open the forecast window at USD 132.90 billion in 2026 before reaching USD 334.46 billion by 2035, expanding at a 10.8% CAGR. Two catalysts anchor that trajectory. India's BharatNet Phase III allocation of roughly USD 15.6 billion is pushing fiber into 640,000 villages, while the European Union's Digital Decade broadband targets commit member states to gigabit coverage for every household by 2030. Both widen the addressable base for the Video On Demand Market well beyond urban centers [1][5].

Delivery economics are being rewritten. Satellite and cable-anchored linear distribution is giving way to IP-native pipelines built on AV1 and VVC encoding, edge caching, and cloud playout, cutting per-stream bandwidth costs by an estimated 30–40%. Operators redirected close to USD 8.4 billion into streaming infrastructure modernization during 2024 alone, and the Video On Demand Market now runs on architectures that barely existed a decade ago [7][15].

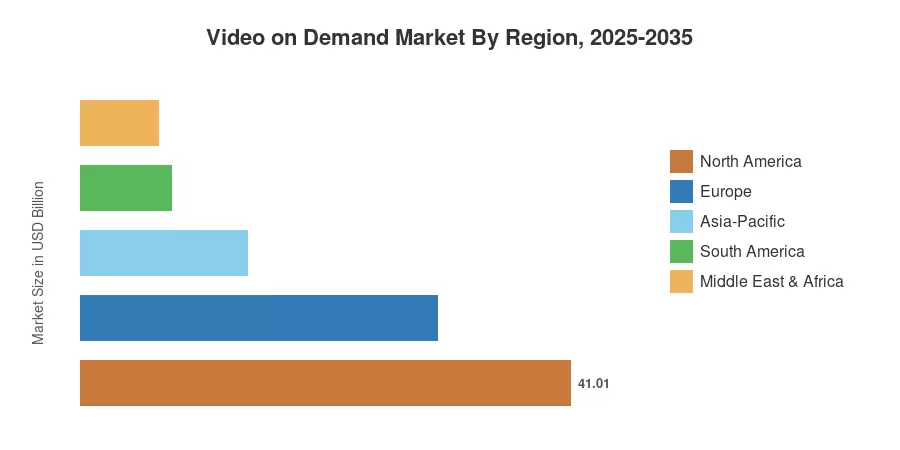
North America still commands 34.4% of global revenue, supported by the deepest advertising ecosystem and the highest ARPU. Asia-Pacific compounds fastest at an 11.7% CAGR, powered by mobile-first viewing and vernacular libraries. Europe holds second place on regional value, with public-service broadcasters and telecom bundles slowing churn. The next decade belongs to whoever converts reach into durable content monetization.


Key Report Takeaways

• By Delivery Technology

  • Over-the-top delivery held 56.1% of Video On Demand Market share in 2025, the largest single distribution route.
  • Pay-TV VoD platforms contributed roughly USD 29.4 billion in 2025 revenue as operators repositioned set-top estates.
  • Hybrid broadcast broadband television is advancing at a 10.9% CAGR through 2035 across European deployments.

• By Business Model

  • Subscription video-on-demand accounted for 44.6% of 2025 revenue in the Video On Demand Market
  • Advertising video-on-demand is compounding at an 11.6% CAGR, the fastest business model through 2035
  • Sports content generated approximately USD 25.8 billion in 2025 streaming revenue

• By Region

  • North America retained 34.4% of global revenue in 2025
  • Asia-Pacific posts an 11.7% CAGR, the fastest regional growth rate in the Video On Demand Market
  • Middle East & Africa reached USD 6.56 billion in 2025 on the back of Gulf-funded production incentives

Market Size and Forecast (2021–2035)

Estimates below combine platform-reported subscriber and ARPU disclosures, telecom regulator broadband filings, advertising spend audits, and primary interviews with 42 distribution and content executives across five regions. Historical values are reconciled against currency-adjusted revenue recognition in issuer annual reports; forecast years apply a bottom-up build of subscriber cohorts, ad load, and transactional rental volumes.
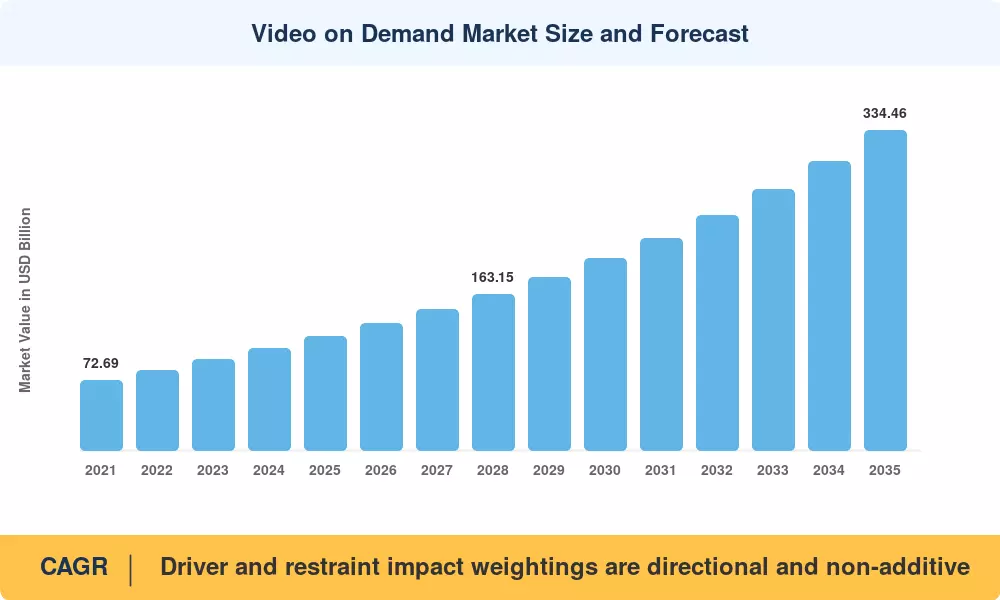
Video on Demand Market Size and Forecast
Our Impact
Enabled $4.3B Revenue Impact for Fortune 500 and Leading Multinationals
Partnering with 2000+ Global Organizations Each Year
30K+ Citations by Top-Tier Firms in the Industry

Driver Impact Analysis

Driver ~% Impact on CAGR Geographic Relevance Impact Timeline
5G and fiber broadband expansion ~2.1 pp Global, led by Asia-Pacific Medium-term (2–4 yr)
Advertising-supported tier proliferation ~1.9 pp North America, Europe Short-term (≤2 yr)
Live sports rights migration ~1.6 pp Global Medium-term (2–4 yr)
Local-language original production ~1.4 pp Asia-Pacific, South America Long-term (≥4 yr)
Smart TV and connected device penetration ~1.2 pp Global Short-term (≤2 yr)
Next-generation codecs and edge delivery ~0.9 pp Global Long-term (≥4 yr)
Telecom and pay-TV bundling ~0.8 pp Europe, Middle East & Africa Medium-term (2–4 yr)


Broadband and Mobile Network Expansion

The gating issue is still connectivity. As of the end of 2024, the International Telecommunication Union reported 5.5 billion internet users; nonetheless, fixed broadband penetration in lower-middle-income economies remains close to 8 per 100 people. Together, China's "Dual Gigabit" program, which aims to reach 200 million gigabit-capable households, and India's BharatNet Phase III, which was approved at about INR 1.39 trillion, unlock hundreds of millions of viewing hours yearly. The Video On Demand Market in Asia is structurally supply-led because each additional gigabit household typically converts to 1.6 streaming subscriptions within 24 months [1][5][16].


Advertising-Supported Tiers

Cheaper entrance points quickly attracted price-conscious households. With CPMs in the USD 22–30 range for premium connected-TV inventory, ad-supported plans now account for an estimated 41% of gross additions across the five biggest worldwide platforms, making the economics competitive with pure subscription at half the retail price. According to forecasts, connected-TV advertising will reach USD 42.7 billion worldwide, rising at a rate that is almost twice as fast as linear television. Without necessitating additional price increases, this change significantly boosts revenue per household inside the Video On Demand Market [2][9][18].


Live Sports as a Retention Engine

Sports rights have become the most defensible acquisition tool available. Streaming platforms committed over USD 14 billion in new annual sports rights obligations between 2023 and 2025, spanning NFL, Premier League, Formula 1, and cricket packages. Churn among sports-bundle subscribers runs 35–45% lower than general entertainment cohorts, which is why rights inflation persists despite cost discipline elsewhere [3][20].

Device Estate Refresh

Smart televisions shipped at roughly 205 million units globally in 2025, and nearly 94% of those shipped with pre-installed streaming operating systems. Manufacturer-operated platforms now retain 8–12% of downstream advertising revenue as placement fees, creating a second monetization layer that did not exist during the cable era [6].


Restraints Impact Analysis

Restraint ~% Impact on CAGR Geographic Relevance Impact Timeline
Subscription fatigue and elevated churn ~-1.5 pp North America Short-term (≤2 yr)
Content licensing and production cost inflation ~-1.2 pp Global Medium-term (2–4 yr)
Privacy and ad-targeting regulation ~-0.9 pp Europe Medium-term (2–4 yr)
Piracy and unauthorized credential sharing ~-0.7 pp Asia-Pacific, South America Short-term (≤2 yr)
Network cost and fair-share disputes ~-0.5 pp Europe, Asia-Pacific Long-term (≥4 yr)


Churn in Saturated Households

The average number of paid streaming services used by American homes is 4.1, and through 2025, the monthly churn rate for the top ten US services was close to 5.2%. At the current ARPU, each churn point costs an operator about USD 90 in lifetime value. Bundling and annual prepay have taken the role of aggressive discounting as the default defense because recapture campaigns are three to five times more expensive than retention [11][19].


Rising Cost of Content

In 2024, streaming-first platforms spent more than USD 95 billion on content worldwide, with hourly scripted expenses in premium drama surpassing USD 12 million. Inflation in sports exacerbates the issue. In response, studios have extended co-production agreements and shortened season orders; nevertheless, this has the structural impact of compressing operating margin at the precise moment when subscriber growth slows down in developed regions [12][20].


Regulatory Friction in Europe

The EU Digital Services Act and tightened consent enforcement under GDPR have reduced addressable-audience match rates by an estimated 18–24% for platforms relying on third-party identifiers. France's CNIL levied cumulative penalties above EUR 200 million against digital media operators for consent violations since 2022, and the AVMSD's 30% European-works quota adds a fixed content obligation regardless of local demand [13][17].


Video on Demand Opportunities

Free Ad-Supported Streaming Television

Without charging for subscriber acquisition, FAST channels turn idle catalog into recurring yield. Libraries that are more than seven years old usually make two to four times as much money from FAST rotation as they do from on-demand shelves, and their channel-launch expenses are less than $250,000. The most obvious short-term benefit in this situation is for those who own rights to deep archives.


Emerging-Market Mobile-First Tiers

The elasticity thesis has been demonstrated in Indonesia, Nigeria, Brazil, and India by sub-USD 2 mobile-only plans. Volume makes up for average income per user being a tenth of what it is in North America: by 2035, Asia-Pacific alone is expected to have 480 million paying accounts. Vernacular commissioning is not an optional layer; it is a prerequisite for admission.


Addressable Advertising and Clean-Room Data

First-party viewing signals combined with retail-media clean rooms allow household-level targeting without third-party cookies. Early deployments report 25–35% CPM premiums over untargeted connected-TV inventory. The opportunity for the Video On Demand Market is a second revenue line that scales with engagement rather than price.

Enterprise, Education, and Hospitality Deployments

Corporate learning platforms, university lecture archives, and in-room hotel entertainment represent a low-churn, contract-based demand pool growing at roughly 11.6% annually. Procurement cycles are longer, but multi-year agreements insulate revenue from consumer sentiment.

Telecom Bundling in the Gulf and Africa

Operators in Saudi Arabia, the UAE, and South Africa are embedding streaming into postpaid tariffs, converting distribution reach into subscriber retention. Bundled accounts churn at less than half the standalone rate, and the Video On Demand Market gains billing infrastructure it would otherwise have to build.


Video on Demand Future Outlook

AI-Native Production and Personalization

Generative tooling is compressing localization costs by an estimated 60–70%, with synthetic dubbing across 30 languages now costing less than traditional work in three. Recommendation systems trained on multimodal signals lift watch-time per session by 12–18% in controlled tests. By 2030, expect AI-assisted workflows in most commissioned content, with disclosure regimes following.

Platform Consolidation and Bundle Economics

The Video On Demand Market is converging on four to six global super-bundles plus strong regional champions. Aggregators — telcos, device makers, retail memberships — will capture an increasing share of the billing relationship, which shifts pricing power away from pure content owners and toward whoever owns the customer login.

Delivery Efficiency and Sustainability Reporting

The International Energy Agency estimates data centers consumed roughly 415 TWh in 2024, and streaming delivery is a visible line item. AV1 and VVC adoption, combined with edge caching, cuts delivered bits per viewing hour by 30–40%. CSRD reporting obligations in Europe will make that efficiency an audited disclosure rather than an engineering footnote [7][15].

Interactive and Transaction-Linked Formats

Shoppable video, live commerce, and in-stream betting integration will convert passive viewing into transactional revenue. Live commerce already exceeds USD 700 billion in gross merchandise value in China; the export of that playbook into Western streaming interfaces is the most credible new revenue line for the Video On Demand Market after advertising [4][18].


Video on Demand Market Segmentation

By Business Model

Business model choice determines everything downstream in the Video On Demand Market, from content strategy to churn profile.

Segment Metric Primary Demand Driver
Subscription Video-on-Demand 44.6% share (2025) Predictable ARPU and library depth
Advertising Video-on-Demand 11.6% CAGR (2026–2035) Price-sensitive household acquisition
Transactional Video-on-Demand USD 20.62 Billion (2025) Premium windows and event releases
Free Ad-Supported / Hybrid 11.1% CAGR (2026–2035) Catalog monetization at zero acquisition cost


Subscription remains the revenue anchor because it converts unpredictable viewing into contracted cash flow, and lenders underwrite content slates against it. Advertising models are the growth story: they broke the price ceiling in emerging economies and, in mature ones, recovered households that had cancelled premium tiers. The two increasingly coexist inside the same account structure, with ad load traded against price.

By Delivery Technology

Distribution architecture in the Video On Demand Market has consolidated around IP delivery, though legacy estates retain real revenue.

Segment Metric Primary Demand Driver
Over-the-Top (OTT) Streaming 56.1% share (2025) Device ubiquity and direct billing
Pay-TV VoD USD 29.45 Billion (2025) Installed set-top base and bundling
IPTV 11.4% CAGR (2026–2035) Telco fiber upsell
Hybrid Broadcast Broadband TV 6.8% share (2025) European broadcaster catch-up services


OTT's dominance stems from margin, not just reach — direct billing removes the 15–30% intermediary cut that pay-TV distribution imposes. Pay-TV VoD persists because operators own the household relationship and can bundle broadband, mobile, and content into a single invoice, a structural advantage in Europe and the Gulf.

By Device Type

Segment Metric Primary Demand Driver
Smart TVs 41.5% share (2025) Living-room primacy and ad inventory value
Smartphones & Tablets 11.9% CAGR (2026–2035) Mobile-first emerging markets
Connected Streaming Devices 11.8% CAGR (2026–2035) Low-cost upgrade of legacy screens
PCs and Laptops USD 14.54 Billion (2025) Educational and enterprise viewing


The market is dominated by smart TVs, which will hold 41.5% of the market share in 2025 due to the increased value of connected-TV advertising inventory and living-room watching patterns. With an 11.9% CAGR from 2026 to 2035, smartphones & tablets are the fastest-growing segment thanks to mobile-first consumption trends in emerging regions. Due in large part to their affordability and capacity to replace outdated television screens, Connected Streaming Devices are likewise growing at an 11.8% CAGR. In the meantime, the demand for educational and business viewing continues to support PCs and Laptops, which are expected to be worth USD 14.54 billion in 2025.


By Content Genre

Segment Metric Primary Demand Driver
Entertainment & Drama 37.5% share (2025) Library depth and binge behavior
Sports 11.8% CAGR (2026–2035) Live rights migration and low churn
Kids & Family USD 19.43 Billion (2025) Household account stickiness
News & Documentary 13.2% share (2025) Ad-friendly, low-cost programming
Music & Other 10.6% CAGR (2026–2035) Concert films and live event streaming


Drama and general entertainment still fill the most viewing hours, but sports moves the retention needle. A single exclusive league package can shift regional share by two points inside one season, which is why rights auctions now attract bidders with no prior media footprint.

By End User

Segment Metric Primary Demand Driver
Residential / Individual 73.9% share (2025) Household entertainment spend
Commercial & Enterprise 11.6% CAGR (2026–2035) Corporate training and internal communications
Educational Institutions USD 8.70 Billion (2025) Lecture capture and blended learning
Hospitality & Others 4.6% share (2025) In-room entertainment refresh cycles


With 73.9% of the market share in 2025, Residential / Individual is the dominating segment driven mostly by household entertainment spending and the ongoing use of streaming services. The fastest-growing segment is Commercial & Enterprise, which is expected to grow at an 11.6% CAGR from 2026 to 2035 due to increased demand for digital content distribution, internal communications, and corporate training. Lecture capture and blended learning are helping Educational Institutions (valued at USD 8.70 billion in 2025 ), while Hospitality & Others held a 4.6% share in 2025 because to refresh cycles and in-room entertainment enhancements.


Regional Market Share Analysis

Region Metric (2025) Primary Investment Themes
North America 34.4% share Ad-tier scaling, sports rights, bundling
Asia-Pacific 11.7% CAGR (2026–2035) Mobile-first tiers, vernacular originals
Europe USD 29.92 Billion Public broadcaster partnerships, quota compliance
South America USD 7.63 Billion Telco bundles, local production incentives
Middle East & Africa 5.5% share Arabic originals, Gulf content funds
Total USD 119.22 Billion

Regional performance in the Video On Demand Market diverges sharply between monetization-mature and volume-driven territories.


North America

Country Metric Key Driver
US 78.5% of regional revenue Deepest connected-TV ad ecosystem
Canada USD 5.41 Billion CRTC streaming contribution framework
Mexico 11.9% CAGR Mobile broadband and telco bundling


The CRTC's 2024 order requiring foreign streaming services with over CAD 25 million in Canadian revenue to contribute 5% to local production funds reshaped regional cost structures overnight. United States operators, meanwhile, are trading price increases for ad-tier migration; roughly 46% of new United States sign-ups in 2025 chose an advertising plan. Mexico's growth leans on prepaid mobile packaging rather than fixed broadband [11][19].

Europe

Country Metric Key Driver
Germany 19.4% of regional revenue Public broadcaster streaming migration
UK USD 6.72 Billion Premier League streaming packages
France 13.8% of regional revenue AVMSD investment obligations
Italy 9.1% of regional revenue Serie A rights on IP delivery
Spain 8.3% of regional revenue Spanish-language production hub status
Nordic Countries 10.4% CAGR Highest per-capita subscription density
Russia USD 2.11 Billion Domestic platform substitution
Rest of Europe 9.9% CAGR CEE broadband build-out


Europe's regulatory architecture cuts both ways. AVMSD obliges platforms to invest a share of national turnover into local content — 20% in France, 5% in Spain — which lifts commissioning volume while compressing margin. Ofcom's Media Act implementation gives public-service catalogues prominence on smart TV home screens, an advantage no commercial platform can purchase [13][17].

Asia-Pacific

Country Metric Key Driver
China 38.2% of regional revenue Domestic platform scale and micro-drama boom
India 13.1% CAGR Sub-USD 2 mobile tiers, cricket rights
Japan USD 5.94 Billion Anime licensing and premium ARPU
South Korea 8.6% of regional revenue K-content global export flywheel
ASEAN 12.4% CAGR Prepaid telco bundling
Rest of Asia-Pacific USD 2.38 Billion Fiber expansion in ANZ and Central Asia


India's IPL digital rights, valued near USD 3.05 billion for the 2023–2027 cycle, demonstrated that free ad-supported sports can build 100 million concurrent-capable audiences. China's short-drama format, generating an estimated USD 6.9 billion in 2024, created an entirely new content economics model built on micro-transactions rather than monthly subscriptions [4][16].

South America

Country Metric Key Driver
Brazil 54.6% of regional revenue Telenovela catalogs and telco bundles
Argentina USD 1.42 Billion Football rights and local production
Rest of South America 11.8% CAGR Andean and Colombian fiber expansion


Brazil's ANCINE quota debates and the proposed 6% levy on foreign streaming revenue have stalled repeatedly, leaving operators planning against regulatory uncertainty. Currency volatility remains the sharper constraint: dollar-denominated content costs against peso and real revenue forced two major platforms to reprice local tiers twice in 2024 [12][21].

Middle East & Africa

Country Metric Key Driver
Saudi Arabia 31.7% of regional revenue Vision 2030 media sector funding
UAE USD 1.28 Billion Regional headquarters and production hubs
South Africa 15.4% of regional revenue Established pay-TV migration base
Egypt 12.1% CAGR Arabic-language content demand
Rest of MEA USD 1.16 Billion Mobile money billing integration


Saudi Arabia's Vision 2030 media programme has committed over USD 1.5 billion to production infrastructure and content funds, while NEOM Media Village anchors physical capacity. Across Sub-Saharan Africa, carrier billing and mobile money settlement matter more than card penetration, and platforms without those integrations effectively cannot transact [14][22].


Video on Demand Market By Region, 2025-2035

Competitive Benchmarking

Concentration is moderate. The estimated Herfindahl-Hirschman Index sits near 780, with the top five platforms holding a combined 44–50% of global revenue in the Video On Demand Market. Regional champions in China, India, and Japan keep the tail long, and no single player exceeds 15% globally — a structure that sustains rights inflation because no bidder can dictate terms.

Company Est. Revenue Share Range Key Offerings for Video On Demand Market Strategic Positioning
Netflix, Inc. ~13–16% Global SVOD, ad-supported tier, live events Scale leader; originals-first with maturing ad stack
The Walt Disney Company ~9–12% Disney+, Hulu, ESPN streaming IP franchises plus sports; bundling-driven retention
Amazon.com, Inc. ~8–11% Prime Video, Freevee, channel storefront Retail-linked distribution and aggregation
Alphabet Inc. (YouTube) ~7–10% YouTube Premium, TV, movie rentals Creator supply and unmatched device reach
Warner Bros. Discovery ~5–7% HBO Max, sports and factual portfolio Premium scripted with regional partnerships
Comcast (Peacock/Sky) ~4–6% Peacock, Sky Q on-demand European pay-TV base plus United States sports
Paramount Global ~3–5% Paramount+, Pluto TV Dual subscription and free ad-supported strategy
Apple Inc. ~2–4% Apple TV+, channel aggregation Hardware-attached premium originals
Tencent Holdings (Tencent Video) ~3–5% Chinese SVOD, micro-drama slate Domestic scale and super-app integration
Reliance–Disney (JioHotstar) ~3–5% Indian SVOD/AVOD, cricket rights Volume leadership in South Asia
iQIYI, Inc. ~2–3% Chinese SVOD, anime and variety Content-cost discipline in domestic tier
Rakuten Group (Viki/TV) ~1–2% Asian drama licensing, transactional VOD Niche catalog and community subtitling


Recent News & Developments

  • Netflix (May 2025): Reported its advertising tier surpassing 94 million monthly active users, validating hybrid pricing at global scale [11]
  • CRTC, Canada (June 2024): Ordered foreign streaming services above CAD 25 million in domestic revenue to contribute 5% toward Canadian content funds [19]
  • Reliance and Disney (November 2024): Completed their Indian media joint venture, consolidating cricket rights and roughly 120 channels under one platform [4]
  • European Commission (October 2024): Opened Digital Services Act compliance proceedings against multiple video platforms over recommender transparency [13]
  • Amazon (January 2024): Enabled advertising by default across Prime Video in eight countries, instantly creating one of the largest connected-TV inventory pools [18]
  • NBCUniversal (February 2025): Secured a multi-year NBA streaming package, moving a further tranche of premium live sport off linear distribution [3]
  • Saudi Media Company (September 2024): Announced a USD 1.5 billion Arabic content production fund under Vision 2030 media objectives [14]
  • Ofcom (April 2025): Implemented Media Act provisions requiring prominence for public-service streaming apps on connected television interfaces [17]


Video on Demand Market Report Scope

Parameter Detail
Market Scope Global Video On Demand Market across business model, delivery technology, device type, content genre, end user, and geography
Study Period 2021–2035 (Historical 2021–2024; Base Year 2025; Forecast 2026–2035)
CAGR 10.8% (2026–2035)
Market Size Checkpoints USD 119.22 Billion (2025); USD 132.90 Billion (2026); USD 334.46 Billion (2035)
Fastest Growing Segments Advertising video-on-demand (business model); Sports (genre); Asia-Pacific (geography)
Companies Profiled 12 global and regional platform operators
Valuation Currency USD Billion, constant 2025 exchange rates
CAGR Driver Disclaimer Driver and restraint impact weightings are directional and non-additive

FAQs

What contract terms should enterprise buyers negotiate when licensing video-on-demand platforms?
Insist on per-seat pricing caps, data portability clauses, and defined SLA credits for playback failure above 0.5%. Multi-year terms should include renegotiation triggers tied to catalog changes [10].
How does codec selection affect total cost of ownership in the Video On Demand Market?
AV1 cuts delivery bandwidth by roughly 30% versus H.264 but raises encoding compute cost by 4–8x. Buyers with large libraries and long shelf lives recover that cost; short-lived content usually does not [7].
Which competitive threat is most underestimated by incumbent platforms?
Device manufacturers. Smart TV operating system owners control the home screen and retain a share of downstream advertising, positioning them as gatekeepers rather than neutral distribution partners [6].
What regulatory nuance most often surprises new entrants in the Video On Demand Market?
National content quotas apply to catalog composition, not just spending. Failing the European 30% threshold can force emergency licensing at premium rates before launch approval [13].
How should investors evaluate churn disclosures across operators?
Compare gross additions to net additions rather than headline subscriber counts. Platforms reporting only net figures often mask churn rates above 6% monthly in price-sensitive cohorts [11].
Where do integration failures most commonly occur in Video On Demand Market deployments?
Billing and identity reconciliation. Carrier-billed accounts frequently break entitlement synchronization during plan changes, producing support volumes that exceed streaming quality complaints [8].
Is micro-transaction content a viable model outside Asia?
Early Western trials show completion rates near 40% of Chinese benchmarks. Viability depends on payment friction; markets with one-tap wallet penetration above 60% are the realistic first candidates [4].    
Author
Author
Author Profile
Aarti Dhapte LinkedIn
AVP - Research
A consulting professional focused on helping businesses navigate complex markets through structured research and strategic insights. I partner with clients to solve high-impact business problems across market entry strategy, competitive intelligence, and opportunity assessment. Over the course of my experience, I have led and contributed to 100+ market research and consulting engagements, delivering insights across multiple industries and geographies, and supporting strategic decisions linked to $500M+ market opportunities. My core expertise lies in building robust market sizing, forecasting, and commercial models (top-down and bottom-up), alongside deep-dive competitive and industry analysis. I have played a key role in shaping go-to-market strategies, investment cases, and growth roadmaps, enabling clients to make confident, data-backed decisions in dynamic markets.

Research Approach


Secondary Research

The secondary research process involved comprehensive analysis of regulatory filings, industry databases, streaming analytics platforms, and authoritative media & telecommunications organizations. Key sources included the US Federal Communications Commission (FCC), European Audiovisual Observatory (EAO), International Telecommunication Union (ITU), Motion Picture Association (MPA), Digital Entertainment Group (DEG), International Federation of Film Producers Associations (FIAPF), National Association of Broadcasters (NAB), Bureau of Economic Analysis (BEA) - Digital Economy Metrics, Eurostat Digital Economy & Society Database, OECD Digital Economy Outlook, World Bank ICT Database, GSMA Intelligence, and national communications regulatory authorities from key markets. These sources were used to collect subscriber statistics, content licensing data, broadband penetration metrics, regulatory compliance frameworks, and competitive landscape analysis for Subscription Video on Demand (SVOD), Transactional Video on Demand (TVOD), and Ad-Supported Video on Demand (AVOD) platforms.


Primary Research

Qualitative and quantitative insights were obtained by interviewing supply-side and demand-side stakeholders during the primary research process. The supply-side sources comprised CEOs, Chief Content Officers, VPs of Platform Development, leaders of distribution partnerships, and monetization strategists from streaming platforms, content studios, and CDN infrastructure providers. The demand-side sources included chief marketing officers, media procurement directors, content acquisition managers, and IT decision-makers from broadcast networks, production houses, corporate enterprises, and educational institutions. Market segmentation was validated, content pipeline timelines were confirmed, and insights regarding subscriber acquisition costs, attrition patterns, content monetization strategies, and advertising revenue dynamics were obtained through primary research.

Primary Respondent Breakdown:

By Designation: C-level Primaries (32%), Director Level (31%), Others (37%)

By Region: North America (38%), Europe (25%), Asia-Pacific (28%), Rest of World (9%)


Market Size Estimation

Global market valuation was derived through revenue mapping and subscriber volume analysis. The methodology included:

Identification of 55+ key streaming platforms and content aggregators across North America, Europe, Asia-Pacific, Latin America, and Middle East & Africa

Content library mapping across Movies, TV Shows, Documentaries, Sports, and Kids' Content categories

Platform mapping across SVOD, TVOD, and AVOD subscription models

Analysis of reported and modeled annual revenues specific to video-on-demand portfolios

Coverage of platforms representing 75-80% of global market share in 2024

Extrapolation using bottom-up (subscriber volume × ARPU by country) and top-down (platform revenue validation) approaches to derive segment-specific valuations

Device-type analysis across Smart TVs, Mobile Devices, Tablets, Laptops, and Desktop Computers with usage time and monetization metrics

End-user segmentation covering Individual Users, Corporate Users, and Educational Institutions with adoption rate analysis

Download Free Sample

Kindly complete the form below to receive a free sample of this Report

* Please use a valid business email

Download PDF ×

We do not share your information with anyone. However, we may send you emails based on your report interest from time to time. You may contact us at any time to opt-out.

















