Download Free Sample
Kindly complete the form below to receive a free sample of this Report
Virtual Reality (VR) Consulting and Development Services Market Research Report: Size, Share, Trend Analysis By End Use Outlook (Enterprises, Government, Healthcare Providers, Educational Institutions, Military Organizations) By Technology Outlook (Augmented Reality, Virtual Reality, Mixed Reality, 3D Modeling, Simulation) By Application Outlook (Gaming, Healthcare, Education, Real Estate, Military) By Service Type Outlook (Consulting, Development, Integration, Support, Training) By Region (North America, Europe, APAC, South America, MEA) – Growth Outlook & Industry Forecast To 2035
As per MRFR analysis, the Virtual Reality (VR) Consulting and Development Services Market was estimated at 6.5 USD Billion in 2024. The VR consulting and development services industry is projected to grow from 7.06 USD Billion in 2025 to 16.2 USD Billion by 2035, exhibiting a compound annual growth rate (CAGR) of 8.66% during the forecast period 2025 - 2035.
The Virtual Reality (VR) Consulting and Development Services Market is experiencing robust growth driven by diverse applications across various sectors.
| 2024 Market Size | 6.5 (USD Billion) |
| 2035 Market Size | 16.2 (USD Billion) |
| CAGR (2025 - 2035) | 8.66% |
Accenture (US), Deloitte (US), Capgemini (FR), Cognizant (US), Infosys (IN), Wipro (IN), PwC (UK), HCL Technologies (IN), Tech Mahindra (IN)
Our Impact
Enabled $4.3B Revenue Impact for Fortune 500 and Leading Multinationals
Partnering with 2000+ Global Organizations Each Year
30K+ Citations by Top-Tier Firms in the Industry
The Virtual Reality (VR) Consulting and Development Services Market is currently experiencing a notable evolution, driven by advancements in technology and increasing demand across various sectors. Organizations are increasingly recognizing the potential of VR to enhance user experiences, improve training methodologies, and facilitate innovative marketing strategies. As a result, consulting services that specialize in VR development are becoming essential for businesses aiming to integrate immersive technologies into their operations. This market appears to be characterized by a diverse range of applications, from entertainment and gaming to healthcare and education, suggesting a broadening scope of influence. Moreover, the competitive landscape within the Virtual Reality (VR) Consulting and Development Services Market is intensifying, with numerous players striving to differentiate themselves through unique offerings and specialized expertise. Companies are likely to invest in research and development to create tailored solutions that meet the specific needs of their clients. This trend indicates a shift towards more personalized and effective VR solutions, which could further drive market growth. As the technology matures, the potential for collaboration between VR developers and businesses across various industries seems promising, paving the way for innovative applications that could redefine user engagement and operational efficiency.
The Virtual Reality (VR) Consulting and Development Services Market is witnessing a surge in the adoption of VR technologies for training and educational purposes. Organizations are leveraging immersive simulations to enhance learning experiences, allowing users to engage in realistic scenarios that improve retention and skill acquisition. This trend indicates a growing recognition of VR's potential to transform traditional educational methodologies.
There appears to be a significant expansion of VR applications within the healthcare sector, particularly in areas such as therapy, rehabilitation, and surgical training. Consulting services are increasingly focusing on developing VR solutions that assist medical professionals in honing their skills and providing patients with innovative treatment options. This trend suggests a promising future for VR in enhancing patient care and medical training.
The integration of artificial intelligence (AI) with VR technologies is emerging as a noteworthy trend within the Virtual Reality (VR) Consulting and Development Services Market. This convergence is likely to enhance user experiences by providing personalized interactions and adaptive learning environments. As AI capabilities continue to evolve, the potential for creating more sophisticated and responsive VR applications seems to be on the rise.
The Virtual Reality (VR) Consulting and Development Services Market is significantly influenced by advancements in hardware technology. The continuous evolution of VR headsets, sensors, and computing power is enabling more sophisticated and accessible VR experiences. As hardware becomes more affordable and user-friendly, a broader range of industries is likely to adopt VR solutions. For instance, the introduction of standalone VR headsets has made it easier for businesses to implement VR training programs without the need for extensive infrastructure. This trend suggests that as hardware technology progresses, the demand for VR consulting and development services will increase, as companies seek expert guidance on integrating these advanced technologies into their operations.
The Virtual Reality (VR) Consulting and Development Services Market is benefiting from a surge in investment directed towards VR startups. Venture capitalists and investors are increasingly recognizing the potential of VR technologies across various applications, from gaming to healthcare. This influx of capital is fostering innovation and driving the development of new VR solutions, which in turn creates a demand for consulting and development services. As startups emerge with novel ideas and applications, established companies may seek partnerships or consulting services to navigate the evolving landscape. This trend indicates a vibrant ecosystem for VR development, suggesting that the market for consulting services will likely expand as new players enter the field.
The Virtual Reality (VR) Consulting and Development Services Market is experiencing a surge in the development of remote collaboration tools. As organizations increasingly embrace remote work, the need for effective virtual collaboration solutions has become paramount. VR technologies offer innovative ways for teams to interact, share ideas, and conduct meetings in a virtual space, thereby enhancing productivity and communication. Recent statistics suggest that the market for VR collaboration tools is expected to grow at a rapid pace, as companies recognize the benefits of immersive environments for team interactions. This growth presents a significant opportunity for VR consulting and development services to provide tailored solutions that meet the unique needs of businesses seeking to improve their remote collaboration capabilities.
The Virtual Reality (VR) Consulting and Development Services Market is witnessing a notable increase in demand for immersive experiences across various sectors. Industries such as entertainment, gaming, and tourism are increasingly adopting VR technologies to enhance user engagement and create memorable experiences. According to recent data, the entertainment sector alone is projected to grow significantly, with VR experiences becoming a staple in theme parks and live events. This trend indicates a shift towards more interactive and engaging content, compelling businesses to seek specialized consulting and development services to effectively implement VR solutions. As a result, the market for VR consulting and development services is likely to expand, driven by the need for expertise in creating high-quality immersive environments.
The Virtual Reality (VR) Consulting and Development Services Market is seeing a growing interest in the use of VR for marketing and advertising purposes. Brands are increasingly leveraging VR to create immersive advertising campaigns that engage consumers in unique ways. This trend is supported by data indicating that immersive experiences can significantly enhance brand recall and customer engagement. As companies recognize the effectiveness of VR in capturing consumer attention, they are likely to invest in VR consulting and development services to create compelling marketing strategies. This shift towards immersive advertising suggests a promising avenue for growth within the VR consulting and development services market, as businesses seek to differentiate themselves in a competitive landscape.
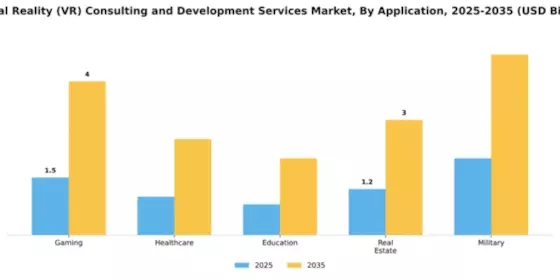
The Virtual Reality (VR) Consulting and Development Services Market is primarily driven by diverse applications across various sectors. In this landscape, the gaming segment stands as the largest, capturing a significant portion of the market share due to the increasing popularity of immersive gaming experiences. Following gaming, healthcare is emerging as a key player, leveraging VR for innovative training and therapeutic solutions, thus gaining a rapid share in market dynamics.
Gaming (Dominant) vs. Healthcare (Emerging)
The gaming segment is characterized by its dynamic and innovative nature, with VR technologies facilitating immersive experiences for players and developers alike. Its dominance is fueled by advancements in technology and consumer interest, allowing for richer storylines and interactive gameplay. Conversely, healthcare represents an emerging segment, utilizing VR for medical training, simulations, and patient therapy. The growing emphasis on personalized health solutions and rapid adoption of VR tools in medical practices positions healthcare as a vital area for growth in the VR consulting and development market.
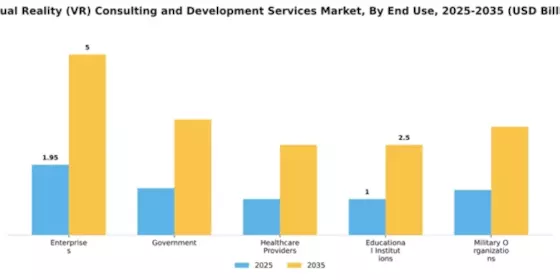
In the Virtual Reality (VR) Consulting and Development Services Market, the enterprise segment holds the largest share, driven by significant investment in immersive technologies for training and simulations. Government agencies also play a crucial role, utilizing VR to enhance public services and citizen engagement. As organizations increasingly adopt VR solutions for workforce training and operational efficiencies, enterprises remain the frontrunners in this evolving market landscape. On the other hand, healthcare providers are emerging as the fastest-growing segment, leveraging VR for patient treatment, surgical training, and rehabilitation programs. The continuous advancement of VR technology, along with increasing adoption by medical professionals, is propelling this sector's growth. Additionally, regulatory support and improved awareness of VR benefits among healthcare practitioners are further driving this trend.
Enterprise (Dominant) vs. Healthcare Providers (Emerging)
In the VR consulting and development services market, enterprises dominate with a focus on enhancing productivity and operational training through innovative solutions. This segment benefits from a large pool of resources, enabling investments in cutting-edge technology. Meanwhile, healthcare providers represent an emerging segment, rapidly integrating VR into therapeutic practices and training. They harness VR to create immersive experiences for patients, such as pain relief and anxiety reduction treatments, while also training healthcare professionals in realistic medical procedures. This dichotomy highlights how enterprises leverage VR for operational efficiency, while healthcare providers explore novel applications that are transformative for patient care.
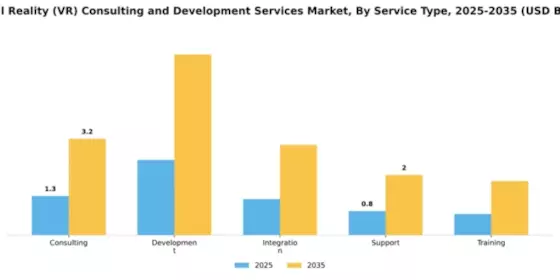
In the Virtual Reality Consulting and Development Services Market, the consulting segment holds the largest share due to its critical role in guiding businesses through the complexities of VR implementation. Consulting services help organizations to strategize and tailor VR solutions to meet their unique needs, significantly enhancing their competitive advantage. On the other hand, the development segment exhibits the fastest growth rate as more companies seek custom VR applications to engage customers and improve operational efficiencies. This segment's rapid evolution reflects the increasing adoption of VR technologies across various sectors including healthcare, education, and entertainment.
Consulting: Expertise (Dominant) vs. Development: Custom Solutions (Emerging)
The consulting segment is characterized by its focus on expertise and strategic insights, positioning itself as the most dominant service type within the VR consulting and development ecosystem. Consultants often possess deep industry knowledge that enables them to provide tailored recommendations that align technology with business goals. In contrast, the development segment is emerging rapidly, specializing in the creation of custom VR solutions that cater to specific organizational requirements. This segment thrives on innovation and agility, offering personalized experiences that enhance user engagement. As organizations increasingly recognize the potential of VR to transform their operations, both segments are pivotal in addressing the diverse needs of the market. Together, they showcase the dynamic interplay between strategic guidance and technological innovation.
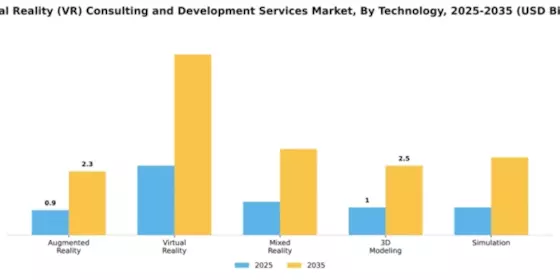
In the Virtual Reality (VR) Consulting and Development Services Market, Virtual Reality holds the largest share among technology segments, driven by increasing investments in immersive gaming and training environments. Augmented Reality, while smaller in comparison, shows rapid growth potential due to rising integration in mobile applications and retail environments, making it a segment to watch. The Mixed Reality segment is also expanding, although at a slower rate, while Simulation and 3D Modeling contribute significantly to the training and development aspect of the services market.
Technology: Virtual Reality (Dominant) vs. Augmented Reality (Emerging)
Virtual Reality has positioned itself as the dominant technology within the VR consulting and development services market. Its key strengths lie in providing fully immersive experiences for users, particularly in sectors like gaming, education, and real estate. This technology allows for a comprehensive engagement, often setting the groundwork for advanced training simulations and personal entertainment experiences. On the other hand, Augmented Reality is emerging rapidly, characterized by its ability to overlay digital information onto the real world, enhancing user interactivity and engagement. Its applications are widespread across industries like retail, where it helps in creating unique shopping experiences, and healthcare, where it aids in medical training and patient engagement.
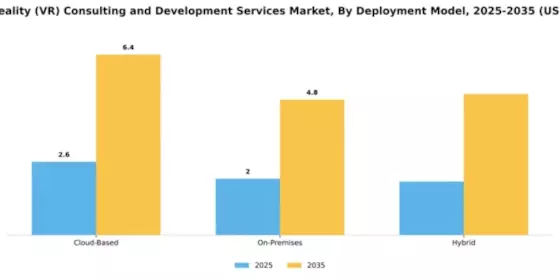
The Virtual Reality (VR) Consulting and Development Services Market is witnessing a diverse distribution among its deployment models. Cloud-based solutions have emerged as the largest segment, favored by organizations due to their scalability and ease of access. On-premises models, although still significant, are gradually being overshadowed by the flexibility offered by cloud solutions and emerging hybrid models that combine both offerings for tailored efficiency. In contrast, hybrid deployment models are rapidly becoming the fastest-growing segment as businesses seek to optimize resources without compromising on performance. This growth is driven by the increasing demand for flexibility in operations, allowing businesses to leverage both local and cloud resources. The need for enhanced data security and reduced latency further propels the adoption of hybrid solutions, making them an attractive choice for VR applications across various industries.
Cloud-Based (Dominant) vs. Hybrid (Emerging)
Cloud-Based deployment models dominate the Virtual Reality (VR) Consulting and Development Services Market due to their accessibility and cost-effectiveness. Companies leveraging cloud technology can scale their VR solutions effortlessly, catering to varying business needs without substantial infrastructure investments. On the other hand, Hybrid deployment models are emerging as a compelling alternative, blending the advantages of both cloud and on-premises solutions. This approach offers enhanced flexibility, as organizations can optimize their resources by distributing workloads based on specific requirements. As data privacy and latency concerns grow, the hybrid model is increasingly adopted, allowing firms to enjoy the best of both worlds while addressing the unique challenges of VR implementations.
Get more detailed insights about Virtual Reality (VR) Consulting and Development Services Market Request Free Sample
North America dominates the VR consulting and development services market, holding a significant share of 3.25B in 2025. The region's growth is driven by rapid technological advancements, increasing adoption of VR in various sectors, and supportive government initiatives. Companies are investing heavily in VR solutions to enhance user experiences, particularly in gaming, healthcare, and education. Regulatory frameworks are evolving to support innovation, further fueling market expansion. The competitive landscape in North America is robust, featuring key players like Accenture, Deloitte, and Cognizant. The U.S. leads the charge, with a strong presence of tech giants and startups alike. This region's focus on R&D and collaboration between industry and academia fosters a vibrant ecosystem for VR development. As companies strive to differentiate their offerings, the demand for specialized consulting services is expected to rise, solidifying North America's position as a The Virtual Reality (VR) Consulting and Development Services.
Europe is witnessing a surge in demand for VR consulting and development services, with a market size of 1.8B in 2025. The region benefits from a diverse range of industries adopting VR technologies, including automotive, healthcare, and education. Regulatory support, such as the EU's Digital Strategy, encourages innovation and investment in VR, making it a key driver for market growth. The increasing focus on immersive experiences is reshaping consumer expectations and driving demand for tailored VR solutions. Leading countries in Europe include Germany, France, and the UK, where companies like Capgemini and PwC are making significant strides. The competitive landscape is characterized by a mix of established firms and innovative startups, fostering a dynamic environment for VR development. As the market matures, collaboration between tech firms and regulatory bodies will be crucial in addressing challenges and unlocking new opportunities in the VR space.
Asia-Pacific is emerging as a significant player in the VR consulting and development services market, with a projected size of 1.3B in 2025. The region's growth is fueled by increasing investments in technology, a burgeoning gaming industry, and rising consumer interest in immersive experiences. Governments are also promoting digital initiatives, which serve as catalysts for VR adoption across various sectors, including entertainment, education, and real estate. Countries like China, India, and Japan are at the forefront of this growth, with key players such as Infosys and Wipro leading the charge. The competitive landscape is evolving rapidly, with both local and international firms vying for market share. As the demand for VR solutions continues to rise, the region is expected to see increased collaboration between technology providers and end-users, paving the way for innovative applications and services in the VR domain.
The Middle East and Africa (MEA) region is gradually emerging in the VR consulting and development services market, with a market size of 0.15B in 2025. The growth is driven by increasing investments in technology and a growing interest in VR applications across sectors such as tourism, education, and healthcare. Governments are recognizing the potential of VR to enhance user engagement and are beginning to implement supportive policies to foster innovation in this space. Countries like the UAE and South Africa are leading the charge, with a mix of local startups and international firms entering the market. The competitive landscape is still developing, but there is a clear trend towards collaboration between tech companies and government entities to create a conducive environment for VR growth. As awareness of VR benefits increases, the region is poised for gradual yet significant advancements in the coming years.
The Virtual Reality (VR) Consulting and Development Services Market is currently characterized by a dynamic competitive landscape, driven by rapid technological advancements and increasing demand across various sectors. Major players such as Accenture (US), Deloitte (US), and Infosys (IN) are strategically positioning themselves through innovation and partnerships. Accenture (US) has focused on enhancing its VR capabilities by investing in immersive technologies, while Deloitte (US) emphasizes its consulting expertise to integrate VR solutions into business processes. Infosys (IN) is leveraging its strong IT services background to offer tailored VR solutions, thereby shaping a competitive environment that prioritizes technological integration and client-centric approaches.The market structure appears moderately fragmented, with numerous players vying for market share. Key business tactics include localizing services to meet regional demands and optimizing supply chains to enhance service delivery. This fragmentation allows for a diverse range of offerings, yet the influence of major players remains significant, as they set benchmarks for innovation and service quality.In November Accenture (US) announced a partnership with a leading gaming company to develop VR training modules aimed at enhancing employee skills in high-stakes environments. This strategic move underscores Accenture's commitment to expanding its VR portfolio and highlights the growing recognition of VR as a vital tool for workforce development. Such initiatives not only enhance Accenture's service offerings but also position the company as a thought leader in the VR consulting space.In October Deloitte (US) launched a new VR platform designed to facilitate remote collaboration for global teams. This platform aims to bridge geographical gaps, allowing organizations to conduct immersive meetings and training sessions. The strategic importance of this initiative lies in its potential to redefine workplace interactions, making Deloitte a frontrunner in the integration of VR into everyday business practices.In September Infosys (IN) unveiled a VR-based customer engagement solution tailored for retail clients. This innovative approach allows retailers to create immersive shopping experiences, thereby enhancing customer satisfaction and loyalty. The introduction of such solutions indicates Infosys's proactive stance in addressing evolving consumer expectations and its ability to leverage VR technology for competitive advantage.As of December the competitive trends in the VR consulting and development services market are increasingly defined by digitalization, sustainability, and AI integration. Strategic alliances are becoming pivotal, as companies collaborate to enhance their technological capabilities and service offerings. The shift from price-based competition to a focus on innovation and technology is evident, with firms prioritizing reliability in their supply chains. This evolution suggests that future competitive differentiation will hinge on the ability to deliver cutting-edge solutions that meet the complex demands of clients in an ever-changing market.






The Virtual Reality Consulting and Development Services Market is projected to grow at an 8.66% CAGR from 2025 to 2035, driven by technological advancements and increasing demand for immersive experiences.
New opportunities lie in:
By 2035, the market is expected to be robust, reflecting substantial growth and innovation.
| MARKET SIZE 2024 | 6.5(USD Billion) |
| MARKET SIZE 2025 | 7.06(USD Billion) |
| MARKET SIZE 2035 | 16.2(USD Billion) |
| COMPOUND ANNUAL GROWTH RATE (CAGR) | 8.66% (2025 - 2035) |
| REPORT COVERAGE | Revenue Forecast, Competitive Landscape, Growth Factors, and Trends |
| BASE YEAR | 2024 |
| Market Forecast Period | 2025 - 2035 |
| Historical Data | 2019 - 2024 |
| Market Forecast Units | USD Billion |
| Key Companies Profiled | Accenture (US), Deloitte (US), Capgemini (FR), Cognizant (US), Infosys (IN), Wipro (IN), PwC (UK), HCL Technologies (IN), Tech Mahindra (IN) |
| Segments Covered | Application, End Use, Service Type, Technology, Deployment Model |
| Key Market Opportunities | Integration of artificial intelligence in Virtual Reality (VR) Consulting and Development Services enhances user experience and engagement. |
| Key Market Dynamics | Rising demand for immersive experiences drives innovation and competition in Virtual Reality Consulting and Development Services. |
| Countries Covered | North America, Europe, APAC, South America, MEA |
The market is projected to reach a valuation of 16.2 USD Billion by 2035.
The overall market valuation was 6.5 USD Billion in 2024.
The expected CAGR for the market during this period is 8.66%.
The Military application segment is expected to grow from 2.0 USD Billion to 4.7 USD Billion.
The Healthcare Providers segment is projected to grow from 1.0 USD Billion to 2.5 USD Billion.
Key service types include Consulting, Development, Integration, Support, and Training.
The Cloud-Based deployment model is anticipated to grow from 2.6 USD Billion to 6.4 USD Billion.
The Development service type is expected to increase from 2.5 USD Billion to 6.0 USD Billion.
Key players include Accenture, Deloitte, Capgemini, Cognizant, Infosys, Wipro, PwC, HCL Technologies, and Tech Mahindra.
The Real Estate segment is projected to grow from 1.2 USD Billion to 3.0 USD Billion.


Kindly complete the form below to receive a free sample of this Report

“This is really good guys. Excellent work on a tight deadline. I will continue to use you going forward and recommend you to others. Nice job”


“Thanks. It’s been a pleasure working with you, please use me as reference with any other Intel employees.”


“Thanks for sending the report it gives us a good global view of the Betaïne market.”


“Thank you, this will be very helpful for OQS.”


“We found the report very insightful! we found your research firm very helpful. I'm sending this email to secure our future business.”


“I am very pleased with how market segments have been defined in a relevant way for my purposes (such as "Portable Freezers & refrigerators" and "last-mile"). In general the report is well structured. Thanks very much for your efforts.”


“I have been reading the first document or the study, ,the Global HVAC and FP market report 2021 till 2026. Must say, good info! I have not gone in depth at all parts, but got a good indication of the data inside!”


“We got the report in time, we really thank you for your support in this process. I also thank to all of your team as they did a great job.”


“The Automotive 48V ECU Components Procurement Intelligence Study” was a complex project, but the Market Research Future (MRFR) team handled it with quality, agility, and customer-centricity. They delivered all requested data on time and within the agreed scope. The team, including Shubhendra Anand and Rahul Gotadki, was always readily available to clarify questions and swiftly implement necessary adjustments, driving the project to a successful conclusion within a very demanding timeframe.
I would also like to specifically commend Akshay Agarwal for his responsiveness and support at every stage—from our initial inquiry on May 6th through to final delivery on June 18th. His dedication made the entire process seamless.”



