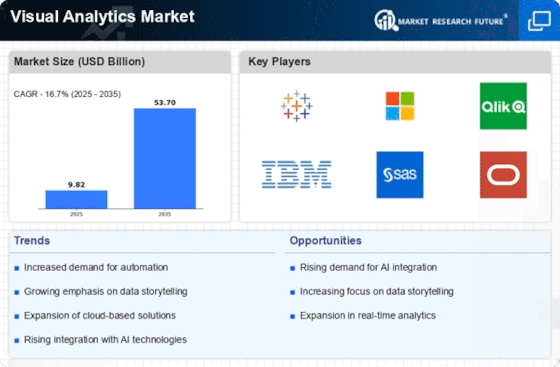
Top Industry Leaders in the Visual Analytics Market
Competitive Landscape of Visual Analytics Market:
The Visual Analytics Market has witnessed significant growth in recent years, driven by the increasing demand for data-driven decision-making across various industries. Visual analytics involves the exploration of complex data sets through interactive and graphical representation, enabling businesses to derive meaningful insights. The market is characterized by the presence of several key players, each employing distinct strategies to maintain or gain market share.
Key Players:
- G IBM Corporation (U.S.)
- Oracle (U.S.)
- SAP (Germany)
- SAS Institute (U.S.)
- Tableau Software (U.S.)
- Microsoft (U.S.)
- MicroStrategy (U.S.)
- TIBCO Software (U.S.)
- Qlik (U.S.)
- Alteryx (U.S.)
Strategies Adopted:
- Product Innovation: Key players in the visual analytics market consistently invest in research and development to enhance their product offerings, introducing new features and functionalities to stay competitive.
- Strategic Partnerships: Collaboration and partnerships with other technology companies are common strategies to expand market reach and offer integrated solutions.
- Acquisitions: Companies often pursue acquisitions to broaden their product portfolios or acquire key technologies, as seen in Salesforce's acquisition of Tableau Software.
- Focus on User Experience: Enhancing user experience remains a priority for market players, ensuring that their visual analytics solutions are accessible and user-friendly for a wider audience.
Factors for Market Share Analysis:
- Product Features and Performance: The effectiveness and breadth of features in visual analytics tools contribute significantly to market share. The ability to handle large datasets, provide real-time analytics, and offer a variety of visualization options are crucial factors.
- Customer Base: The size and diversity of the customer base reflect the market acceptance of a visual analytics tool. Companies with a broad customer reach often have a competitive edge.
- Global Presence: Having a global presence and catering to diverse industries enhance a company's market share. The ability to customize solutions for different sectors contributes to overall market competitiveness.
- Integration Capabilities: Seamless integration with other software applications and data sources is vital for visual analytics tools. Companies offering solutions that easily integrate into existing workflows have a competitive advantage.
New and Emerging Companies:
- Looker (Google Cloud): Acquired by Google Cloud, Looker has emerged as a strong player with a focus on data exploration and collaboration, offering cloud-based visual analytics solutions.
- Sisense: Sisense is gaining attention for its scalable and agile analytics platform, enabling businesses to handle complex data and generate actionable insights.
- Domo Inc.: Domo emphasizes its cloud-based approach to visual analytics, offering a platform that integrates business intelligence and data visualization.
Current Company Investment Trends:
- AI and Machine Learning Integration: Companies are increasingly investing in integrating artificial intelligence (AI) and machine learning (ML) capabilities into visual analytics tools. This trend aims to enhance predictive analytics and automate data discovery processes.
- Cloud-Based Solutions: The shift towards cloud-based visual analytics solutions is prominent, driven by the scalability, flexibility, and accessibility offered by cloud platforms.
- Focus on Industry-Specific Solutions: Companies are tailoring their visual analytics solutions to meet the specific needs of different industries, recognizing the importance of domain-specific functionalities.
- Enhanced Security Measures: Given the rising concerns about data security, companies are investing in robust security measures to ensure the protection of sensitive information within their visual analytics platforms.
Latest Company Updates:
October 26, 2023: Microsoft announces acquisition of Metasphere, a cloud-based data analytics platform, strengthening its visual analytics capabilities. This move is expected to boost Microsoft's position in the growing data analytics market.
November 10, 2023: Tableau unveils new AI-powered features for its flagship platform, including automatic insights generation and anomaly detection. These features aim to make data analysis more accessible and efficient for users of all skill levels.
December 5, 2023: Gartner releases its annual Magic Quadrant for Business Intelligence and Analytics Platforms, with Microsoft Power BI retaining the top spot, followed by Tableau and Qlik. The report highlights the increasing importance of self-service analytics and embedded analytics capabilities.
December 12, 2023: ThoughtSpot raises $240 million in funding, valuing the company at over $4 billion. The company's AI-powered search and navigation platform for analytics is gaining traction among large enterprises.
January 4, 2024: International Data Corporation (IDC) forecasts the global visual analytics market. The increasing adoption of cloud-based solutions and the growing demand for advanced analytics capabilities are cited as key drivers of this growth.
January 9, 2024: Qlik announces a partnership with Accenture to offer consulting services around its visual analytics platform. This partnership aims to leverage Qlik's technology with Accenture's industry expertise to help businesses gain insights from their data and make data-driven decisions.


