Water Quality Sensor Market

Key Players: Xylem Inc., Hach (Danaher), Endress+Hauser, SUEZ Water Technologies, Thermo Fisher Scientific, ABB Ltd., Honeywell, Horiba Ltd.

Water Quality Sensor Market

Water Quality Sensor Market Size, Share & Growth Analysis Report By Sensor Technology (Optical Sensors, Electrochemical Sensors, Multiparameter Probes, Colorimetric / Reagent-based, Acoustic / Ultrasonic), By Application (Municipal Drinking Water, Industrial Process Water, Wastewater & Effluent, Environmental Monitoring, Aquaculture), By End User (Water Utilities, Industrial Facilities, Government Agencies, Research Institutions, Aquaculture Operators) and By Regional (North America, Europe, South America, Asia Pacific, Middle East and Africa) – Industry Growth & Forecast to 2035
ID: MRFR/EnP/23734-HCR
100 Pages
Snehal Singh
Last Updated: June 22, 2026

Water Quality Sensor Market Summary

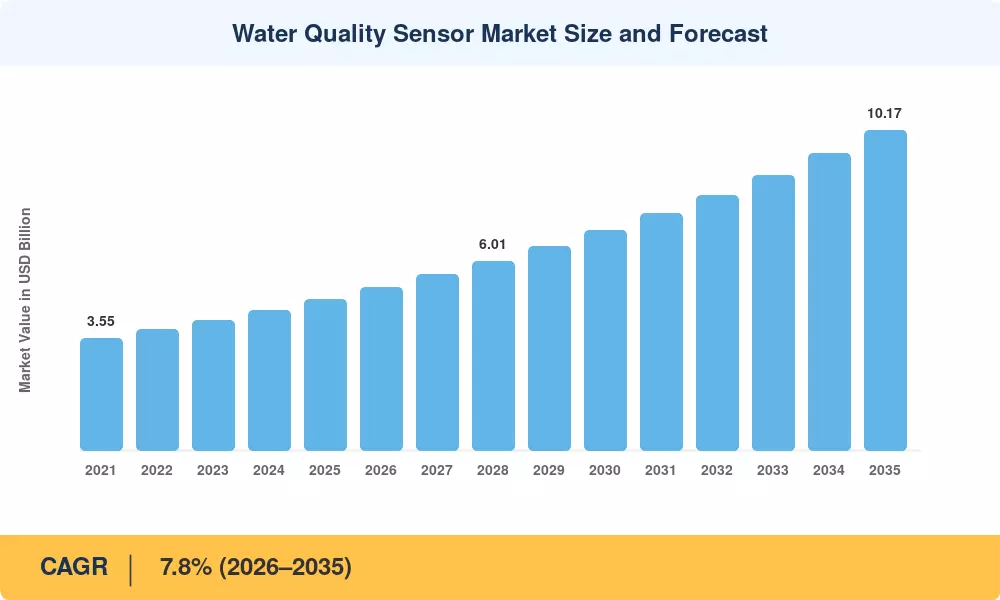
The Water Quality Sensor Market reached an estimated USD 4.80 billion in 2025 and is projected to grow from USD 5.17 billion in 2026 to USD 10.17 billion by 2035, registering a CAGR of 7.8% during the forecast period. Two catalysts are accelerating this trajectory: the U.S. EPA's revised Lead and Copper Rule Improvements (LCRI), which mandate enhanced monitoring at over 66,000 community water systems [2], and the European Union's recast Drinking Water Directive (2020/2184), requiring member states to deploy real-time IoT water quality monitoring networks across all large suppliers by 2026 [3]. Together, these policy mandates are converting what was once a periodic sampling exercise into continuous, sensor-driven surveillance.

Legacy grab-sample workflows — where technicians collect water in bottles and ship them to centralized labs — are rapidly giving way to online water quality analyzer installations that deliver turbidity pH dissolved oxygen sensor readings every few seconds. The World Bank's USD 2.7 billion commitment to water infrastructure in South Asia and Sub-Saharan Africa between 2023 and 2027 specifically earmarks a portion for multiparameter water quality sensor probe deployment at distribution end-points [4]. Portable handheld water quality sensor devices are also gaining traction in decentralized monitoring where piped infrastructure remains incomplete.

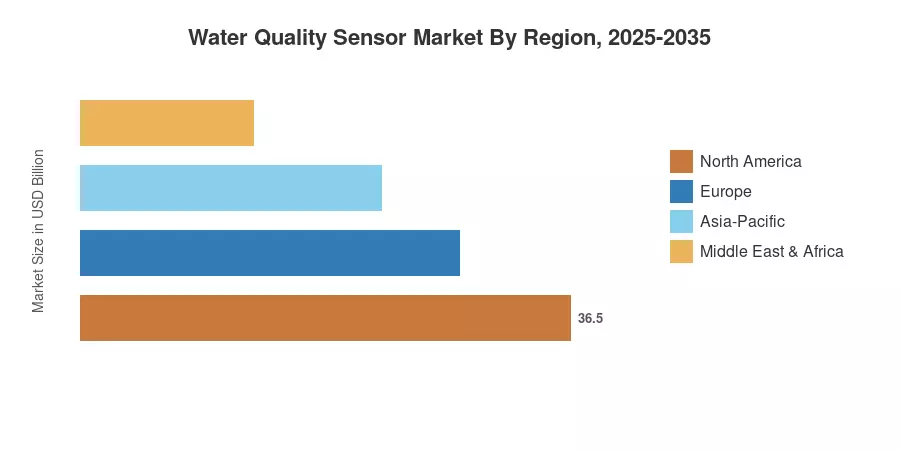
North America commands the largest share of the Water Quality Sensor Market at approximately 34%, driven by stringent Safe Drinking Water Act (SDWA) compliance. Asia-Pacific is the fastest-growing region with a projected CAGR of 9.6%, fueled by China's "14th Five-Year Plan" water pollution controls and India's Jal Jeevan Mission. Europe holds the second-largest share near 28%, anchored by the EU Water Framework Directive. These regional dynamics suggest the Water Quality Sensor Market will remain structurally diversified through 2035.


Key Report Takeaways

• By Technology

  • Optical sensing technology — encompassing turbidity pH dissolved oxygen sensor systems — holds the leading revenue share of approximately 38% in the Water Quality Sensor Market, driven by low maintenance and multi-analyte capability
  • Electrochemical sensors are forecast to register the fastest CAGR of 8.9%, reflecting rising demand for nitrate phosphate water quality sensor probes in agricultural run-off monitoring
  • Digital multiparameter water quality sensor probe platforms represent a USD 1.22 billion segment in 2025, as utilities consolidate single-parameter devices into unified digital architectures

• By Application

  • Municipal drinking water treatment constitutes approximately 31% of end-use demand for the Water Quality Sensor Market, given regulatory mandates for continuous compliance monitoring
  • Industrial process water applications are projected to grow at a CAGR of 8.4%, propelled by semiconductor fabrication and pharmaceutical ultrapure water requirements

• By Region

  • North America accounted for USD 1.63 billion in 2025, with the U.S. contributing over 82% of regional revenue
  • Asia-Pacific is poised to add the highest incremental value through 2035, supported by government-backed IoT water quality monitoring programs across China, India, and Southeast Asia


Water Quality Sensor Market Size and Forecast (2021–2035)

MRFR's sizing methodology triangulates bottom-up revenue estimates from sensor OEMs, utility capex disclosures, and top-down macro indicators including treated water volume growth and regulatory compliance timelines. Historical figures (2021–2024) reflect actual shipment and revenue data; 2025 is a calibrated base-year estimate; 2026–2035 values apply a 7.8% CAGR with minor annual variations reflecting policy milestones.

Water Quality Sensor Market Size and Forecast
Our Impact
Enabled $4.3B Revenue Impact for Fortune 500 and Leading Multinationals
Partnering with 2000+ Global Organizations Each Year
30K+ Citations by Top-Tier Firms in the Industry

Driver Impact Analysis

Driver ~% Impact on CAGR Geographic Relevance Impact Timeline
Regulatory mandates for continuous monitoring 25–30% Global Short-term (≤2 yr)
IoT and smart water infrastructure investment 18–22% North America, Europe, APAC Medium-term (2–4 yr)
PFAS / emerging contaminant surveillance 12–15% North America, Europe Medium-term (2–4 yr)
Industrial ultrapure water demand growth 10–13% APAC, North America Long-term (≥4 yr)
Agricultural nutrient run-off regulation 8–10% Europe, South America Medium-term (2–4 yr)
Climate-driven water scarcity and reuse 7–9% MEA, APAC Long-term (≥4 yr)
Urbanization in emerging economies 5–7% APAC, Africa Long-term (≥4 yr)


Regulatory Mandates for Continuous Monitoring

The U.S. EPA's LCRI requires all community water systems serving over 10,000 people to install online water quality analyzer equipment for lead, copper, and disinfectant residual by 2027, affecting roughly 10,400 systems [2]. The EU Drinking Water Directive mandates member states to adopt risk-based monitoring with turbidity pH dissolved oxygen sensor coverage at treatment works and distribution nodes. Together, these frameworks convert sensor deployment from discretionary capex into compliance-driven necessity, creating an estimated USD 1.1 billion in incremental demand during 2025–2028 alone [3].

IoT and Smart Water Infrastructure Investment

Municipal utilities are migrating from isolated SCADA systems to cloud-connected IoT water quality monitoring platforms that aggregate data from hundreds of sensors in real time. The U.S. Infrastructure Investment and Jobs Act (IIJA) allocated USD 55 billion to water infrastructure, of which approximately USD 3.4 billion targets digital water solutions including remote multiparameter water quality sensor probe networks [6]. This funding unlocks deployment at a pace traditional municipal budgets could not sustain.

PFAS and Emerging Contaminant Surveillance

EPA's final PFAS National Primary Drinking Water Regulation (April 2024) established maximum contaminant levels for six PFAS compounds, triggering demand for specialized nitrate phosphate water quality sensor instruments capable of trace-level detection at the parts-per-trillion range [12]. Compliance monitoring must begin by 2027 for large systems, driving near-term procurement of both portable handheld water quality sensor devices for screening and fixed inline analyzers for continuous tracking.

Industrial Ultrapure Water Demand

The global semiconductor fab construction pipeline — valued at over USD 500 billion through 2030 — requires ultrapure water monitoring at resistivity and TOC levels below 1 ppb [9]. Each advanced fab consumes 30–50 million liters of ultrapure water daily, necessitating dense arrays of online water quality analyzer systems at multiple purification stages. This industrial pull is expanding the Water Quality Sensor Market beyond its traditional municipal base.


Restraints Impact Analysis

Restraint ~% Negative Impact Geographic Relevance Impact Timeline
High upfront sensor and integration costs –8 to –10% Emerging economies Short-term (≤2 yr)
Sensor fouling and maintenance burden –6 to –8% Global Ongoing
Lack of standardized calibration protocols –4 to –6% Global Medium-term (2–4 yr)
Cybersecurity risks in connected sensor networks –3 to –5% North America, Europe Medium-term (2–4 yr)
Skilled workforce shortages in water utilities –3 to –4% APAC, Africa, South America Long-term (≥4 yr)


High Upfront Costs

A single multiparameter water quality sensor probe station — inclusive of analyzer housing, telemetry, and cloud subscription — can range from USD 15,000 to USD 45,000 depending on analyte coverage [16]. For small and medium utilities in developing countries, this price point exceeds annual instrumentation budgets, delaying adoption despite regulatory pressure. Blended finance mechanisms and Sensor-as-a-Service models are emerging to mitigate this barrier but remain nascent.

Sensor Fouling and Maintenance

Biofouling, mineral scaling, and particulate buildup degrade turbidity, pH, and dissolved oxygen sensor accuracy within weeks of deployment in raw water or wastewater environments [17]. Maintenance intervals of 2–4 weeks add high operational cost and reduce the appeal of continuous monitoring versus periodic lab analysis. Self-cleaning sensor heads and anti-fouling coatings are improving, but have not yet eliminated this restraint for the Water Quality Sensor Market.


Water Quality Sensor Market Opportunities

Sensor-as-a-Service (SaaS) Business Models

As capital budgets are tighter, water utilities are becoming more receptive to monitoring on a subscription basis, where vendors provide, install and operate online water quality analyzer devices for a monthly charge. This switches procurement from capex to opex and increases the addressable Water Quality Sensor Market in Africa, Southeast Asia and Latin America


AI-Driven Predictive Water Quality Analytics

Edge computing platforms in IoT water quality monitoring networks can detect anomalies (e.g., chlorine decay or turbidity spikes) minutes before they cross compliance levels [10]. Vendors who include AI inference directly in sensor firmware have a competitive edge and develop recurring software income streams


Emerging-Market Infrastructure Leapfrogging

Wireless portable handheld water quality sensor networks can be deployed at a tenth of the cost of wired systems in countries without historical SCADA infrastructure. India's Jal Jeevan Mission has brought 124 million rural families on tap and created demand for decentralized water quality certification at the tap [7]. Similar programs across Sub-Saharan Africa are a largely unexplored greenfield opportunity


PFAS and Micropollutant Detection

Increased regulatory scrutiny of per- and polyfluoroalkyl compounds, microplastics and pharmaceutical residues is giving rise to a new sensor tier aimed at trace-level detection. Nitrate phosphate water quality sensor technology modified for low-ppb PFAS screening could attract premium pricing and differentiate early movers


Data Monetization and Digital Twins

Continuous sensor data feeds are the backbone of utility digital twins — virtual replicas of distribution networks used for hydraulic modeling and leak detection. Sensor OEMs positioned as data platform providers can capture value beyond hardware margins, transforming the Water Quality Sensor Market from an instrumentation sale into a data-services ecosystem


Water Quality Sensor Market Future Outlook

AI and Autonomous Sensor Operations

By 2030, an estimated 40% of large water utilities will integrate machine-learning algorithms into their IoT water quality monitoring infrastructure to enable autonomous anomaly detection and predictive maintenance scheduling [10]. Sensors that self-calibrate and self-diagnose will reduce operating costs by up to 30%, accelerating the business case for continuous monitoring in cost-sensitive markets.

Platform Economics and Digital Water Ecosystems

The Water Quality Sensor Market is shifting from hardware-centric transactions toward platform-based revenue models. Vendors offering cloud dashboards, API integrations, and digital twin connectivity will capture higher lifetime value per installation. BloombergNEF estimates the "digital water" software layer will exceed USD 8 billion globally by 2032 [21].

Climate Adaptation and Water Reuse Infrastructure

Rising frequency of drought and flood events is compelling governments to invest in treated-water reuse, which demands continuous online water quality analyzer systems verifying pathogen removal and chemical purity. The IEA projects climate-adaptive water infrastructure capex will reach USD 260 billion annually by 2030 [14], a portion of which directly benefits the Water Quality Sensor Market.

ESG Reporting and Supply-Chain Transparency

Corporate ESG disclosure frameworks — including CSRD in Europe and SEC climate rules in the U.S. — increasingly require auditable water quality data. Industrial facilities deploying turbidity pH dissolved oxygen sensor arrays can generate the continuous data streams needed for Scope 3 water-impact reporting, creating a compliance-driven demand layer that extends the Water Quality Sensor Market into food & beverage, mining, and chemical manufacturing.


Water Quality Sensor Market Segmentation

By Sensor Technology

Segment Key Metric Primary Demand Driver
Optical Sensors 38% share (2025) Multi-analyte capability for turbidity, DO, chlorophyll
Electrochemical Sensors CAGR 8.9% Nitrate phosphate water quality sensor demand in agriculture
Multiparameter Probes USD 1.22 B (2025) Utility preference for consolidated instruments
Colorimetric / Reagent-based 12% share (2025) Lab-grade accuracy in portable form factors
Acoustic / Ultrasonic CAGR 7.2% Flow-integrated quality measurement


Optical sensors dominate the Water Quality Sensor Market because a single optical probe can simultaneously measure turbidity, dissolved oxygen, chlorophyll-a, and UV254 absorbance without consumable reagents. Utilities prefer this approach for its lower total cost of ownership and compatibility with IoT water quality monitoring architectures. Electrochemical sensors are growing fastest, propelled by agricultural and environmental agencies mandating real-time nitrate phosphate water quality sensor deployment at watershed monitoring stations to track nutrient loading into rivers and estuaries.

By Application

Segment Key Metric Primary Demand Driver
Municipal Drinking Water 31% share (2025) Regulatory compliance (SDWA, EU DWD)
Industrial Process Water CAGR 8.4% Semiconductor, pharma ultrapure requirements
Wastewater & Effluent USD 1.08 B (2025) Discharge permit monitoring
Environmental Monitoring 14% share (2025) Surface water and groundwater surveillance
Aquaculture CAGR 9.1% Dissolved oxygen and pH management


Municipal drinking water remains the foundation of the Water Quality Sensor Market, as every community water system globally must verify disinfectant residual, turbidity, and pH at treatment outlets. Industrial process water is the fastest-growing application by revenue addition, particularly in semiconductor fabs where inline online water quality analyzer systems verify resistivity and total organic carbon at sub-ppb levels continuously.

By End User

Segment Key Metric Primary Demand Driver
Water Utilities 44% share (2025) Compliance and smart-grid modernization
Industrial Facilities CAGR 8.2% ESG reporting and ultrapure water needs
Government Agencies USD 0.53 B (2025) Environmental monitoring mandates
Research Institutions 6% share (2025) Field research and method development
Aquaculture Operators CAGR 9.3% Stock survival and feed optimization


Water utilities represent the single largest buyer group in the Water Quality Sensor Market, reflecting both the scale of public water infrastructure and the non-discretionary nature of compliance-driven procurement. Industrial facilities are increasing adoption rapidly as ESG mandates push manufacturers to deploy multiparameter water quality sensor probe installations across cooling loops, boiler feedwater, and wastewater discharge points.


Regional Market Share Analysis

Region Key Metric Primary Investment Themes
North America 34% share (2025) LCRI compliance; PFAS monitoring; smart water grids
Europe USD 1.34 B (2025) EU DWD risk-based monitoring; Green Deal water reuse
Asia-Pacific 9.6% CAGR (2026–2035) China 14th FYP; India JJM; semiconductor fabs
South America USD 0.29 B (2025) Agricultural run-off controls; Brazil SABESP modernization
Middle East & Africa 8.8% CAGR (2026–2035) Desalination monitoring; climate adaptation
Total USD 4.80 B (2025)

The Water Quality Sensor Market is geographically diversified, with regulatory maturity and water infrastructure investment driving regional demand patterns.


North America

Country Key Metric Key Driver
United States 82% of regional revenue EPA LCRI and PFAS regulation
Canada CAGR 7.4% Drinking Water Safety Act amendments
Mexico USD 0.06 B (2025) CONAGUA industrial discharge monitoring


The United States dominates North American demand because the EPA's enforcement timelines for LCRI and PFAS standards create non-discretionary procurement cycles for online water quality analyzer platforms. Canada's federal government committed CAD 1.5 billion under the Canada Water Agency to upgrade monitoring on Indigenous and northern water systems [19]. Mexico's growth remains constrained by fiscal limitations, but is rising as CONAGUA tightens industrial wastewater discharge permits, requiring continuous nitrate phosphate water quality sensor readings.

Europe

Country Key Metric Key Driver
Germany 24% of European revenue Technologieoffensive Wasser program
United Kingdom CAGR 7.6% DEFRA storm overflow monitoring mandates
France USD 0.14 B (2025) Eau de Paris digital water program
Rest of Europe 42% of regional share EU DWD transposition


Germany's advanced water utility sector and its Technologieoffensive Wasser initiative fund IoT water quality monitoring pilot projects across municipal networks. The UK's storm overflow monitoring mandates require real-time turbidity pH dissolved oxygen sensor installation at over 14,000 combined sewer overflow points by 2030 [20], creating one of Europe's largest single procurement pipelines for the Water Quality Sensor Market.

Asia-Pacific

Country Key Metric Key Driver
China 42% of APAC revenue 14th Five-Year Plan water pollution controls
India CAGR 11.2% Jal Jeevan Mission sensor mandates
Japan USD 0.12 B (2025) Aging infrastructure renewal
South Korea CAGR 8.1% K-water smart water grid program
Rest of APAC 18% of the APAC share Southeast Asian urbanization


China's Ministry of Ecology and Environment requires continuous water quality monitoring at over 3,600 surface water stations and all major wastewater discharge points under the 14th Five-Year Plan [8]. India's Jal Jeevan Mission mandates portable handheld water quality sensor testing at every rural tap connection, creating a massive volume play. These two countries together propel Asia-Pacific as the fastest-growing region in the Water Quality Sensor Market.

South America

Country Key Metric Key Driver
Brazil 64% of regional revenue SABESP privatization and modernization
Rest of South America CAGR 8.3% Agricultural export compliance


Brazil's SABESP privatization in 2024 unlocked private capital for sensor network upgrades across São Paulo's water distribution system. Agricultural export markets — particularly the EU — increasingly require nitrate phosphate water quality sensor verification of irrigation run-off, incentivizing precision monitoring in soy and cattle regions.

Middle East & Africa

Country Key Metric Key Driver
Saudi Arabia 35% of MEA revenue NEOM and desalination monitoring
UAE CAGR 9.0% Smart-city water management
Rest of MEA USD 0.11 B (2025) World Bank-funded rural water programs


Desalination accounts for over 60% of potable water supply in the Gulf states, and every desalination facility requires multiparameter water quality sensor probe systems to monitor chloride, boron, and conductivity throughout the reverse-osmosis train. Sub-Saharan Africa's adoption is accelerating through World Bank and AfDB funded programs that bundle portable handheld water quality sensor kits with borehole installations.


Water Quality Sensor Market By Region, 2025-2035

Competitive Benchmarking

The Water Quality Sensor Market exhibits moderate concentration, with an estimated Herfindahl-Hirschman Index (HHI) below 1,200 and the top five players commanding roughly 35–42% of global revenue. The market blends large diversified instrumentation conglomerates with specialized water analytics firms, creating layered competition across premium, mid-tier, and economy segments.

Company Est. Revenue Share Range Key Offerings Strategic Positioning
Xylem Inc. ~8–11% YSI multiparameter probes, online analyzers Full-spectrum water analytics leader
Hach (Danaher) ~7–10% Turbidity, DO, chlorine analyzers Dominant in municipal compliance
Endress+Hauser ~5–8% Liquiline multiparameter platform Industrial process focus
SUEZ Water Technologies ~4–6% i-Series online analyzers Integrated treatment + monitoring
Thermo Fisher Scientific ~3–5% Orion portable and benchtop sensors Lab-to-field analytical platform
ABB Ltd. ~3–5% AWT series water quality analyzers Industrial automation integration
Honeywell ~2–4% Connected sensing platforms IoT and smart building water
Horiba Ltd. ~2–4% U-50 series multiparameter probes Portable field monitoring
In-Situ Inc. ~2–3% Aqua TROLL series Groundwater and environmental
Mettler-Toledo ~2–3% Thornton pure water analyzers Pharma and semiconductor ultrapure


Recent News & Developments


  • U.S. EPA (April 2024): Finalized the PFAS National Primary Drinking Water Regulation, setting MCLs for six PFAS compounds and triggering demand for continuous online water quality analyzer systems at over 4,000 large utilities [12].


  • India Ministry of Jal Shakti (August 2024): Announced Phase-II sensor procurement under the Jal Jeevan Mission, allocating INR 2,800 crore for portable handheld water quality sensor kits across 250,000 rural panchayats [7].


Water Quality Sensor Market Report Scope

Parameter Detail
Market Scope Global Water Quality Sensor Market covering sensor hardware, software, and services
Study Period 2021–2035
Historical Period 2021–2024
Base Year 2025
Forecast Period 2026–2035
CAGR (Forecast) 7.8% (2026–2035)
Market Size (2025) USD 4.80 Billion
Market Size (2035) USD 10.17 Billion
Fastest Growing Region Asia-Pacific (CAGR 9.6%)
Fastest Growing Segment Electrochemical sensors by technology; Aquaculture by end user
Companies Profiled Xylem, Hach (Danaher), Endress+Hauser, SUEZ, Thermo Fisher, ABB, Honeywell, Horiba, In-Situ, Mettler-Toledo
Valuation Currency USD (constant 2025 dollars)


FAQs

How do optical sensors compare with electrochemical sensors for long-term inline deployment?

Optical sensors offer longer calibration intervals (typically 6–12 months) and no consumable membranes, making them lower-maintenance for inline use. Electrochemical sensors provide superior sensitivity for ionic species like nitrate but require membrane replacement every 3–6 months [17].

What cybersecurity standards apply to connected water quality sensor networks?

NIST SP 800-82 and IEC 62443 govern industrial control system security, including IoT water quality monitoring networks. Utilities should mandate encrypted data transmission and role-based access controls at every sensor node [10].

Can existing SCADA infrastructure integrate modern multiparameter sensor probes?

Most current multiparameter water quality sensor probe platforms support Modbus, HART, and OPC-UA protocols, enabling backward-compatible integration with legacy SCADA systems. Gateway devices bridge older 4–20 mA loops to digital networks [22].

What is the typical payback period for switching from grab sampling to continuous monitoring?

Utilities report a 2–3 year payback driven by reduced lab analysis costs, lower chemical dosing waste, and avoided regulatory fines. High-volume systems recover investment faster [16].

How are sensor manufacturers addressing biofouling in wastewater applications?

Leading vendors now incorporate ultrasonic self-cleaning, copper-alloy sensor guards, and hydrophobic nano-coatings. These features extend maintenance intervals from 2 weeks to 6–8 weeks in high-fouling environments [17].

What role do portable sensors play in emergency response scenarios?

Portable handheld water quality sensor kits are first-response tools for contamination events, enabling field teams to screen for chlorine residual, pH, and turbidity within minutes at the incident site [7].

How does Sensor-as-a-Service pricing typically structure costs for small utilities?

SaaS contracts bundle hardware, installation, maintenance, and cloud analytics into a monthly per-sensor fee, usually USD 200–500 per month. This eliminates upfront capital barriers for small utilities [13].    
Author
Author
Author Profile
Snehal Singh LinkedIn
Manager - Research
High acumen in analyzing complex macro & micro markets with more than 6 years of work experience in the field of market research. By implementing her analytical skills in forecasting and estimation into market research reports, she has expertise in Packaging, Construction, and Equipment domains. She handles a team size of 20-25 resources and ensures smooth running of the projects, associated marketing activities, and client servicing.

Research Approach


Secondary Research

The secondary research process involved comprehensive analysis of regulatory databases, peer-reviewed environmental engineering journals, technical publications, and authoritative water resource organizations. Key sources included the US Environmental Protection Agency (EPA), European Environment Agency (EEA), International Water Association (IWA), American Water Works Association (AWWA), World Health Organization (WHO) Water Quality Guidelines, US Geological Survey (USGS), National Oceanic and Atmospheric Administration (NOAA) National Water Quality Monitoring Council, International Organization for Standardization (ISO) Technical Committee 147 (Water Quality), EU Water Framework Directive databases, UN-Water Global Analysis and Assessment of Sanitation and Drinking-Water (GLAAS), OECD Water Governance Initiative, and national environmental ministry reports from key markets. These sources were used to collect water quality standards, regulatory compliance requirements, sensor technology specifications, installation statistics, and market landscape analysis for electrochemical sensors, optical sensors, biosensors, microfluidic sensors, and nanobiosensor technologies.


Primary Research

In order to gather both qualitative and quantitative insights, supply-side and demand-side stakeholders were interviewed during the primary research process. CEOs, VPs of Product Development, chief technology officers, and heads of regulatory affairs from OEMs, component suppliers, and makers of water quality sensors were examples of supply-side sources. Water treatment plant managers, wastewater facility engineers, environmental compliance officers, industrial process engineers, agricultural irrigation specialists, and procurement leads from municipal utilities, industrial facilities, environmental consulting firms, and aquaculture operations were examples of demand-side sources. Market segmentation across sensor types (electrochemical, optical, biosensors, microfluidic, nanobiosensors), measurement parameters (pH, conductivity, dissolved oxygen, temperature, turbidity, TDS, BOD, COD), applications (water treatment plants, wastewater treatment, industrial monitoring, environmental monitoring, agriculture, aquaculture), form factors (immersion, in-line, flow-through, portable, wireless), and communication protocols (analog, digital, Bluetooth, Wi-Fi, LoRa). In addition to gathering information on pricing strategies, calibration requirements, and regulatory certification dynamics, interviews verified product development pipelines and technology adoption timetables.

Primary Respondent Breakdown:

By Designation: C-level Primaries (32%), Director Level (31%), Others (37%)

By Region: North America (38%), Europe (25%), Asia-Pacific (28%), Rest of World (9%)


Market Size Estimation

Global market valuation was derived through revenue mapping and sensor deployment volume analysis. The methodology included:

Identification of 50+ key manufacturers across North America, Europe, Asia-Pacific, and Latin America

Product mapping across electrochemical sensors, optical sensors, biosensors, microfluidic sensors, nanobiosensors, and other emerging sensor categories

Analysis of reported and modeled annual revenues specific to water quality sensor portfolios

Coverage of manufacturers representing 75-80% of global market share in 2024

Extrapolation using bottom-up (sensor unit volume × ASP by application and region) and top-down (manufacturer revenue validation) approaches to derive segment-specific valuations for measurement parameters (pH, conductivity, dissolved oxygen, turbidity, TDS, BOD, COD), form factors (immersion, in-line, portable, wireless), and communication protocols (digital, analog, wireless technologies)

Download Free Sample

Kindly complete the form below to receive a free sample of this Report

Download PDF ×

We do not share your information with anyone. However, we may send you emails based on your report interest from time to time. You may contact us at any time to opt-out.