Segmentation Quick Reference
| Dimension | Sub-Segments | Dominant Segment | Fastest Growing Segment |
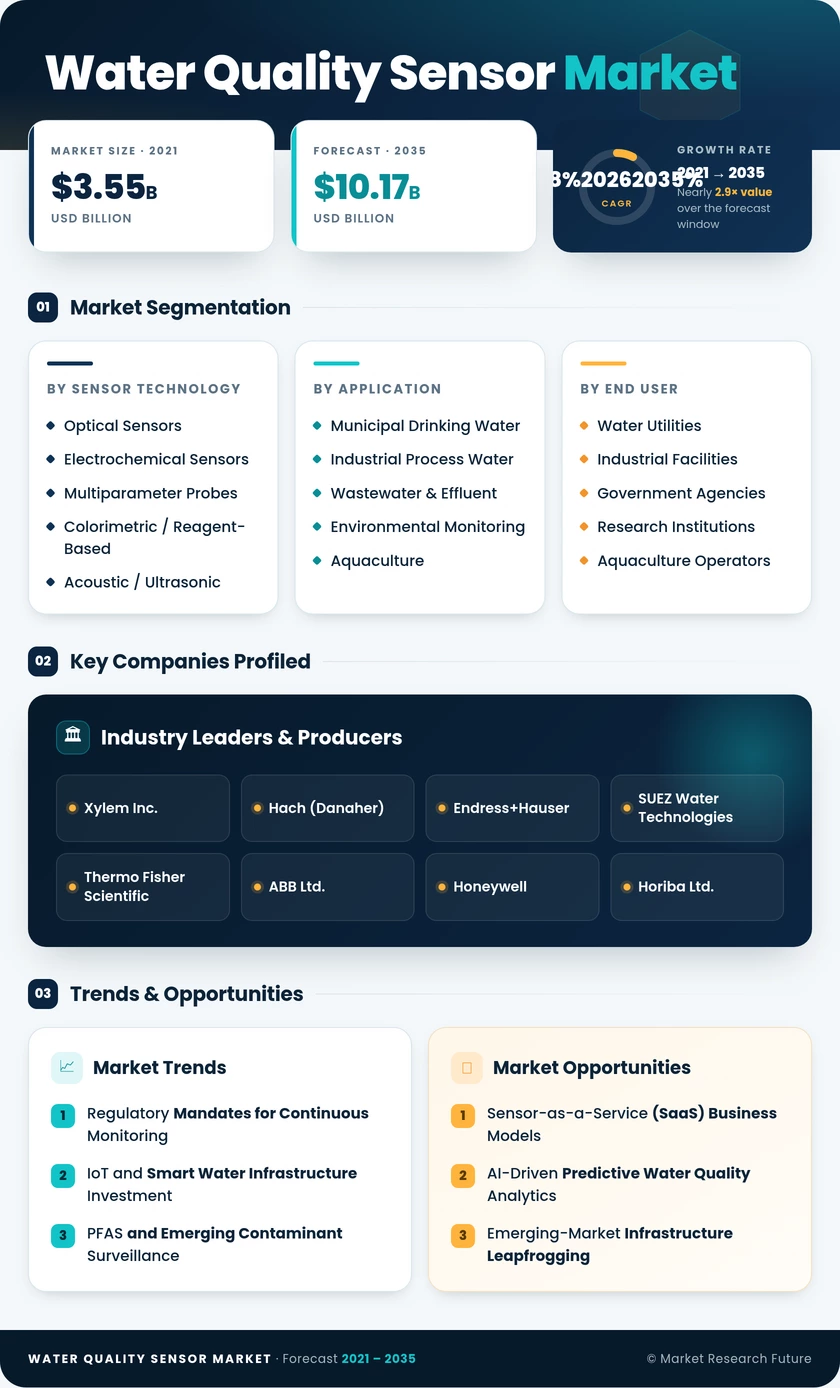
| By Sensor Water Quality Sensor Market | Optical Sensors, Electrochemical Sensors, Multiparameter Probes, Colorimetric / Reagent-Based, Acoustic / Ultrasonic | Optical Sensors | Electrochemical Sensors |
| By Application | Municipal Drinking Water, Industrial Process Water, Wastewater & Effluent, Environmental Monitoring, Aquaculture | Municipal Drinking Water | Aquaculture |
| By End User | Water Utilities, Industrial Facilities, Government Agencies, Research Institutions, Aquaculture Operators | Water Utilities | Aquaculture Operators |
Market Segmentation Overview
By Sensor Water Quality Sensor Market
| Sub-Segment | Key Trend |
| Optical Sensors | Multi-analyte capability without consumables driving adoption in municipal compliance |
| Electrochemical Sensors | Rising agricultural and environmental nutrient monitoring demand |
| Multiparameter Probes | Utility preference for consolidated digital platforms replacing single-parameter instruments |
| Colorimetric / Reagent-Based | Continued relevance where lab-grade accuracy is required in portable formats |
| Acoustic / Ultrasonic | Integration of flow measurement with quality parameters for holistic monitoring |
Optical sensors remain the backbone of the Water Quality Sensor Market due to their reagent-free operation and simultaneous multi-analyte detection. Electrochemical sensors are gaining ground as regulators tighten nutrient discharge limits, particularly for nitrate and phosphate species in agricultural watersheds.
By Application
| Sub-Segment | Key Trend |
| Municipal Drinking Water | Mandatory continuous compliance monitoring under LCRI, EU DWD |
| Industrial Process Water | Ultrapure water needs in semiconductor and pharmaceutical manufacturing |
| Wastewater & Effluent | Real-time discharge permit monitoring to avoid fines |
| Environmental Monitoring | Government-funded surface water and groundwater surveillance programs |
| Aquaculture | Dissolved oxygen and pH management critical for stock survival and yield optimization |
Municipal drinking water treatment sets the regulatory floor for sensor deployment globally. Industrial process water is emerging as a high-growth application as advanced manufacturing processes demand increasingly precise inline monitoring.
By End User
| Sub-Segment | Key Trend |
| Water Utilities | Smart water grid modernization programs driving sensor network expansion |
| Industrial Facilities | ESG reporting requirements mandating auditable water quality data streams |
| Government Agencies | Environmental protection mandates funding large-scale monitoring networks |
| Research Institutions | Method development and field research using next-generation sensor platforms |
| Aquaculture Operators | Precision aquaculture driving adoption of real-time multi-parameter monitoring |
Water utilities remain the dominant buyer segment, but industrial facilities are narrowing the gap as corporate sustainability mandates create new procurement channels. Aquaculture operators represent the fastest-growing end-user category, reflecting the global expansion of farmed seafood production.