Web Analytics Market (2026 - 2035)

Web Analytics Market Size, Share and Research Report By Application (Online Marketing & Marketing Automation, Customer Journey Mapping, Mobile Analytics, Social Media Management, Content Marketing), By Offering (Solutions, Services), By Deployment Model (Cloud-Based, On-Premises), By Organization Size (Large Enterprises, Small and Medium Enterprises), By End-User Vertical (Retail & E-Commerce, Healthcare & Life Sciences, BFSI, Manufacturing, Media & Entertainment) and By Regional (North America, Europe, South America, Asia Pacific, Middle East and Africa) - Industry Forecast to 2035.
ID: MRFR/ICT/8078-HCR
100 Pages
Ankit Gupta, Shubham Munde
Last Updated: July 02, 2026
Web Analytics Market
Market Size
Forecast Period2026-2035
CAGR (2026-2035)16.10%
2025 Market SizeUSD 8.54 Billion
2035 Market SizeUSD 37.67 Billion
Key Players
Google
Adobe
Microsoft
Salesforce
Oracle
IBM
Opportunities
  • AI-Powered Predictive Analytics Platforms
  • Emerging Market Digital Adoption
  • Server-Side Analytics Monetization

Web Analytics Market Summary

The Web Analytics Market reached a valuation of USD 8.54 billion in 2025 and is projected to grow from USD 9.83 billion in 2026 to USD 37.67 billion by 2035, registering a CAGR of 16.10% across the forecast period. Two forces underpin this trajectory: the global acceleration of digital commerce — which crossed USD 6.3 trillion in 2024 [1] — and a regulatory environment that now penalizes organizations operating without compliant measurement infrastructure. The EU's Digital Markets Act and successive U.S. state privacy laws have turned analytics from a discretionary marketing tool into a compliance necessity, pushing procurement budgets upward across every industry vertical.

A fundamental technology shift is reshaping the Web Analytics Market as legacy tag-based, client-side measurement gives way to server-side data collection, AI-driven journey intelligence, and privacy-preserving attribution models. Organizations invested an estimated USD 19 billion in marketing technology consolidation during 2024 alone [2], with analytics platforms sitting at the center of these stack overhauls. First-party data strategies, prompted by the decline of third-party cookies, have elevated analytics vendors that combine secure cloud infrastructure with real-time predictive capabilities.

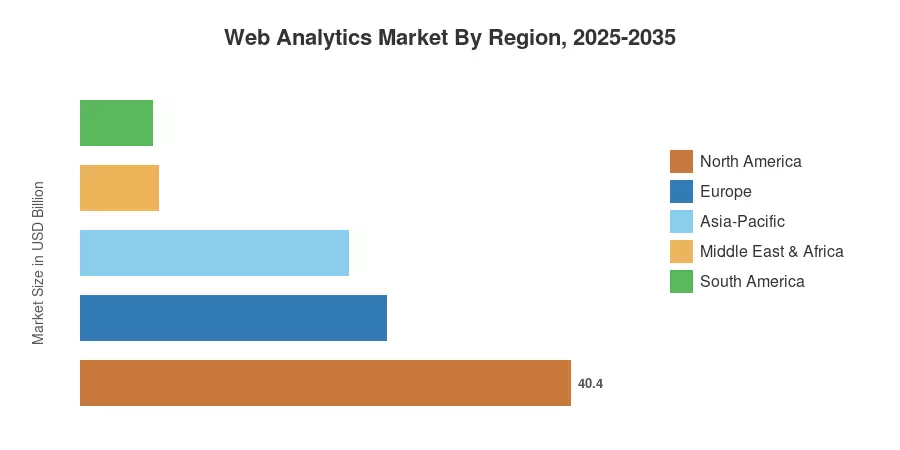
North America commands approximately 40.4% of the Web Analytics Market, anchored by enterprise-scale adoption among Fortune 500 retailers and financial services firms. Asia-Pacific stands as the fastest-growing region, projected to expand at a 16.80% CAGR through 2035, driven by digital payment proliferation in India and Southeast Asia. Europe holds the second-largest share at roughly 25.2%, shaped by GDPR-driven demand for privacy-centric analytics architectures. As digital touchpoints multiply across sectors from healthcare to government services, the Web Analytics Market is poised for sustained double-digit expansion through the next decade.


Key Report Takeaways

• By Application

  • Online Marketing and Marketing Automation accounted for 43.5% of Web Analytics Market revenue in 2025, reflecting the deep integration of analytics into campaign orchestration workflows.
  • Customer Journey Mapping is projected to register a CAGR of 17.07% through 2035, as enterprises shift from page-level metrics to full-funnel attribution models.

• By Offering

  • Solutions held a 68.3% share of the Web Analytics Market in 2025, while Services are expected to grow at a 17.17% CAGR as implementation and managed analytics engagements expand.


• By Deployment

  • Cloud-Based deployment controlled 72.2% of the Web Analytics Market share in 2025.

• By Region

  • North America led the Web Analytics Market with a 40.4% share in 2025, driven by mature enterprise SaaS ecosystems.
  • Asia-Pacific is forecast to register the highest CAGR of 16.80% through 2035.


Market Size and Forecast (2021–2035)

Market Research Future's estimates combine primary interviews with analytics vendors, system integrators, and enterprise buyers alongside secondary analysis of financial filings, industry association data, and regulatory impact assessments. Historical figures (2021–2024) are triangulated against publicly reported vendor revenues; forecast figures (2026–2035) apply proprietary growth modeling calibrated to macroeconomic indicators, privacy regulation timelines, and technology adoption curves.
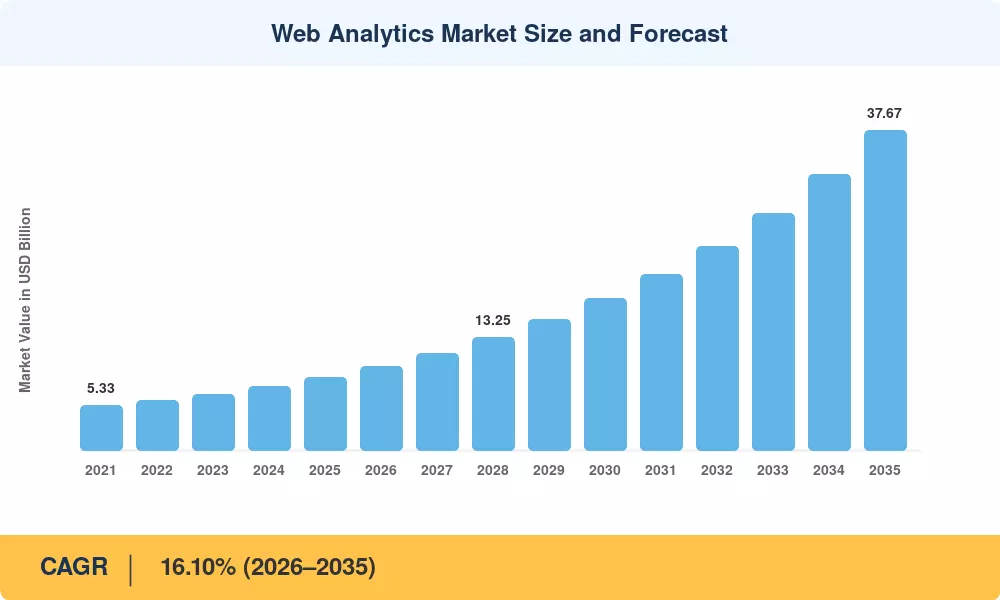
Web Analytics Market Size and Forecast
Our Impact
Enabled $4.3B Revenue Impact for Fortune 500 and Leading Multinationals
Partnering with 2000+ Global Organizations Each Year
30K+ Citations by Top-Tier Firms in the Industry

Driver Impact Analysis

Driver ~% Impact on CAGR Geographic Relevance Impact Timeline
Digital commerce expansion +3.2% Global Short-term (≤2 yr)
Privacy regulation and first-party data mandates +2.8% North America, Europe Medium-term (2–4 yr)
AI/ML integration in analytics platforms +2.5% Global Medium-term (2–4 yr)
Mobile-first consumer behavior shift +2.1% Asia-Pacific, South America Short-term (≤2 yr)
Cloud infrastructure migration +1.9% Global Long-term (≥4 yr)
Cross-channel attribution demand +1.6% North America, Europe Medium-term (2–4 yr)
Personalization and CX investment cycles +1.4% Global Long-term (≥4 yr)


Digital Commerce Expansion

In 2024, global e-commerce sales exceeded USD 6.3 trillion, and each transaction generates a measuring requirement. According to a 2024 Baymard Institute study, retailers who use web analytics to optimize checkout funnels claim improvements in cart completion rates of 12–18%. By shortening procurement timelines and increasing per-seat license values throughout the Web Analytics Market, this direct revenue linkage turns analytics from a cost center into a profit engine.


Privacy Regulation and First-Party Data Mandates

While 19 U.S. states passed comprehensive privacy legislation between 2023 and 2025, the EU's GDPR enforcement operations resulted in total fines of nearly EUR 4.5 billion by the end of 2024 [4]. Organizations are required by these requirements to switch from third-party tracking to server-side, consent-based analytics infrastructures. Vendors providing privacy-preserving measurement in the Web Analytics Market immediately profit from the replacement cycle created by the compliance need.


AI and Machine Learning Integration

estimated that 65% of enterprise analytics platforms incorporated generative AI capabilities by 2025 [6], enabling natural language querying, automated anomaly detection, and predictive audience segmentation. AI-augmented analytics reduce the technical barrier to insight generation, expanding the addressable user base within organizations from dedicated analysts to marketing managers, product owners, and C-suite executives — broadening the revenue base of the Web Analytics Market.

Mobile-First Consumer Behavior

Mobile devices accounted for 62% of global web traffic in 2025, according to Statcounter [7]. In markets like India and Indonesia, mobile-first ratios exceed 75%, demanding analytics solutions purpose-built for app-web hybrid journeys. This behavioral shift requires specialized SDKs, event-streaming infrastructure, and cross-device identity resolution — all of which expand the scope and average contract value within the Web Analytics Market.


Restraints Impact Analysis

The restraints estimates below represent directional drag on market growth potential. They are not linearly subtractive from the headline CAGR and reflect qualitative assessment of each factor's friction on adoption and spend.

Restraint ~% Impact on CAGR Geographic Relevance Impact Timeline
Data collection restrictions and consent fatigue –1.8% Europe, North America Short-term (≤2 yr)
Third-party cookie phase-out uncertainty –1.4% Global Medium-term (2–4 yr)
Analytics talent shortage –1.1% Global Long-term (≥4 yr)
Integration complexity with legacy martech stacks –0.9% North America, Europe Medium-term (2–4 yr)
Data accuracy and attribution model fragmentation –0.7% Global Long-term (≥4 yr)


Data Collection Restrictions and Consent Fatigue

Between 2023 and 2025, trackable web sessions decreased by an estimated 25–35% in European markets due to stricter consent enforcement under GDPR and ePrivacy rules [4]. The analytical value proposition deteriorates when one-third of user interactions become invisible. The Web Analytics Market requires vendors to make significant investments in privacy-preserving measurement methods and consent management integrations, which reduces profits and delays enterprise procurement schedules.


Cookie Deprecation Uncertainty

Google's extended timeline for third-party cookie removal in Chrome created planning paralysis across the Web Analytics Market ecosystem. A 2024 IAB survey found that 42% of advertisers delayed analytics vendor evaluations pending clarity on Google's Privacy Sandbox roadmap [12]. This uncertainty stalled migration budgets and fragmented industry standards, creating a drag on growth that persists until a stable, cross-browser identity layer emerges.

Analytics Talent Shortage

Data science jobs are expected to rise by 35% through 2032, greatly exceeding supply, according to the U.S. Bureau of Labor Statistics [13]. Underutilization occurs when businesses buy advanced analytics platforms but lack the staff to set up, analyze, and act upon the data. This lowers renewal rates and limits the growth of the web analytics industry in mid-market segments.


Web Analytics Market Opportunities

AI-Powered Predictive Analytics Platforms

The convergence of large language models with behavioral analytics creates an opportunity for vendors to offer "ask your data" interfaces that democratize insight access. Platforms embedding predictive churn scoring, automated funnel recommendations, and generative reporting stand to capture a disproportionate share in the Web Analytics Market as enterprise buyers consolidate their analytics stacks around AI-native architectures.

Emerging Market Digital Adoption

According to recent Google-Temasek research, Southeast Asian digital economies continue to grow at a rate of about 15% per year, and by mid-2026, India's Unified Payments Interface processed over 23 billion transactions per month. In areas where analytics penetration is still less than 20% of targeted firms, each of these transactions necessitates measurement infrastructure, opening up a greenfield potential for the web analytics market.


Server-Side Analytics Monetization

Server-side tagging and data clean rooms represent a new revenue model where analytics vendors charge for data processing infrastructure rather than just reporting dashboards. This shift toward infrastructure-as-analytics expands the total addressable market and raises average contract values, particularly in regulated verticals like financial services and healthcare.

Healthcare and Public Sector Digitization

Government digital service mandates — including the U.S. 21st Century Cures Act and the EU's European Health Data Space initiative — are driving public sector organizations to deploy analytics across patient portals, benefits platforms, and citizen engagement sites [17]. Healthcare and life sciences represent the fastest-growing vertical CAGR in the Web Analytics Market.

Edge Analytics and Real-Time Personalization

The proliferation of CDN-edge computing enables sub-100ms personalization decisions at the point of content delivery. Vendors integrating analytics decisioning into edge infrastructure can capture real-time optimization budgets that currently sit outside traditional Web Analytics Market boundaries, expanding the category definition and revenue potential.


Web Analytics Market Future Outlook

AI-Native Analytics and Autonomous Optimization

Most enterprise analytics platforms will incorporate autonomous optimization agents by 2028 that can detect anomalies in performance, suggest remedial measures, and carry out authorized modifications without the need for human intervention. With AI agents handling real-time bid adjustments, content personalization, and funnel optimization at machine speed, the web analytics market is transitioning from a passive reporting layer to an operational decision engine.


Privacy-First Measurement Architecture

The industry's shift from third-party to first-party measurement paradigms has been completed by the global convergence toward comprehensive privacy rules, which today cover around 80% of the world's population. In order to provide high-fidelity insights without the dangers of raw data exposure, the web analytics market is already clustering around providers that offer federated learning, differential privacy, and on-device analytics.


Platform Economics and Vertical Specialization

Horizontal analytics platforms will face increasing pressure from vertically specialized alternatives tailored to healthcare compliance, financial services regulation, and public sector accessibility mandates. This fragmentation creates acquisition opportunities for large vendors and niche growth corridors within the Web Analytics Market, with vertical specialists commanding premium pricing.

Composable Data Stack Integration

The emergence of composable CDP-analytics architectures — built on warehouse-native foundations like Snowflake and Databricks — will redefine the boundaries of the Web Analytics Market. Analytics vendors that integrate directly with cloud data warehouses, eliminating data duplication and reducing infrastructure costs, will capture enterprise budgets currently split across multiple point solutions [8].


Web Analytics Market Segmentation

By Application

Segment Key Metric Primary Demand Driver
Online Marketing & Marketing Automation 43.5% share (2025) Campaign performance optimization and ROI measurement
Customer Journey Mapping CAGR of 17.07% Full-funnel attribution and CX investment justification
Mobile Analytics USD 1.24 Billion (2025) Mobile commerce and app-web hybrid measurement
Social Media Management CAGR of 14.80% Cross-platform engagement and influence tracking
Content Marketing 8.9% share (2025) Content ROI and engagement scoring


Online Marketing and Marketing Automation dominate the Web Analytics Market by application, reflecting the deep integration between analytics platforms and campaign execution systems. Enterprises require closed-loop measurement from ad impression through purchase, and platforms offering native connections to demand-side platforms, email systems, and CRM databases capture the largest share. Customer Journey Mapping represents the fastest-growing application as organizations recognize that optimizing isolated channels delivers diminishing returns — the competitive advantage lies in understanding cross-channel sequences and attributing revenue to multi-touch pathways.

By Offering

Segment Key Metric Primary Demand Driver
Solutions 68.3% share (2025) Self-service platform and dashboard demand
Services CAGR of 17.17% Implementation, integration, and managed analytics


Solutions dominate the Web Analytics Market by offering, as enterprises prefer self-service platforms that reduce dependency on external consultants. The Services segment grows faster, driven by implementation complexity associated with server-side migration, privacy compliance configuration, and AI model training that requires specialized expertise.

By Deployment Model

Segment Key Metric Primary Demand Driver
Cloud-Based 72.2% share (2025) Scalability, real-time processing, reduced infrastructure cost
On-Premises CAGR of 12.30% Data sovereignty requirements in regulated industries


Cloud-Based deployment holds the majority share in the Web Analytics Market, benefiting from elastic compute capacity that handles traffic spikes during promotional events and seasonal peaks. On-Premises solutions maintain relevance among financial institutions and government agencies bound by strict data residency requirements.

By Organization Size

Segment Key Metric Primary Demand Driver
Large Enterprises 58.2% share (2025) Complex multi-property analytics and global compliance
Small and Medium Enterprises CAGR of 16.59% Affordable cloud analytics platforms and PLG adoption


Large Enterprises command the majority of Web Analytics Market revenue through multi-year platform contracts and custom implementation engagements. SMEs represent the fastest-growing segment as product-led growth models from vendors like Amplitude and Mixpanel reduce time-to-value and lower entry price points.

By End-User Vertical

Segment Key Metric Primary Demand Driver
Retail & E-Commerce 30.1% share (2025) Transaction optimization and personalization
Healthcare & Life Sciences CAGR of 17.12% Patient portal analytics and compliance measurement
BFSI USD 1.41 Billion (2025) Regulatory reporting and digital banking optimization
Manufacturing CAGR of 14.50% B2B commerce and distributor portal analytics
Media & Entertainment 11.8% share (2025) Content performance and subscription optimization


Retail and E-Commerce leads the Web Analytics Market by vertical, as every percentage-point improvement in checkout completion translates directly to revenue. Healthcare and Life Sciences emerges as the fastest-growing vertical, propelled by government mandates for patient portal measurement and the rapid digitization of pharmaceutical marketing channels.


Regional Market Share Analysis

Region Share of Global Market (2025) Primary Investment Themes
North America 40.4% Enterprise SaaS consolidation, privacy compliance
Europe 25.2% GDPR-driven architecture overhauls, consent management
Asia-Pacific 22.1% Mobile commerce analytics, digital payment ecosystems
South America 5.9% E-commerce platform adoption, SME digitization
Middle East & Africa 6.4% Government digital transformation, fintech measurement
Total 100.0%

The Web Analytics Market exhibits distinct regional dynamics shaped by regulatory maturity, digital infrastructure investment, and enterprise technology adoption curves.

 

North America

Country Key Metric Key Driver
US 78.5% of regional share Largest enterprise SaaS buyer base globally
Canada CAGR of 15.20% Federal Digital Standards mandate analytics adoption
Mexico USD 0.22 Billion (2025) Retail digitization and fintech expansion


The United States dominates the North American Web Analytics Market through a combination of headquartered vendor ecosystems, mature enterprise procurement processes, and regulatory drivers including the California Consumer Privacy Act. Canada's federal government mandated analytics implementation across all public-facing digital services in 2024 [18], creating institutional demand. Mexico's rapidly growing e-commerce sector — expanding at 25% annually — drives SME analytics adoption.

Europe

Country Key Metric Key Driver
Germany 22.8% of regional share Manufacturing sector digital commerce expansion
UK CAGR of 15.90% Post-Brexit independent data governance framework
France USD 0.39 Billion (2025) Retail and luxury sector personalization investment
Italy CAGR of 14.80% SME digital transformation incentives
Spain 8.1% of regional share Tourism sector measurement demand
Nordic Countries CAGR of 15.50% Privacy-first analytics innovation hub
Russia USD 0.11 Billion (2025) Domestic platform development
Rest of Europe 14.3% of regional share Varied digital maturity across Eastern Europe


Europe's Web Analytics Market is shaped by GDPR, which simultaneously constrains data collection methods and accelerates investment in compliant analytics infrastructure. Germany leads on enterprise adoption, while the UK benefits from financial services sector demand. The Nordic countries serve as an innovation testbed for privacy-preserving measurement technologies.

Asia-Pacific

Country Key Metric Key Driver
China 34.6% of regional share Domestic platform ecosystem (Alibaba, Tencent)
India CAGR of 18.20% Digital payment and e-commerce explosion
Japan USD 0.29 Billion (2025) Enterprise analytics modernization
South Korea CAGR of 16.40% Mobile commerce leadership
ASEAN 15.7% of regional share Cross-border e-commerce growth
Rest of Asia-Pacific CAGR of 14.90% Varied digital infrastructure maturity


Asia-Pacific represents the fastest-growing region in the Web Analytics Market, propelled by mobile-first consumer populations and rapidly scaling digital economies. India's analytics adoption is accelerating as UPI-driven commerce creates demand for real-time transaction measurement. China's domestic analytics ecosystem — built around WeChat, Alibaba Cloud, and Baidu Analytics — operates largely independently from Western vendor stacks.

South America

Country Key Metric Key Driver
Brazil 58.2% of regional share Pix payment system drives digital commerce measurement
Argentina CAGR of 15.10% E-commerce sector expansion
Rest of South America USD 0.10 Billion (2025) Early-stage digital transformation


Brazil anchors the South American Web Analytics Market, with its Pix instant payment infrastructure processing over 4 billion monthly transactions by 2025 and creating massive measurement demand. The broader region remains early-stage, with analytics adoption concentrated among large retailers and financial institutions.

Middle East & Africa

Country Key Metric Key Driver
Saudi Arabia 28.5% of regional share Vision 2030 digital economy initiatives
UAE CAGR of 16.70% Smart government and fintech measurement
South Africa USD 0.07 Billion (2025) Financial services sector analytics demand
Egypt CAGR of 15.30% Digital banking and e-commerce emergence
Rest of MEA 24.1% of regional share Fragmented but growing digital ecosystems


Saudi Arabia's Vision 2030 program has allocated significant budget to digital economy infrastructure, including mandated analytics for government portals and national e-commerce platforms. The UAE leads in analytics sophistication, with Dubai's Smart City initiative requiring measurement across all citizen-facing digital services within the Web Analytics Market.


Web Analytics Market By Region, 2025-2035

Competitive Benchmarking

The Web Analytics Market exhibits medium concentration, with the top five vendors controlling an estimated 55–60% of global revenue. The Herfindahl-Hirschman Index (HHI) for this market sits in the 1,200–1,500 range, indicating moderate competitive intensity. Google's free-tier analytics offering creates a unique market dynamic where enterprise-grade paid solutions compete against a zero-cost baseline, pushing vendors to differentiate through advanced AI capabilities, privacy compliance, and professional services.

Company Est. Revenue Share Range Key Offerings for Web Analytics Market Strategic Positioning
Google ~18–22% Google Analytics 4, BigQuery integration, Looker Platform ecosystem lock-in via search and ads
Adobe ~12–16% Adobe Analytics, Customer Journey Analytics Enterprise Experience Cloud integration
Microsoft ~5–8% Clarity, Power BI, Dynamics integration Freemium acquisition with enterprise upsell
Salesforce ~4–7% Tableau, Marketing Cloud Intelligence CRM-native analytics and attribution
Oracle ~3–6% Oracle Analytics Cloud, BlueKai Data management and enterprise cloud suite
IBM ~3–5% Watson Analytics, Instana AI-powered enterprise analytics
SAP ~2–4% SAP Analytics Cloud, Emarsys ERP-integrated customer analytics
Amplitude ~2–4% Product Analytics, CDP, Experiment Product-led growth for digital-native companies
Mixpanel ~1–3% Event analytics, Warehouse Connectors Self-service product analytics for mid-market
SAS Institute ~1–3% Customer Intelligence 360 Advanced statistical modeling and enterprise AI


Recent News & Developments


  • European Commission (July 2024): Published enforcement guidance clarifying that analytics data transfers to U.S.-hosted platforms must comply with the EU-U.S. Data Privacy Framework, affecting vendor selection across the Web Analytics Market [4].


  • Microsoft (March 2024): Expanded Clarity's feature set with AI-generated heatmap summaries and Copilot-powered analytics narratives, strengthening its freemium acquisition strategy [22].
  • Salesforce (January 2024): Integrated Marketing Cloud Intelligence with Data Cloud, enabling real-time analytics unification across marketing, commerce, and service touchpoints [23].


  • Mixpanel (August 2023): Launched warehouse-native architecture allowing enterprises to run analytics queries directly against Snowflake and BigQuery without data duplication, signaling the composable analytics trend [24].


Web Analytics Market Report Scope

Parameter Detail
Market Scope Global Web Analytics Market covering solutions, services, and professional analytics offerings
Study Period 2021–2035
CAGR (Forecast Period) 16.10% (2026–2035)
Market Size (2025) USD 8.54 Billion
Market Size (2035) USD 37.67 Billion
Fastest Growing Segment Healthcare & Life Sciences (by vertical); Customer Journey Mapping (by application)
Companies Profiled Google, Adobe, Microsoft, Salesforce, Oracle, IBM, SAP, Amplitude, Mixpanel, SAS Institute
Valuation Currency USD Billion


FAQs

How do free analytics tools like Google Analytics 4 affect vendor pricing in the paid segment?
Free-tier offerings compress pricing at the entry level but expand the total addressable market by creating analytics literacy. Paid vendors differentiate through enterprise security, raw data access, and SLA-backed support that free tools do not provide [2].
What server-side tagging considerations should enterprises evaluate before migrating from client-side analytics?
Server-side migration requires dedicated cloud infrastructure, increased data processing costs, and engineering resources for tag management. Organizations should assess latency tolerance, consent orchestration complexity, and total cost of ownership before committing [5].
How does the composable CDP-analytics architecture differ from traditional all-in-one platforms?
Composable architectures query data directly in cloud warehouses, eliminating duplication and reducing vendor lock-in. Traditional platforms bundle storage with analytics, offering simplicity but limiting flexibility for multi-tool environments [24].
What compliance risks exist when deploying the Web Analytics Market solutions across multiple jurisdictions?
Cross-border data transfer rules vary by jurisdiction, and a configuration valid in one country may violate another's privacy law. Enterprises need region-specific consent frameworks and data residency controls [4].
How should mid-market companies evaluate build-versus-buy decisions for the Web Analytics Market?
Building custom analytics demands sustained engineering investment and ongoing maintenance that most mid-market teams cannot sustain. Purchasing proven platforms with open APIs offers faster time-to-value and predictable costs [14].
What role do data clean rooms play in the evolving Web Analytics Market ecosystem?
Clean rooms enable privacy-safe data collaboration between advertisers, publishers, and analytics platforms without exposing raw user-level records. They are becoming essential for attribution in cookieless environments [12].
How will edge computing reshape analytics data collection in the Web Analytics Market by 2030?
Edge nodes will process analytics events at CDN locations, reducing latency and enabling real-time personalization without round-trips to centralized servers. This shift expands analytics into performance optimization use cases [8].    
Author
Author
Author Profile
Ankit Gupta LinkedIn
Team Lead - Research
Ankit Gupta is a seasoned market intelligence and strategic research professional with over six plus years of experience in the ICT and Semiconductor industries. With academic roots in Telecom, Marketing, and Electronics, he blends technical insight with business strategy. Ankit has led 200+ projects, including work for Fortune 500 clients like Microsoft and Rio Tinto, covering market sizing, tech forecasting, and go-to-market strategies. Known for bridging engineering and enterprise decision-making, his insights support growth, innovation, and investment planning across diverse technology markets.
Co-Author
Co-Author Profile
Shubham Munde LinkedIn
Team Lead - Research
Shubham brings over 7 years of expertise in Market Intelligence and Strategic Consulting, with a strong focus on the Automotive, Aerospace, and Defense sectors. Backed by a solid foundation in semiconductors, electronics, and software, he has successfully delivered high-impact syndicated and custom research on a global scale. His core strengths include market sizing, forecasting, competitive intelligence, consumer insights, and supply chain mapping. Widely recognized for developing scalable growth strategies, Shubham empowers clients to navigate complex markets and achieve a lasting competitive edge. Trusted by start-ups and Fortune 500 companies alike, he consistently converts challenges into strategic opportunities that drive sustainable growth.

Research Approach


Secondary Research

The secondary research process involved comprehensive analysis of technology standards databases, peer-reviewed computer science journals, digital economy publications, and authoritative ICT organizations. Key sources included the National Institute of Standards and Technology (NIST), International Organization for Standardization (ISO/IEC JTC 1/SC 27), Institute of Electrical and Electronics Engineers (IEEE Xplore Digital Library), US Bureau of Labor Statistics (BLS) Occupational Outlook for IT and Analytics Professionals, OECD Digital Economy Outlook, International Telecommunication Union (ITU) ICT Statistics, US Census Bureau E-commerce and Digital Economy Reports, Eurostat Digital Economy and Society Statistics, World Bank Digital Development Indicators, GSMA Intelligence Connectivity Reports, Interactive Advertising Bureau (IAB) Internet Advertising Revenue Reports, World Wide Web Consortium (W3C) Standards Documentation, Cloud Security Alliance (CSA) Security Guidance, and national digital transformation agency reports from key markets.

Cloud infrastructure data, digital marketing spending trends, cybersecurity compliance frameworks, ICT adoption statistics, and MarTech ecosystem analysis for search engine tracking, heat map analytics, social media management, and display advertising optimization solutions were all gathered from these sources.


Primary Research

In order to gather both qualitative and quantitative insights, supply-side and demand-side stakeholders were interviewed during the primary research phase. CEOs, CTOs, Chief Data Officers, Chief Analytics Officers, and VPs of Engineering from cloud infrastructure firms, MarTech suite suppliers, web analytics platform providers, and independent software vendors were examples of supply-side sources. Demand-side sources included e-commerce directors, chief marketing officers, chief digital officers, heads of digital marketing and growth, and IT decision-makers from manufacturing conglomerates, retail businesses, financial institutions, healthcare systems, and digital-first companies. Primary research verified product roadmap timescales for AI/ML integration, evaluated market segmentation across deployment modes (cloud vs. on-premise), and collected information on platform adoption trends, subscription price dynamics, and data privacy compliance tactics.

Primary Respondent Breakdown:

By Designation: C-level Primaries (32%), Director Level (30%), Others (38%)

By Region: North America (38%), Europe (25%), Asia-Pacific (32%), Rest of World (5%)


Market Size Estimation

Customer deployment analysis and annual recurring revenue (ARR) mapping were used to determine the global market valuation. The methods included:

Finding more than 40 important suppliers in North America, Europe, Asia-Pacific, and Latin America, including business MarTech suites (Google, Adobe, IBM, Oracle, SAP, Microsoft) and pure-play online analytics providers (Mixpanel, Heap, Matomo, Piwik PRO)

Solution mapping for conversion optimization tools, clickstream analysis, heat map analytics, and search engine tracking and ranking

Examination of yearly earnings for web analytics and digital intelligence portfolios that have been disclosed and projected

coverage of suppliers who will account for 75–80% of the world market in 2024

Extrapolation of segment-specific valuations for social media management, display advertising optimization, professional services, and managed services deployments using top-down (category spend analysis and vendor revenue validation) and bottom-up (enterprise customer count × average revenue per user by country/vertical) approaches

Download Free Sample

Kindly complete the form below to receive a free sample of this Report

Download PDF ×

We do not share your information with anyone. However, we may send you emails based on your report interest from time to time. You may contact us at any time to opt-out.















