Wireless Connectivity Market Segmentation
Wireless Connectivity Market By Technology (USD Billion, 2025-2035)
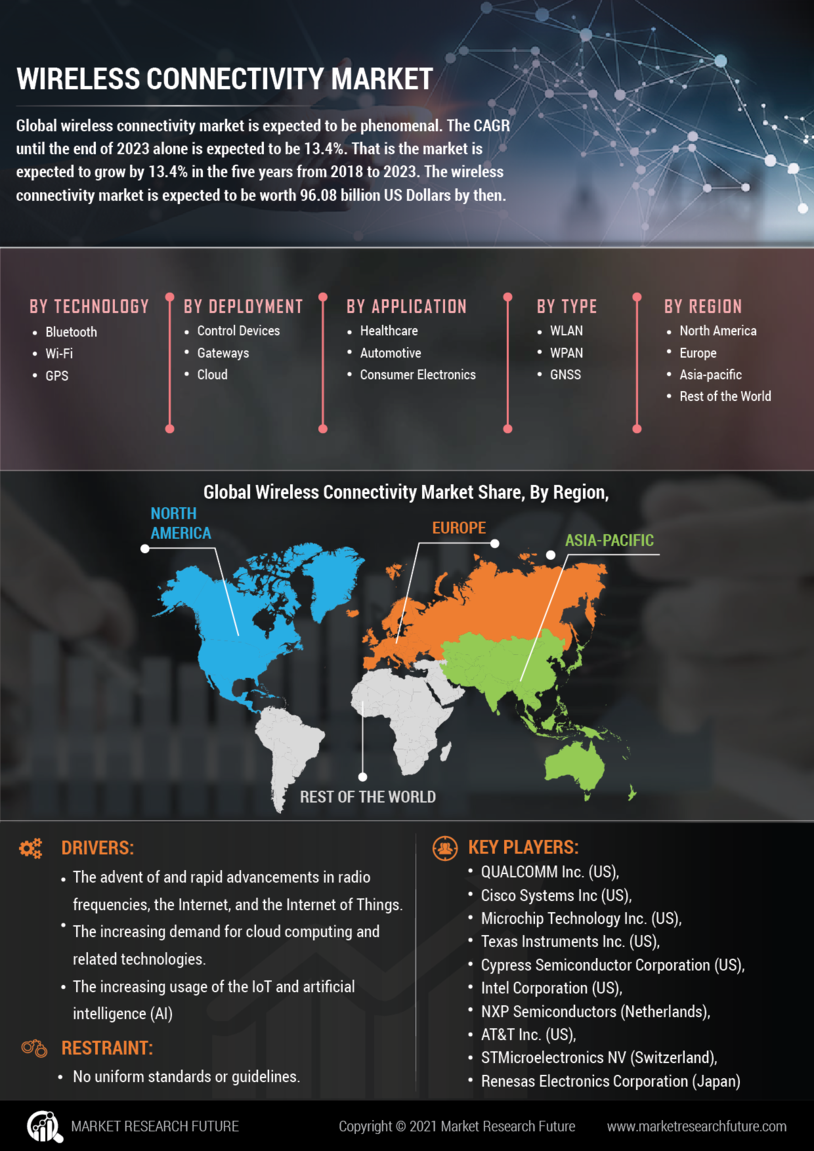
- Bluetooth
- WiFi
- GPS
- Ultra Wide
- NFC
- Cellular
- ZigBee
- SigFox
- Lora
- Others
Wireless Connectivity Market By Type (USD Billion, 2025-2035)
- WLAN
- WPAN
- Satellite
- Cellular M2M
Wireless Connectivity Market By Application (USD Billion, 2025-2035)
- Wireless Connectivity Market
- Public safety
- Wearable devices
- Energy
- Automotive
- Consumer electronics
- Others