Xanthan Gum Market (2026 - 2035)

Xanthan Gum Market Size, Share, Industry Trend & Analysis Research Report Information By Form (Dry, Liquid), By Application (Food and Beverages, Oil and Gas, Pharmaceuticals, Personal Care and Cosmetics, Other Applications), By Geography (North America, Europe, Asia-Pacific, South America, Middle East & Africa) – Forecast Till 2030
ID: MRFR/FnB/0264-CR
128 Pages
Sakshi Gupta
Last Updated: July 02, 2026
Xanthan Gum Market
Market Size
Forecast Period2026-2035
CAGR (2026-2035)3.6%
2025 Market SizeUSD 832.50 Million
2035 Market SizeUSD 1,184.00 Million
Key Players
CP Kelco
Fufeng Group
Deosen Biochemical
Cargill
ADM
Jungbunzlauer
Opportunities
  • Pharmaceutical Sustained-Release Excipients
  • High-Purity Grades for Personal Care
  • Emerging-Market Penetration in Africa and Southeast Asia

Xanthan Gum Market Summary

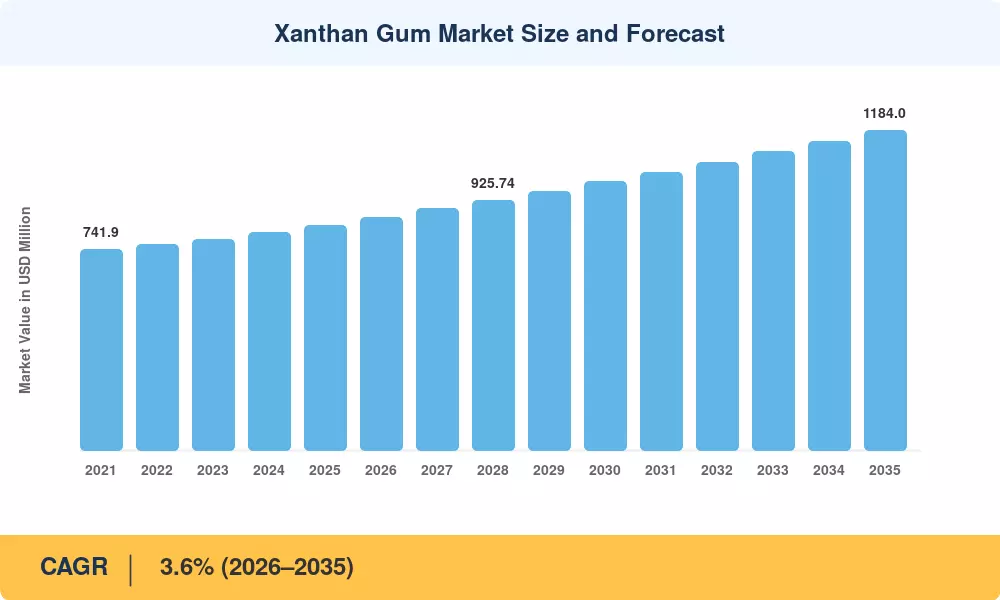
The global Xanthan Gum Market reached USD 832.50 Million in 2025 and is projected to expand from USD 862.50 Million in 2026 to USD 1,184.00 Million by 2035, registering a CAGR of 3.6% across the forecast period. Accelerating demand from clean-label food manufacturers and tightening oilfield chemical specifications are the two structural catalysts anchoring this trajectory. Regulatory pushes toward transparent ingredient labeling in the EU and North America have compelled food processors to replace synthetic stabilizers with naturally fermented alternatives, channeling fresh capital into xanthan gum production infrastructure [1].

The production landscape is undergoing a quiet but meaningful transformation. Legacy batch-fermentation facilities — many built in the 1990s — are giving way to continuous-fermentation platforms that cut cycle times by 30–40% and reduce wastewater discharge. China's Ministry of Industry and Information Technology allocated approximately USD 120 Million in upgrade subsidies for bio-based additive plants between 2023 and 2025, catalyzing capacity modernization across Shandong and Inner Mongolia provinces [2]. These investments are reshaping supply economics and tilting cost advantages further toward Asian producers.

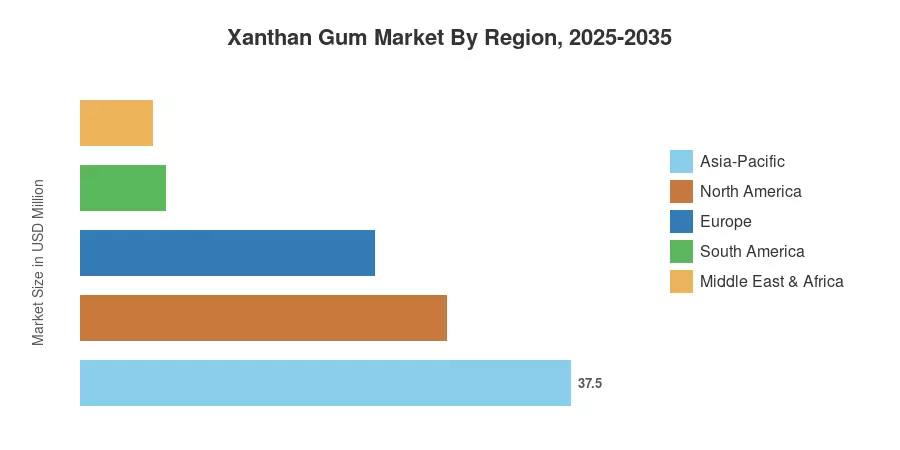
Asia-Pacific commands roughly 37.5% of global revenue, functioning as both the largest production hub and the fastest-growing consumption region at a projected 4.2% CAGR through 2035. North America holds the second position with 28.0% share, sustained by robust oilfield services demand and premium food-grade applications. Europe accounts for approximately 22.5%, driven by stringent additive regulations that favor high-purity grades. As plant-based food categories continue their double-digit expansion and shale drilling activity rebounds, the Xanthan Gum Market is positioned for steady compounding over the coming decade.

Key Report Takeaways

• By Form

  • Dry xanthan gum represented approximately 80% of total Xanthan Gum Market revenue in 2025, reflecting its shelf stability and ease of transport across intercontinental supply chains.
  • Liquid grades are forecast to register a 5.7% CAGR through 2035, gaining traction in ready-to-use cosmetic and pharmaceutical formulations.

• By Application

  • Food and beverages accounted for a 44.5% share of the Xanthan Gum Market in 2025, led by sauces, dressings, and dairy-alternative categories.
  • Oil and gas drilling fluids represent the second-largest application, expanding as operators in the Permian Basin and Middle Eastern fields specify xanthan-based muds for high-salinity formations.

• By Region

  • Asia-Pacific held a 37.5% share of the Xanthan Gum Market, with China's fermentation clusters supplying over half of global production volume.
  • North America is projected to grow at a 3.3% CAGR through 2035, buoyed by shale-sector recovery and premiumization of food-grade gum specifications.

Market Size and Forecast (2021–2035)

Market Research Future's estimates draw on primary interviews with 45+ industry participants, customs-trade databases, corporate filings, and proprietary demand models validated against production-capacity audits across six countries.
Xanthan Gum Market Size and Forecast
Our Impact
Enabled $4.3B Revenue Impact for Fortune 500 and Leading Multinationals
Partnering with 2000+ Global Organizations Each Year
30K+ Citations by Top-Tier Firms in the Industry

Driver Impact Analysis

Driver ~% Impact on CAGR Geographic Relevance Impact Timeline
Clean-label food reformulation mandates +0.7% Global Short-term (≤2 yr)
Plant-based dairy and meat-alternative expansion +0.6% North America, Europe Medium-term (2–4 yr)
Shale and deepwater drilling fluid specifications +0.5% North America, MEA Medium-term (2–4 yr)
Continuous-fermentation process optimization +0.4% Asia-Pacific Long-term (≥4 yr)
Pharmaceutical excipient grade adoption +0.3% Europe, North America Long-term (≥4 yr)
Personal care and cosmetics texture innovation +0.2% Asia-Pacific, Europe Medium-term (2–4 yr)
Gluten-free product proliferation +0.2% Global Short-term (≤2 yr)


Clean-Label Food Reformulation

The EU's Farm-to-Fork strategy targets a 50% reduction in synthetic food additives by 2030, directly benefiting naturally derived thickeners. In the United States, the FDA's updated GRAS framework has streamlined approvals for fermentation-derived hydrocolloids, lowering compliance costs by an estimated 15% since 2023 [1]. Major retailers, including Walmart and Carrefour, now mandate clean-label ingredient lists across private-label ranges, compelling suppliers to substitute synthetic alternatives with xanthan gum across sauces, dressings, and bakery mixes.

Plant-Based Food Category Expansion

Global plant-based food retail sales surpassed USD 28 Billion in 2024, with oat-milk and pea-protein product lines growing at 12–18% annually [4]. Xanthan gum serves as a critical texture-building agent in these formulations, preventing phase separation in non-dairy beverages and providing mouthfeel parity with conventional dairy. Producers such as Oatly and Beyond Meat have increased xanthan gum procurement volumes by roughly 20% year-over-year since 2022, creating a durable demand floor for food-grade output.

Oilfield Drilling Fluid Specifications

The American Petroleum Institute's updated Recommended Practice 13B now specifies viscosity modifier performance thresholds that favor xanthan-based systems over guar alternatives in high-temperature, high-salinity environments [5]. Permian Basin operators report 8–12% lower fluid-loss rates when using premium xanthan gum grades, translating to reduced non-productive drilling time. With the global horizontal well count projected to rise 6% annually through 2030, oilfield demand for the Xanthan Gum Market is set to strengthen considerably.

Continuous-Fermentation Technology Gains

Transitioning from batch to continuous fermentation cuts production cycle time from 72 hours to approximately 42 hours while improving xanthan yield per liter of broth by 25% [2]. Chinese producers Fufeng Group and Meihua Holdings have commissioned continuous-process lines in Inner Mongolia, collectively adding 35,000 metric tons of annual capacity by 2025. These efficiency gains compress unit costs and expand margin headroom, reinforcing Asia-Pacific's position as the cost-competitive supply center for the Xanthan Gum Market.

Restraints Impact Analysis

Restraint ~% Impact on CAGR Geographic Relevance Impact Timeline
Raw-material price volatility (corn, sugar) –0.4% Global Short-term (≤2 yr)
Fermentation wastewater regulatory costs –0.3% Asia-Pacific Medium-term (2–4 yr)
Competition from alternative hydrocolloids –0.3% Europe, North America Long-term (≥4 yr)
Energy-intensive drying processes –0.2% Global Medium-term (2–4 yr)
Trade tariff and anti-dumping actions –0.2% North America, Europe Short-term (≤2 yr)


Raw-Material Price Volatility

Corn and sugarcane — the primary carbon substrates for Xanthomonas campestris fermentation — have experienced 18–25% price swings annually since 2022, driven by climate disruptions and biofuel mandates competing for feedstock [9]. Chinese producers source approximately 70% of their corn domestically, but Shandong Province corn prices surged 22% in H2 2024 following drought conditions. This volatility compresses processor margins and introduces planning uncertainty across the Xanthan Gum Market supply chain.

Wastewater Compliance Costs

China's Ministry of Ecology and Environment tightened COD (chemical oxygen demand) discharge limits for fermentation facilities by 30% in 2024, requiring producers to invest USD 8–15 Million per plant in advanced treatment systems [10]. Smaller operators lacking the capital to retrofit face potential shutdowns, while larger players absorb compliance costs that reduce short-term profitability. The regulation affects an estimated 40% of China's xanthan gum production base, creating a near-term drag on the Xanthan Gum Market's cost structure.

Competition from Alternative Hydrocolloids

Gellan gum and welan gum are gaining formulation share in premium food and pharmaceutical applications, offering specific textural profiles that xanthan gum cannot replicate at comparable concentrations [11]. Gellan gum adoption in plant-based yogurts grew approximately 15% in 2024, partly at xanthan's expense. While xanthan gum retains clear advantages in oilfield and general food applications, niche erosion in high-value segments poses a competitive pressure on the broader Xanthan Gum Market.

Xanthan Gum Market Opportunities

Pharmaceutical Sustained-Release Excipients

Because of the capacity to build hydrophilic matrices for controlled drug release, xanthan gum is a cost-effective excipient for oral dosage forms. The global market for sustained-release medication delivery is expected to exceed USD 45 Billion by 2030, and formulators are currently investigating fermentation-derived polymers as alternatives to synthetic cellulose ethers [6]. Early adopters in Xanthan Gum Market will be able to charge a premium price, 25-40% above food grade norms.


High-Purity Grades for Personal Care

For quality skincare, rheology modifiers must provide a luscious texture with no residue. Ultra-clarified xanthan gum grades, produced through membrane filtration, cost 50–60% more than regular food-grade material. The global clean-beauty segment is growing at 9 percent per annum, and businesses investing in purification technologies can tap into a margin rich adjacency within the Xanthan Gum Market.


Emerging-Market Penetration in Africa and Southeast Asia

The packaged food business in sub-Saharan Africa is growing at 7-8% per annum, although the per-capita xanthan gum consumption is still below 5 grams - approximately one eighth of the North American levels [14]. Similarly, ASEAN markets are increasing the output of processed food to feed growing urban populations. Establishing regional distribution agreements and smaller-format packaging can lead to volume growth in these underpenetrated territories for the Xanthan Gum Market.


Data-Driven Fermentation Optimization

By employing industrial IoT sensors and machine-learning models in fermentation lines, the batch variability can be reduced by 30% and energy usage by 12–18% per kilogram of output [15]. Licensing or consulting services around process-optimization data can allow producers to construct a recurring revenue layer on top of commodity gum sales, therefore diversifying income streams in the Xanthan Gum Market.


Oilfield Services in the Middle East Expansion Cycle

Saudi Aramco's 2024–2030 upstream capital program allocates over USD 50 Billion to maintain plateau production, requiring high-performance drilling fluids compatible with high-salinity reservoirs [5]. Xanthan gum's salt tolerance and shear-thinning behavior make it the preferred choice, and Middle Eastern procurement contracts typically lock in three-to-five-year supply agreements — a stability premium few other demand segments offer.

Xanthan Gum Market Future Outlook

Precision Fermentation and Bioprocess 4.0

Industrial biotechnology is entering a data-intensive era where AI-guided fermentation control systems optimize yield in real time. By 2030, an estimated 40% of new xanthan gum capacity is expected to incorporate digital-twin monitoring, compressing development cycles and reducing off-spec production by up to 35% [15]. The Xanthan Gum Market will increasingly reward producers that integrate sensor networks and predictive analytics into their manufacturing operations.

Sustainability and Carbon-Footprint Certification

Consumer-packaged-goods companies are setting Scope 3 emissions targets that flow upstream to ingredient suppliers. Life-cycle assessments indicate that xanthan gum production generates 4.2–5.8 kg CO₂-equivalent per kilogram, and buyers are seeking verified environmental product declarations [21]. Producers that achieve third-party carbon-footprint certification will command 10–15% price premiums by 2028, reshaping competitive dynamics within the Xanthan Gum Market.

Regulatory Harmonization Across Trade Blocs

The Codex Alimentarius Commission is working toward unified maximum-use-level specifications for xanthan gum in processed foods, a development that would simplify cross-border trade [22]. Simultaneously, China's GB standards alignment with international food-additive codes is reducing technical barriers for exporters. Harmonized standards will lower compliance costs and expand addressable markets for the Xanthan Gum Market through 2035.

New Application Frontiers in Construction and Textiles

Beyond food and oil, xanthan gum is finding niche applications in cement-slurry modification, textile printing pastes, and 3D-printing bioinks. The global 3D-bioprinting market alone is forecast to reach USD 4.5 Billion by 2032. While these segments remain small relative to food and oilfield, their high-value nature and rapid growth offer diversification pathways for xanthan gum producers seeking to reduce commodity-cycle exposure in the Xanthan Gum Market.

Xanthan Gum Market Segmentation

By Form

Segment Key Metric Primary Demand Driver
Dry ~80% share (2025) Shelf stability, cost-efficient bulk transport
Liquid 5.7% CAGR (2026–2035) Ready-to-use convenience in cosmetic and pharma applications


Dry xanthan gum dominates the Xanthan Gum Market because powder formats integrate seamlessly into existing blending and dispersion workflows at food, pharmaceutical, and oilfield-chemical facilities. Liquid grades, though a small fraction of revenue today, are expanding rapidly as cosmetic and pharmaceutical manufacturers seek pre-dispersed solutions that eliminate hydration steps. Contract manufacturers in personal care report that liquid xanthan gum reduces formulation cycle time by approximately 20%, justifying a 30–35% price premium over dry equivalents.

By Application

Segment Key Metric Primary Demand Driver
Food and Beverages 44.5% share (2025) Texture optimization in sauces, dressings, and plant-based alternatives
Oil and Gas USD 185.30 Million (2025) Drilling-fluid viscosity requirements in high-salinity formations
Pharmaceuticals 4.8% CAGR (2026–2035) Sustained-release excipient adoption in oral dosage forms
Personal Care and Cosmetics USD 78.40 Million (2025) Rheology modification in lotions, serums, and hair care
Other Applications 3.1% CAGR (2026–2035) Construction additives, textile printing, and agriculture


Food and beverages remain the revenue backbone of the Xanthan Gum Market, with sauces, dressings, and dairy alternatives collectively absorbing the largest share of food-grade output. The transition to plant-based proteins has been particularly catalytic — xanthan gum provides the viscosity and emulsion stability that plant-based milks and yogurts require to mimic conventional dairy texture. In oil and gas, operators in the Permian Basin and Middle East are specifying xanthan-based drilling muds for wells exceeding 15,000 feet, where salt tolerance and thermal stability are critical performance differentiators for the Xanthan Gum Market.

Regional Market Share Analysis

Region 2025 Share (%) Primary Investment Themes
Asia-Pacific 37.5 Fermentation scale, domestic packaged-food demand
North America 28.0 Oilfield services, clean-label food processing
Europe 22.5 Regulatory-driven purity upgrades, personal care
South America 6.5 Agricultural processing, import substitution
Middle East & Africa 5.5 Upstream oil & gas, nascent food manufacturing
Total 100.0

The Xanthan Gum Market's regional landscape reflects both production concentration and end-use diversity across five macro-regions.


North America

Country Key Metric Key Driver
US 3.2% CAGR (2026–2035) Permian Basin drilling and premium food-grade demand
Canada USD 32.40 Million (2025) Oil sands operations and clean-label bakery
Mexico 4.1% CAGR (2026–2035) Processed-food export growth to the US


The United States accounts for the overwhelming majority of North American revenue, driven by a dual demand structure: high-purity food-grade xanthan gum for CPG manufacturers and technical-grade material for oilfield service companies. Canada's oil sands operations in Alberta consume significant volumes of drilling-grade gum, while Mexico's expanding food-processing sector — particularly in the salsa, sauce, and dairy-alternative categories — is growing export volumes to US retail chains under USMCA tariff provisions [16].

Europe

Country Key Metric Key Driver
Germany USD 42.80 Million (2025) Industrial food processing and pharmaceutical excipients
UK 3.0% CAGR (2026–2035) Plant-based food innovation
France USD 28.50 Million (2025) Cosmetics and personal care formulations
Italy 2.8% CAGR (2026–2035) Bakery and pasta sauce applications
Spain USD 14.20 Million (2025) Olive-oil-based dressing formulations
Nordic Countries 3.4% CAGR (2026–2035) Oat-milk and dairy-alternative production
Russia USD 9.80 Million (2025) Domestic food-processing import substitution
Rest of Europe 2.9% CAGR (2026–2035) Diversified food and industrial demand


Europe's Xanthan Gum Market is shaped by the EU's stringent food-additive approval framework under Regulation (EC) No 1333/2008, which favors suppliers with robust quality-documentation systems. Germany leads regional consumption through its industrial food-processing clusters and pharmaceutical excipient demand. France's prominence in prestige cosmetics creates a premium channel for ultra-clarified grades, while Nordic countries are emerging as fast-growth pockets driven by the oat-milk production boom [17].

Asia-Pacific

Country Key Metric Key Driver
China USD 198.60 Million (2025) Dominant global production base and growing domestic consumption
India 5.0% CAGR (2026–2035) Packaged food expansion and pharmaceutical manufacturing
Japan USD 38.90 Million (2025) High-purity food and cosmetic grades
South Korea 4.3% CAGR (2026–2035) K-beauty cosmetics and processed-food innovation
ASEAN USD 22.40 Million (2025) Urbanization-driven processed-food growth
Rest of Asia-Pacific 3.8% CAGR (2026–2035) Diversified industrial and food applications


Asia-Pacific anchors the Xanthan Gum Market as both the world's production engine and its fastest-expanding consumption region. China's Shandong and Inner Mongolia provinces host more than 60% of global fermentation capacity, with Fufeng Group and Deosen Biochemical operating the largest single-site plants. India's pharmaceutical sector — the world's largest generic drug producer — is scaling xanthan gum use as a sustained-release excipient, while South Korea's cosmetics industry demands high-clarity grades for premium skincare lines [18].

South America

Country Key Metric Key Driver
Brazil USD 34.20 Million (2025) Food processing and oilfield demand (pre-salt fields)
Argentina 3.5% CAGR (2026–2035) Agricultural processing and export-oriented food manufacturing
Rest of South America USD 8.90 Million (2025) Emerging food and industrial consumption


Brazil drives over 60% of South America's Xanthan Gum Market revenue through its large-scale food-processing industry and Petrobras's pre-salt deepwater drilling program, which requires high-performance drilling muds [19]. Argentina's growing soy-based food-export sector and Chile's mining-sector applications for xanthan-based flotation fluids provide supplementary demand channels across the region.

Middle East & Africa

Country Key Metric Key Driver
Saudi Arabia 4.6% CAGR (2026–2035) Aramco upstream expansion program
UAE USD 7.80 Million (2025) Food-processing hub and cosmetics manufacturing
South Africa 3.1% CAGR (2026–2035) Mining and food-processing diversification
Egypt USD 4.50 Million (2025) Growing packaged-food consumption
Rest of MEA 3.6% CAGR (2026–2035) Nascent food and drilling demand


The Middle East & Africa region's Xanthan Gum Market is bifurcated between oil-producing states that consume technical-grade material for drilling and emerging food-manufacturing hubs. Saudi Arabia's Vision 2030 industrialization program is expanding domestic food processing, creating parallel demand for both food-grade and oilfield-grade xanthan gum. The UAE functions as a regional distribution node, re-exporting to East African and South Asian markets [20].

Xanthan Gum Market By Region, 2025-2035

Competitive Benchmarking

The Xanthan Gum Market exhibits medium concentration, with the top five producers accounting for an estimated 45–55% of global revenue. China-based manufacturers hold structural cost advantages due to feedstock proximity and fermentation scale, while Western players compete on purity certification, technical support, and application-specific grade development. The Herfindahl-Hirschman Index is estimated at 900–1,200, indicating a moderately fragmented competitive field.

Company Est. Revenue Share Range Key Offerings Strategic Positioning
CP Kelco (J.M. Huber) ~10–14% Food, pharma, and industrial grades; KELTROL® brand Premium purity and global technical support
Fufeng Group ~9–12% Food and oilfield grades; integrated corn processing Cost leader with vertically integrated supply chain
Deosen Biochemical ~7–10% Food, cosmetic, and drilling grades Large-scale fermentation in Inner Mongolia
Cargill ~5–8% Food-grade xanthan gum; texture solutions portfolio Ingredient-systems integration for CPG customers
ADM ~4–7% Food and beverage hydrocolloid blends Broad ingredient portfolio cross-selling
Jungbunzlauer ~4–6% Pharmaceutical and food-grade xanthan gum European quality certification focus
Meihua Holdings Group ~4–6% Food and industrial grades; amino acid co-production Diversified bio-fermentation platform
Ingredion ~3–5% Specialty food-texture systems Application-development partnerships with food brands
Unionchem ~2–4% Food, oil, and cosmetic grades Mid-tier pricing with flexible MOQ
Solvay ~2–4% Specialty drilling-fluid additives Oilfield chemistry integration


Recent News & Developments


  • Cargill (2022) joined together with Singapore’s Economic Development Board to open its first digital business studio in Asia. The studio is aimed to empower local startups with funding that deploy Cargill solutions to the market


  • Jungbunzlauer (September 2024) commits USD 200 million to build Canada’s first xanthan gum production facility in Port Colborne, Ontario, with a USD 4.8 million grant from Invest Ontario. The project will create 50 new jobs and increase North American production capacity, decreasing reliance on imports.


  • Ingredion Incorporated (February 2025) announced a USD 50 million investment in its Cedar Rapids, Iowa facility to expand specialty industrial starch capacity for the packaging and papermaking industries, enhancing the company’s natural polymer portfolio and positioning for growing demand in biodegradable packaging solutions.


Xanthan Gum Market Report Scope

Parameter Detail
Market Scope Global Xanthan Gum Market, covering production, consumption, and trade flows
Study Period 2021–2035
CAGR 3.6% (2026–2035)
Base Year Market Size USD 832.50 Million (2025)
Forecast Endpoint USD 1,184.00 Million (2035)
Fastest Growing Segment Liquid form (by form); Pharmaceuticals (by application); Asia-Pacific (by region)
Companies Profiled 10 (CP Kelco, Fufeng Group, Deosen Biochemical, Cargill, ADM, Jungbunzlauer, Meihua Holdings, Ingredion, Unionchem, Solvay)
Valuation Currency USD Million


FAQs

How does xanthan gum compare to guar gum in drilling-fluid performance?
Xanthan gum delivers superior shear-thinning behavior and salt tolerance, maintaining viscosity in brines above 100,000 ppm TDS where guar degrades. Drilling engineers specify xanthan for deep, high-salinity wells despite its 20–30% cost premium over guar [5].
What purity certifications should food-grade buyers require?
Buyers should verify compliance with the Food Chemicals Codex, EU Regulation 231/2012, and USP-NF monographs. Third-party audits under BRC or FSSC 22000 add supply-chain assurance [6].
Can xanthan gum replace modified starches in dairy-alternative formulations?
Yes, at typical use levels of 0.1–0.3%, xanthan gum provides comparable viscosity and suspension stability. It outperforms modified starches in freeze-thaw stability for frozen dessert applications [4].
What is the typical lead time for bulk xanthan gum procurement from Chinese suppliers?
Standard ocean-freight lead times from Chinese ports to North America range 45–60 days. Buyers should factor 15–20 days for quality testing and customs clearance at destination [13].
How are anti-dumping duties affecting Xanthan Gum Market pricing in North America?
U.S. anti-dumping margins on Chinese xanthan gum range from 11% to 154% depending on the exporter. These duties have shifted some procurement toward Austrian and Brazilian sources [13].
What emerging application offers the highest margin potential for xanthan gum producers?
Pharmaceutical-grade excipient material commands 40–60% price premiums over food-grade product. Regulatory barriers to entry are high, limiting competition and protecting margins [6].
How does the Xanthan Gum Market respond to corn-price spikes?
Producers typically pass through 60–70% of feedstock cost increases within one to two quarters. Long-term supply contracts with price-adjustment clauses mitigate margin erosion for integrated manufacturers [9].
Author
Author
Author Profile
Sakshi Gupta LinkedIn
Team Lead - Research
Currently a Team Lead in consumer goods, FMCG, and F&B, she translates rigorous research into decisive strategy. She develops GTM roadmaps, pricing architectures, and competitive benchmarks for companies across Europe, the US, and APAC. She synthesize insights, align cross-functional teams, and drive execution from brief to measurable outcomes. She leads end-to-end engagements with crisp analysis, compelling storytelling, and a strong command of Power BI, Tableau, SQL, and advanced research platforms.
Download Free Sample

Kindly complete the form below to receive a free sample of this Report

Download PDF ×

We do not share your information with anyone. However, we may send you emails based on your report interest from time to time. You may contact us at any time to opt-out.
















