Xylene Market

Key Players: Sinopec (China Petroleum & Chemical), Saudi Aramco / SABIC, ExxonMobil Chemical, CNPC (PetroChina), BP Chemicals, CEPSA (Compañía Española de Petróleos), Reliance Industries Limited, Toray Industries

Xylene Market

Xylene Market Research Report Information By Product (P-Xylene, O-Xylene, M-Xylene, Mixed Xylene) By End Use (Automotive, Textile, Chemical, Oil and Gas, Leather, Paints and Coating, Other End User) and By Region -Global Forecast to 2035
ID: MRFR/CnM/0495-CR
128 Pages
Chitranshi Jaiswal
Last Updated: June 16, 2026
 

Xylene Market Summary

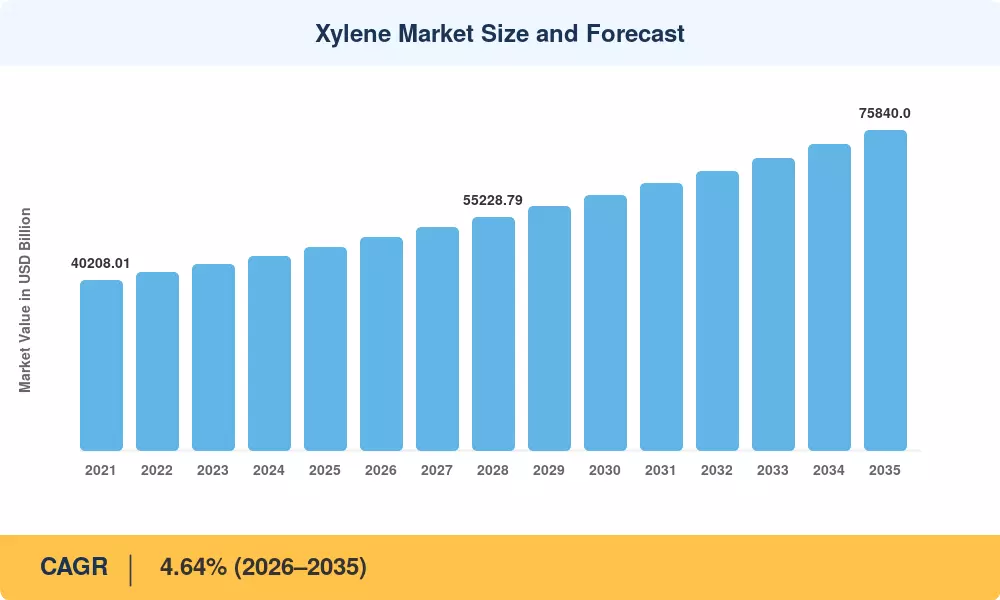
The global Xylene Market was valued at approximately USD 48,210 Million in 2025 and is projected to reach USD 75,840 Million by 2035, expanding at a CAGR of 4.64% over the forecast period 2026–2035. Two catalysts anchor this trajectory: the accelerating global buildout of polyethylene terephthalate (PET) packaging capacity and tightening brand-owner commitments to lower-carbon packaging that drive long-term offtake volumes for paraxylene production. China's 14th Five-Year Plan, which allocated over USD 30 billion toward integrated crude-to-chemicals complexes, has meaningfully widened upstream capacity and reinforced the cost base supporting aromatics yields.

The technological transformation reshaping the Xylene Market centres on the transition from stand-alone naphtha reformers to highly integrated refinery-to-chemicals configurations. Legacy catalytic reforming units in Japan and South Korea now operate below 60% utilisation as Gulf-based and Chinese integrated complexes achieve aromatics yields approaching 40% of feed. Saudi Aramco's Crude-to-Chemicals programme, a USD 100 billion-plus investment platform, and SABIC's integration strategy exemplify the shift that is displacing older European cracker economics. Bio-based xylene routes—while still niche—secured meaningful long-term offtake commitments from major beverage and apparel brands during 2023–2024, signalling that hydrocarbon processing chemicals face structural competition at the margins. [1][4]

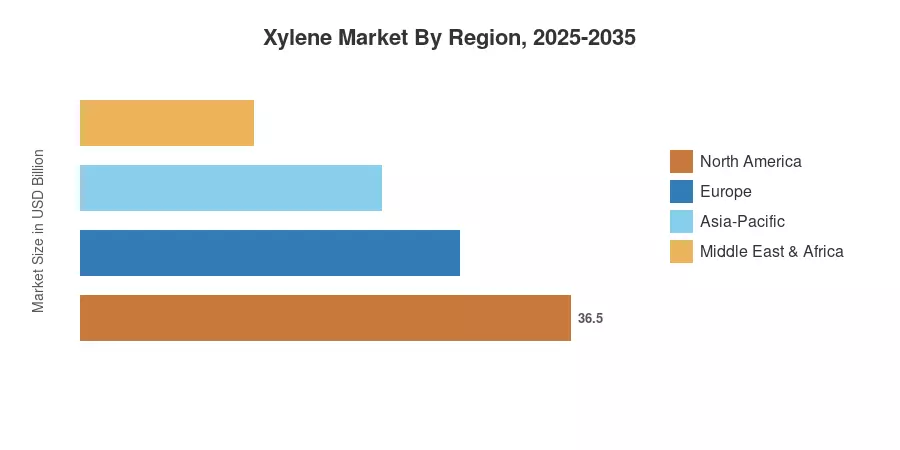
Asia-Pacific commanded roughly 53% of the Xylene Market in 2025 and is expected to maintain the fastest regional CAGR at approximately 4.90% through 2035, driven by China's downstream polymer complex expansions and India's rising demand for industrial solvent chemicals. North America ranked second with around 19% share, underpinned by U.S. Gulf Coast paraxylene capacity expansions and resilient domestic polyester demand. Europe, constrained by VOC regulations and energy costs, contributes an estimated 14% share but remains an innovation hub for bio-based and circular chemical intermediates. The next decade will test how quickly emerging bio-routes can scale against the structural cost advantage of integrated Middle Eastern and Chinese refiners. [2][5]


Key Report Takeaways

• By Type

  • Para-xylene holds approximately 91% of the Xylene Market in 2025, reflecting its dominant role in paraxylene production for PET resin and polyester fibre
  • Ortho-xylene is forecast to grow at a 4.52% CAGR through 2035, driven by rising phthalic anhydride demand in alkyd resins and paint solvent materials
  • Meta-xylene, while the smallest isomer segment, is gaining traction in isophthalic acid production for specialty polyesters

• By Source

  • The Xylene Market shows petroleum-based streams accounting for roughly 96% share in 2025
  • Bio-based alternatives are projected to expand at a CAGR above 6.1% through 2035


• By Grade

  • High-purity grade is the fastest-growing grade segment in the Xylene Market, advancing at approximately 5.1% CAGR as semiconductor and pharmaceutical solvent specifications tighten

• By Region

  • Asia-Pacific leads with approximately 53% share of the Xylene Market and posts the highest regional CAGR at 4.90%
  • North America and Europe combined represent about 33% of the Xylene Market volume, with diverging outlooks shaped by energy transition policies


Market Size and Forecast (2021–2035)

MRFR's estimates are built on a bottom-up volume model that cross-references reported production data from refinery operators, IEA aromatics supply statistics, and demand-side pull from PET resin, polyester, and industrial solvent channels. Historical values for 2021–2024 are anchored to actual trade and production records; 2025 is the base year; 2026–2035 figures apply the calibrated CAGR forward.

Xylene Market Size and Forecast
Our Impact
Enabled $4.3B Revenue Impact for Fortune 500 and Leading Multinationals
Partnering with 2000+ Global Organizations Each Year
30K+ Citations by Top-Tier Firms in the Industry
 

Driver Impact Analysis

Driver ~% Impact on CAGR Geographic Relevance Impact Timeline
PET & polyester fibre demand growth ~1.5% Asia-Pacific, Global Short-term (≤2 yr)
Crude-to-chemicals complex integration ~1.0% Middle East, China Medium-term (2–4 yr)
India refinery aromatics capacity expansion ~0.6% South Asia Medium-term (2–4 yr)
Bio-based xylene offtake agreements ~0.4% Europe, North America Long-term (≥4 yr)
Industrial solvent chemicals demand recovery ~0.3% North America, Europe Short-term (≤2 yr)
Paraxylene production expansion programmes ~0.5% China, Saudi Arabia Medium-term (2–4 yr)
Rising demand for chemical intermediates in specialty polymers ~0.3% Global Long-term (≥4 yr)


PET and Polyester Fibre Demand

The single largest driver of the Xylene Market is the relentless expansion of PET packaging and polyester textile capacity. Global PET resin capacity additions exceeded 8 million tonnes in 2023–2024 alone, according to sources, with the lion's share located in China and Southeast Asia. Each tonne of PET requires approximately 0.86 tonnes of paraxylene production, creating direct and predictable demand pull. Brand-owner commitments—such as Coca-Cola's 2030 pledge to source 50% of PET from recycled or bio-based content—are modifying feedstock sourcing but not eliminating total paraxylene production volumes in the near term.

Crude-to-Chemicals Complex Integration

The cost structure of the supply of aromatic hydrocarbon solvents is being drastically altered by integrated refinery-to-chemicals setups. Petroleum-based xylene production at marginal costs that independent European and Japanese crackers cannot match is made possible by Saudi Aramco's Amiral complex in Jubail, a USD 11 billion project that will be commissioned in phases until 2027 and produces aromatics yield rates considerably above the global norm [4]. Middle Eastern producers will continue to dominate the market for at least the next ten years because of these massive initiatives.


India Aromatics Capacity Expansion

India's National Petrochemical Policy and the USD 7.2 billion Ratnagiri Refinery & Petrochemicals project represent a structural shift in the South Asian supply of refinery chemicals. Indian domestic PET demand is growing at roughly 9% annually as packaged goods penetration accelerates, creating a captive market for domestic paraxylene production that reduces import dependency and anchors regional Xylene Market growth [5].

Industrial Solvent Chemicals Demand

In 2025, the second-largest application segment was made up of paint solvent materials and industrial cleaning solvents together. Despite formulation pressure from VOC restrictions, the U.S. coatings sector, which is valued at over USD 30 billion domestically, still uses mixed xylene products as a key diluent. While medium-term volumes are dependent on reformulation schedules under the EPA's National Emission Standards, near-term demand is sustained by construction activity and auto refinishing [7].


Restraints Impact Analysis

Restraint ~% Drag on CAGR Geographic Relevance Impact Timeline
Volatile naphtha feedstock prices ~0.7% Global Short-term (≤2 yr)
Tightening VOC regulations (EU, U.S.) ~0.5% Europe, North America Medium-term (2–4 yr)
Overcapacity in the Chinese PX sector ~0.4% Asia-Pacific Short-term (≤2 yr)
Substitution by non-aromatic solvents ~0.3% Europe Long-term (≥4 yr)
Logistics and storage hazard compliance costs ~0.2% Global Long-term (≥4 yr)


Naphtha Price Volatility

Naphtha is the primary feedstock for catalytic reforming and downstream hydrocarbon processing chemicals, and its price correlates closely with Brent crude. A 10% swing in Brent translates to a roughly 7–8% movement in reformate costs, directly compressing margins for merchant xylene producers. The IEA's 2024 Fuel Market Report projected continued near-term naphtha price volatility as refinery run rates adjust to shifting demand patterns [10], creating planning uncertainty for buyers and sellers in the Xylene Market.

VOC Regulatory Pressure

Users of paint solvent materials and industrial solvent chemicals must pay more to comply with the EU's updated Industrial Emissions Directive (IED), which goes into force in 2024, and the U.S. EPA's continuous tightening of National Ambient Air Quality Standards for ozone precursors. Even as total coatings volumes increase, these laws are speeding reformulation toward aqueous and high-solids coatings, which lowers per-unit xylene intensity [11]. In industrialized markets, the result is a structural slowdown in the growth of solvent-grade demand.


Chinese PX Overcapacity

China's rapid expansion of its paraxylene production capacity—more than 15 million tonnes of new capacity deployed annually between 2019 and 2024—caused a protracted period of margin compression that has extended around the world. In 2023, operating rates at a number of Hengli and Zhejiang Petrochemical trains fell below 85%, which put pressure on contract pricing for mixed xylene products throughout Asia-Pacific [12]. Although the short-term investment enthusiasm for additional capacity is tempered, the overhang is anticipated to dissipate when downstream PET demand catches up.


Xylene Market Opportunities

Bio-Based Xylene Scale-Up

Long-term offtake agreements between bio-xylene producers and major consumer goods brands create a commercialisation pathway that did not exist five years ago. Virent's BioFormPX technology and Anellotech's Bio-TCat process have both reached pilot-commercial scale, backed by offtake commitments from Toray and Danone [6]. The Xylene Market opportunity here is concentrated in Europe and North America, where regulatory and brand-driven premiums can absorb the 20–40% production cost premium that bio-based routes currently carry relative to petroleum streams

Specialty Chemical Intermediates in Electronics

Ultra-high-purity xylene grades are gaining ground as solvents in semiconductor photoresist stripping and LCD panel cleaning applications. Taiwan and South Korea's chipmakers require sub-ppb metal contamination levels in aromatic hydrocarbon solvents, a standard that few commodity producers currently meet. Suppliers that invest in purification train upgrades can capture premium margins well above commodity mixed xylene product pricing

Middle East & Africa Downstream Expansion

Saudi Arabia's Vision 2030 and the UAE's industrial diversification agenda are generating demand for domestic downstream processing of refinery chemicals, including xylenes. The SABIC-Aramco integration and ADNOC Chemicals' expansion into polyester intermediates create a structural demand base for paraxylene production within the MEA region rather than exporting feedstocks

Emerging Market Solvent Demand in South and Southeast Asia

Vietnam, Indonesia, and Bangladesh are scaling up paint and coatings manufacturing as urbanisation and construction accelerate. These markets currently import a significant share of their paint solvent materials requirements, representing a captive demand pool for regional xylene distributors. MRFR estimates that ASEAN-region solvent-grade xylene demand will grow at above 5.5% annually through 2030, outpacing the global average.

Chemical Recycling and Circular Xylene Models

Plastic-to-fuel and plastic-to-aromatic technologies—such as those commercialised by Plastic Energy and Brightmark—generate mixed xylene products as a co-product of post-consumer PET depolymerisation. These circular chemical intermediates attract ESG premiums from consumer-facing brands and may access carbon credit revenues under emerging voluntary carbon market frameworks, representing a new business model for xylene supply chains


Xylene Market Future Outlook

Circular Economy and Chemical Recycling Integration

The decade ahead will see circular chemical intermediates transition from pilot curiosity to commercial reality within the Xylene Market. Chemical recycling technologies that crack post-consumer PET back to paraxylene production feedstocks are projected by the Ellen MacArthur Foundation to process over 2 million tonnes annually by 2030 [15]. As brand-owner ESG commitments harden, the price premium for certified-circular xylene isomers will rise, creating margin-accretive segments within an otherwise commodity-priced market.

AI-Driven Refinery Optimisation for Aromatics Yields

Advanced process control and AI-based optimisation tools are being deployed across refinery chemicals operations to maximise aromatics selectivity. ExxonMobil's deployment of machine learning-based advanced process control at its Beaumont complex reportedly improved para-selectivity yields by 1.8 percentage points, equivalent to tens of millions of dollars in annual margin uplift [16]. As these tools proliferate across Asian integrated complexes, production efficiency gains will structurally lower the cost floor for aromatic hydrocarbon solvents.

ESG-Driven Supply Chain Transparency

Major consumer brands are extending supplier codes of conduct to include scope 3 emissions from petrochemical feedstocks, including paraxylene production. Apparel companies have signed collective purchasing agreements committing to bio-based polyester pathways, while beverage producers are investing directly in bio-PET capacity. This ESG pull will not displace petroleum feedstocks at scale within the forecast window, but it will meaningfully fund the scale-up of bio-based alternatives that could claim 5–8% of supply by 2035 [6][15].

Geopolitical Supply Chain Reconfiguration

The U.S.–China trade tensions and European energy security concerns following the 2022 gas supply disruption are prompting buyers to diversify chemical intermediates sourcing. India, Saudi Arabia, and the UAE are the primary beneficiaries, each offering integrated refinery chemicals capacity with logistical reach into multiple end-markets. MRFR expects that supply chain reconfiguration will add 2–3% to the effective addressable market for non-Chinese paraxylene production by 2030, supporting pricing resilience outside of Asia-Pacific. [17]


Xylene Market Segmentation

By Type

Segment 2025 Share (%) Primary Demand Driver
Para-Xylene 91.0% PET resin and polyester fibre production
Ortho-Xylene 6.5% Phthalic anhydride for alkyd resins
Meta-Xylene 2.5% Isophthalic acid for specialty polyesters


Para-xylene's commanding share of the Xylene Market reflects its indispensable role as the feedstock for paraxylene production of purified terephthalic acid (PTA), the building block of PET resin. The structural linkage between PET packaging demand—itself growing at roughly 5% annually as beverage and food sectors expand—and para-xylene consumption means this segment's dominance is not threatened within the forecast window. Dedicated para-xylene production units using UOP Parex and Axens Eluxyl adsorptive separation technologies are progressively displacing older crystallisation-based processes, improving yield and reducing energy consumption.

Ortho-xylene's 4.52% CAGR through 2035 is driven by phthalic anhydride demand in alkyd resin production for paint solvent materials and plasticiser applications. The coatings industry's ongoing growth in emerging markets more than offsets demand rationalisation from VOC-driven reformulation in Europe. Meta-xylene, while the smallest isomer, benefits from the rising use of isophthalic acid in glass fibre laminates and specialty packaging applications.

By Grade

Segment CAGR 2026–2035 Primary Demand Driver
Technical Grade 4.40% Industrial solvent chemicals, PX feedstock
High-Purity Grade 5.10% Electronics, pharmaceutical, and laboratory solvents


Technical-grade xylene accounts for the bulk of Xylene Market volumes, serving as a direct feed to paraxylene production units and as an industrial solvent and chemical base for coatings, adhesives, and cleaning applications. High-purity grade, while a smaller volume segment, commands a significant price premium—often 30–50% above commodity mixed xylene products—reflecting the investment required in distillation and metals removal. Semiconductor fabrication and LCD panel manufacturing in Taiwan, South Korea, and Japan are the primary growth drivers for this sub-segment.

By Source

Segment 2025 Share (%) Primary Demand Driver
Petroleum-Based 96.0% Refinery catalytic reformate; aromatics extraction
Bio-Based 4.0% Circular economy mandates; brand ESG commitments


Petroleum-based streams retain near-total dominance of the Xylene Market, a position that will erode only gradually through 2035 as bio-based routes scale up. The economics of bio-based aromatic hydrocarbon solvents depend heavily on bio-feedstock costs—currently 2–3x above naphtha on an energy-equivalent basis—and on the premium that brands will pay for certified-sustainable content. Bio-based xylene is forecast to expand at approximately 6.1% CAGR as offtake agreements with major consumer brands provide the revenue certainty needed to justify capital investment in commercial-scale plants.

By Application

Segment CAGR 2026–2035 Primary Demand Driver
Solvents 4.60% Paint solvent materials, industrial cleaning solvents
Monomers 4.80% PET, polyester, specialty polymer intermediates
Other Applications 3.90% Pharmaceuticals, agro-chemicals, fuel blending


Solvent applications remain the Xylene Market's second-largest segment by volume, encompassing paint solvent materials, industrial cleaning solvents, and thinners for adhesives and printing inks. The monomer segment—dominated by para-xylene as PTA feedstock—is the fastest-growing sub-category, benefiting from the global PET packaging boom. Other applications, including the use of xylene as a pharmaceutical intermediate solvent and a component of aviation fuel blends, are stable but slower-growing.

By End-User Industry

Segment 2025 Share (%) Primary Demand Driver
Plastics & Polymers 71.5% PET resin, polyester fibre, PBT engineering plastics
Paints & Coatings 14.0% Architectural coatings; automotive refinishing
Printing Inks & Adhesives 7.5% Packaging printing; industrial bonding
Pharmaceuticals & Others 7.0% Solvent purification; agro-chemical formulation


Plastics and polymers' dominant share of the Xylene Market underscores how completely the segment is driven by polyester value chain dynamics rather than traditional solvent demand. The paints and coatings segment, while under pressure from VOC regulations in Europe and North America, retains resilience in emerging markets where architectural coatings growth runs at 6–7% annually [7]. Printing inks and adhesives represent a stable, mature application where xylene isomers face gradual substitution by lower-VOC alternatives in regulated markets.


Regional Market Share Analysis

Region 2025 Share (%) Primary Investment Themes
Asia-Pacific 53.0% PET capacity, crude-to-chemicals, India refinery build
North America 19.0% Gulf Coast PX expansions, solvent demand recovery
Europe 14.0% Bio-xylene, VOC compliance, circular chemicals
Middle East & Africa 8.5% Vision 2030, ADNOC polyester intermediates
South America 5.5% Brazil PET packaging, Argentina refinery upgrades
Total 100%  


North America

Country CAGR 2026–2035 Key Driver
United States 4.10% Gulf Coast PX expansions; automotive coatings solvent demand
Canada 3.40% Downstream petrochemical diversification; Alberta refinery upgrades
Mexico 4.80% Manufacturing sector growth; rising paint solvent materials demand


North America's Xylene Market is anchored by the U.S. Gulf Coast, where ExxonMobil's Beaumont expansion and Flint Hills Resources' Corpus Christi complex provide scale and logistical access to Latin American export markets. The U.S. EPA's NESHAP regulations governing xylene emissions from surface coating operations are accelerating reformulation in automotive OEM paint lines but simultaneously increasing demand for high-purity, low-odour solvent grades [7]. Mexico's expanding manufacturing base—particularly in automotive and electronics assembly—is generating incremental industrial solvent chemicals demand that domestic supply cannot fully meet.

Europe

Country 2025 Regional Share (%) Key Driver
Germany 22% Specialty chemicals, automotive coatings
United Kingdom 11% Downstream petrochemical processing, bio-chemical pilots
France 10% Coatings and adhesives manufacturing
Italy 9% Plastics processing, PET packaging
Spain 7% Refinery integration, Mediterranean trade hub
Nordic Countries 6% Bio-based chemical intermediates R&D
Russia 8% Domestic aromatics production, export flows
Rest of Europe 27% Diverse downstream applications


Europe's Xylene Market faces a structural squeeze between rising compliance costs from the revised IED and stagnant GDP-linked industrial production. Germany remains the largest single European consumer, driven by its automotive OEM supply chain and specialty paint solvent materials sector. The UK and Nordic countries are emerging as centres for bio-based aromatic hydrocarbon solvents research, with Horizon Europe funding over EUR 180 million in bio-aromatics projects through 2027 [6].

Asia-Pacific

Country 2025 Share of Region (%) Key Driver
China 55% Integrated PX-PET complexes; domestic polyester demand
India 13% Refinery aromatics expansion; growing PET consumption
Japan 7% High-purity solvent grades; specialty chemical intermediates
South Korea 6% PX export capacity; electronics-grade solvents
ASEAN 10% Industrial growth; paint solvent materials import demand
Rest of Asia-Pacific 9% Emerging refinery projects; packaging demand


Asia-Pacific dominates the global Xylene Market and will continue to do so through 2035. China's Zhejiang Petrochemical and Hengli Petrochemical complexes alone account for over 20 million tonnes per annum of paraxylene production capacity, embedding China as both the largest producer and the largest consumer of xylene isomers globally [8]. India's IOC Panipat and HPCL-Mittal Energy complexes are adding aromatics extraction units under the government's AtmaNirbhar Bharat industrial self-reliance programme, targeting a 30% reduction in PX import dependency by 2028 [5].

South America

Country CAGR 2026–2035 Key Driver
Brazil 4.20% PET beverage packaging; Braskem downstream integration
Argentina 3.10% Refinery upgrades; industrial solvent chemicals
Rest of South America 3.80% Growing coatings and packaging sector


Brazil's Xylene Market is supported by Braskem's integrated petrochemical operations and strong domestic PET demand from the beverage sector, which consumes over 600,000 tonnes of PET resin annually. Petrobras' refinery modernisation programme includes aromatics recovery units at its Duque de Caxias complex that will reduce Brazilian reliance on imported mixed xylene products.

Middle East & Africa

Country 2025 Share of Region (%) Key Driver
Saudi Arabia 42% Aramco-SABIC crude-to-chemicals; paraxylene production scale
UAE 20% ADNOC Chemicals expansion; re-export hub
South Africa 12% Sasol aromatics; domestic coatings demand
Egypt 9% Refinery chemicals; downstream PET investment
Rest of MEA 17% Emerging industrial base; import substitution


Saudi Arabia's Xylene Market position is transforming from a net-exporter of feedstocks to an integrated producer of chemical intermediates and downstream polymers. SABIC's Yanbu Petrochemical Complex and the Sadara Chemical joint venture with Dow represent over USD 20 billion in combined investment anchoring this transition [4]. The UAE's Ruwais complex is emerging as a re-export hub for South Asian markets, exploiting logistics cost advantages relative to Northeast Asian producers.


Xylene Market By Region, 2025-2035
 

Competitive Benchmarking

The Xylene Market exhibits medium concentration, with an estimated Herfindahl-Hirschman Index in the range of 900–1,100, reflecting the dominance of a handful of large integrated producers alongside numerous mid-scale regional players. The top five producers—China Petroleum & Chemical Corporation (Sinopec), Saudi Aramco/SABIC, ExxonMobil, CNPC, and BP—account for an estimated 45–50% of global paraxylene production capacity. The competitive dynamic increasingly favours scale and upstream integration; merchant-grade xylene producers without captive naphtha supply face persistent margin pressure.

Company Est. Revenue Share Range Key Offerings for Xylene Market Strategic Positioning
Sinopec (China Petroleum & Chemical) 14–18% Mixed xylene products, para-xylene, and PTA feedstocks Largest global PX producer; vertically integrated to PET
Saudi Aramco / SABIC 9–12% Aromatic hydrocarbon solvents, chemical intermediates Crude-to-chemicals integration; low-cost producer
ExxonMobil Chemical 7–10% Paraxylene production, technical-grade solvents U.S. Gulf Coast scale; UOP technology licensee
CNPC (PetroChina) 6–9% Refinery chemicals, mixed xylene products Domestic China supply integration; export capability
BP Chemicals 5–8% Para-xylene, industrial solvent chemicals Acetyls and aromatics integration; global trading
CEPSA (Compañía Española de Petróleos) 4–6% Ortho-xylene, paint solvent materials European aromatics specialist; Huelva complex
Reliance Industries Limited 4–7% Para-xylene, polyester chemical intermediates India's largest PX producer; Jamnagar integration
Toray Industries 3–5% High-purity xylene for specialty polymers Japanese precision chemicals; bio-polyester offtake
GS Caltex 3–5% Mixed xylene products, solvent-grade streams South Korean refinery; Asia-Pacific distribution
Flint Hills Resources 2–4% Petroleum-based solvents, hydrocarbon processing chemicals U.S. Midwest and Gulf Coast distribution


Recent News & Developments


  • Mitsubishi Gas Chemical (September 2025): Due to low mixed-xylene pricing, Mitsubishi Gas Chemical closed its 20,000-ton meta-xylenediamine factory in Rotterdam, incurring an impairment of EUR 50.2 billion.
  • Saudi Aramco and Sinopec (January 2025): Saudi Aramco and Sinopec decided to build a 1.5 million-ton aromatics facility and a 1.8 million-ton ethylene cracker at Yanbu with a start-up date of 2030.


Xylene Market Report Scope

Parameter Detail
Market Scope Global Xylene Market covering ortho-, meta-, and para-xylene isomers; all grades; all sources; all applications
Study Period 2021–2035 (Historical: 2021–2024; Base Year: 2025; Forecast: 2026–2035)
CAGR 4.64% (2026–2035)
Market Size Checkpoints 2025: USD 48,210 Million; 2030: USD 60,480 Million; 2035: USD 75,840 Million
Fastest Growing Segment Bio-Based Source (~6.1% CAGR); High-Purity Grade (~5.1% CAGR)
Fastest Growing Region Asia-Pacific (~4.90% CAGR)
Companies Profiled 10 major players (Section 10); additional regional players in country analyses
Valuation Currency USD Million
Volume Unit Million Tonnes (supplemental)
Data Sources Primary interviews with industry participants; secondary data from IEA, ICIS, IHS Markit, and company filings


FAQs

How should procurement teams approach contract structuring for mixed xylene products, given current price volatility?

Buyers with annual volumes above 50,000 tonnes should consider index-linked contracts tied to the ICIS MX Assessment rather than fixed-price annual deals, as naphtha swings can move xylene spot prices 15–25% within a quarter. Hybrid structures—50% indexed, 50% fixed—are gaining favour among coatings manufacturers seeking budget predictability without full market exposure. [2][10]

Which certification schemes apply to bio-based xylene for brand ESG reporting purposes?

The International Sustainability & Carbon Certification (ISCC PLUS) and the RSB Advanced Products standard are the two most recognised schemes for bio-based aromatic hydrocarbon solvents traceability. ISCC PLUS covers mass-balance and segregated supply chains, enabling brands to make partial bio-content claims without requiring fully segregated logistics. [6]

What is the realistic timeline for bio-based xylene to reach cost parity with petroleum-based production?

Independent techno-economic assessments put bio-based paraxylene production costs at 1.8–2.5x conventional petroleum routes at the current scale. Cost parity requires biomass feedstock cost reductions of roughly 40% or carbon pricing above USD 120 per tonne CO₂, a level not currently anticipated in most regulatory scenarios before 2035. [6][25]

How are VOC regulations specifically affecting investment decisions in xylene-based solvent formulation?

Coatings formulators are accelerating waterborne and high-solids reformulation programmes, with capital expenditure on low-VOC production lines rising by an estimated 18% annually in the EU since 2022. However, substitution timelines for industrial maintenance coatings—where aromatic hydrocarbon solvents remain technically superior—are considerably longer than for architectural applications. [11][24]

What competitive advantage do integrated crude-to-chemicals producers hold over standalone naphtha crackers in the Xylene Market?

Integrated producers capture naphtha internally at refinery transfer prices, effectively reducing their aromatic feedstock cost by USD 40–80 per tonne relative to standalone crackers purchasing on spot markets. This structural cost gap widens during periods of tight naphtha supply, making margin compression for non-integrated producers particularly severe during crude price spikes. [4]

Are there meaningful investment-grade opportunities in ortho-xylene specifically, or does para-xylene dominate all capital allocation?

Ortho-xylene is commercially viable as a standalone investment in regions with strong alkyd resin and phthalate-free plasticiser demand growth, particularly Southeast Asia and South Asia. Producers targeting ortho-xylene dedicate specific isomerisation and distillation assets to achieve the purity required for phthalic anhydride manufacture, which commands a price premium over commodity mixed xylene products.

How does the electronics-grade xylene segment differ technically from commodity-grade, and what barriers exist to entering that market?

Electronics-grade xylene requires metal impurity levels below 10 parts per billion and water content below 50 ppm, standards that demand dedicated distillation columns, inert-atmosphere handling, and validated analytical protocols per SEMI standards. The primary barrier to entry is the cost of segregated high-purity processing infrastructure, which typically requires USD 15–30 million in capital investment for a 20,000-tonne-per-annum train.[16]


FAQs

What is the current valuation of the Xylene Market as of 2024?

The Xylene Market was valued at approximately 52754.91 USD Million in 2024.

What is the projected market valuation for the Xylene Market in 2035?

The market is projected to reach a valuation of around 136157.97 USD Million by 2035.

What is the expected CAGR for the Xylene Market during the forecast period 2025 - 2035?

The expected CAGR for the Xylene Market during the forecast period 2025 - 2035 is 9.0%.

Which companies are considered key players in the Xylene Market?

Key players in the Xylene Market include ExxonMobil, Royal Dutch Shell, BP, SABIC, TotalEnergies, LyondellBasell, Mitsubishi Chemical, Formosa Plastics, and Reliance Industries.

What are the primary applications of xylene in the market?

The primary applications of xylene include solvent, chemical intermediate, fuel additive, coating, and adhesive.

How does the automotive sector contribute to the Xylene Market?

The automotive sector is projected to contribute between 10500.0 and 27000.0 USD Million to the Xylene Market.

What is the market size for para-xylene compared to other types?

Para-xylene is expected to dominate the market with a valuation range of approximately 32754.91 to 85157.97 USD Million.

What distribution channels are utilized in the Xylene Market?

Distribution channels in the Xylene Market include direct sales, distributors, and online sales, with varying contributions.

What forms of xylene are available in the market?

Xylene is available in liquid, solid, and gas forms, with liquid xylene having the largest market share.

How does the construction industry impact the Xylene Market?

The construction industry is anticipated to contribute between 8000.0 and 20000.0 USD Million to the Xylene Market.
Author
Author
Author Profile
Chitranshi Jaiswal LinkedIn
Team Lead - Research
Chitranshi is a Team Leader in the Chemicals & Materials (CnM) and Energy & Power (EnP) domains, with 6+ years of experience in market research. She leads and mentors teams to deliver cross-domain projects that equip clients with actionable insights and growth strategies. She is skilled in market estimation, forecasting, competitive benchmarking, and both primary & secondary research, enabling her to turn complex data into decision-ready insights. An engineer and MBA professional, she combines technical expertise with strategic acumen to solve dynamic market challenges. Chitranshi has successfully managed projects that support market entry, investment planning, and competitive positioning, while building strong client relationships. Certified in Advanced Excel & Power BI she leverages data-driven approaches to ensure accuracy, clarity, and impactful outcomes.

Research Approach


Secondary Research

The secondary research process involved comprehensive analysis of petrochemical industry databases, regulatory filings, technical journals, and authoritative energy organizations. Key sources included the US Energy Information Administration (EIA), International Energy Agency (IEA), Organization of the Petroleum Exporting Countries (OPEC), American Fuel & Petrochemical Manufacturers (AFPM), European Chemical Industry Council (Cefic), American Chemistry Council (ACC), National Institute of Standards and Technology (NIST), US Environmental Protection Agency (EPA), European Chemicals Agency (ECHA), International Agency for Research on Cancer (IARC), World Bank Commodity Markets, UN Comtrade Database, China Petroleum and Chemical Industry Federation (CPCIF), Japan Petrochemical Industry Association (JPIA), and national petrochemical ministry reports from key producing markets. These sources were used to collect production capacity statistics, refinery output data, regulatory compliance standards, safety handling protocols, trade flow analysis, and market landscape evaluation for P-Xylene, O-Xylene, M-Xylene, and Mixed Xylene segments across automotive, textile, chemical, oil & gas, leather, and paints & coatings end-use industries.


Primary Research

Qualitative and quantitative insights were obtained by interviewing supply-side and demand-side stakeholders during the primary research process. The supply-side sources consisted of CEOs, VPs of Manufacturing, refinery operations leaders, and commercial directors from xylene producers, petrochemical manufacturers, and aromatics refiners. Demand-side sources included procurement directors from polyester manufacturers, textile industry purchasers, chemical synthesis plant managers, automotive OEM material scientists, and coating formulators from the industrial and automotive sectors. Market segmentation was verified, capacity expansion timelines were confirmed, and insights regarding feedstock pricing dynamics, supply chain logistics, substitution trends, and regional demand patterns were obtained through primary research.

Primary Respondent Breakdown:

By Designation: C-level Primaries (28%), Director Level (32%), Others (40%)

By Region: North America (28%), Europe (32%), Asia-Pacific (35%), Rest of World (5%)


Market Size Estimation

Global market valuation was derived through production capacity mapping and consumption volume analysis. The methodology included:

Identification of over 50 significant manufacturers and refiners in North America, Europe, Asia-Pacific, the Middle East and Africa, and Latin America

Product mapping across P-Xylene, O-Xylene, M-Xylene, and Mixed Xylene categories with purity grades and application specifications

Analysis of reported and modeled annual revenues specific to xylene and aromatics portfolios

Coverage of manufacturers representing 75-80% of global production capacity in 2024

Extrapolation using bottom-up (consumption volume × ASP by region/end-use) and top-down (producer revenue validation) approaches to derive segment-specific valuations, accounting for refinery integration economics and cracker feedstock differentials

Download Free Sample

Kindly complete the form below to receive a free sample of this Report

Download PDF ×

We do not share your information with anyone. However, we may send you emails based on your report interest from time to time. You may contact us at any time to opt-out.